Formation mechanisms of sub-micron pharmaceutical composite particles derived from far- and near-field Raman microscopy
2021-09-14JkonerJenBptisteCotyYnBusyDenisSpitzer
Jko Hüner , Jen-Bptiste Coty , Yn Busy , Denis Spitzer ,
a Nanomat′eriaux pour Les Systˋemes Sous Sollicitations Extr^emes(NS3E),ISL-CNRS-UNISTRA UMR 3208,French-German Research Institute of Saint-Louis,5,Rue Du G′en′eral Cassagnou, B.P. 70034, 68301, Saint-Louis, France
b Spinofrin SAS, 20 Bis Rue Danjou, 92100, Boulogne, Billancourt, France
Keywords:SERS Confocal Raman microscopy Surface characterization Sub-micron particles Pharmaceutic composites
ABSTRACT Surface enhanced Raman spectroscopy(SERS)and confocal Raman microscopy are applied to investigate the structure and the molecular arrangement of sub-micron furosemide and polyvinylpyrrolidone(furosemide/PVP)particles produced by spray flash evaporation(SFE).Morphology,size and crystallinity of furosemide/PVP particles are analyzed by scanning electron microscopy (SEM) and X-ray powder diffraction (XRPD). Far-field Raman spectra and confocal far-field Raman maps of furosemide/PVP particles are interpreted based on the far-field Raman spectra of pure furosemide and PVP precursors.Confocal far-field Raman microscopy shows that furosemide/PVP particles feature an intermixture of furosemide and PVP molecules at the sub-micron scale. SERS and surface-enhanced confocal Raman microscopy (SECoRM) are performed on furosemide, PVP and furosemide/PVP composite particles sputtered with silver (40 nm). SERS and SECoRM maps reveal that furosemide/PVP particle surfaces mainly consist of PVP molecules. The combination of surface and bulk sensitive analyses reveal that furosemide/PVP sub-micron particles are formed by the agglomeration of primary furosemide nanocrystals embedded in a thin PVP matrix. Interestingly, both far-field Raman microscopy and SECoRM provide molecular information on a statistically-relevant amount of sub-micron particles in a single microscopic map; this combination is thus an effective and time-saving tool for investigating organic sub-micron composites.
1. Introduction
In the last decades, sub-micron and nanoparticles have found their use in a huge variety of medical and pharmaceutic applications. Among others, composite particles are commonly used as drug delivery agents, as drug carriers, as contrast agents in diagnostic techniques like magnetic resonance imaging and in cancer therapies [1-5]. In pharmaceutic research and industry, the downsizing of active pharmaceutical ingredients (API) on the submicron or nanoscale is a paramount topic attracting more and more interests.In particular,downsizing of pharmaceutic particles would allow the increase in the aqueous solubility and the dissolution kinetic of API molecules due to the increased surface-to-volume ratio [6-8]. Clinical tests confirm that downsizing of APIs on the sub-micron or nanoscale improves their solubility,their dissolution kinetic and thus their bioavailability within the human body[8,9].The formulation of nanoscale APIs is often undertaken by the use of biocompatible polymers working as host materials confining the drug within the polymeric network or as nanocapsules embedding nanocrystalline or amorphous APIs[10-13].The development and the design of improved amorphous solid API/polymer composites,arranged in a high surface area matrix, require the parallel development of advanced spectroscopies and microscopies capable of chemical and molecular imaging on such fragile organic submicron particles [14-16]. This information would allow determining the very crucial structure-to-function relations for solubility,dissolution velocity and bioavailability.Conventional analytical techniques struggle to face this challenge because of the need of combining high sensitivity,high chemical and molecular selectivity versus possibly similar organic molecules, imaging capability with high lateral resolution (below 100 nm) and a sufficiently low energy input in order to preserve APIs and prevent their dissociation,oxidation or internal recombination.
Not surprisingly, it has been recently reported that the lack of methods allowing for the precise characterization of molecular nanocomposites at the sub-micron scale is hampering the development of such systems in the pharmaceutical area[17,18].The first reason is that the poor knowledge about particles surface composition hinders the understanding of their in vivo behavior which depends on the interaction between biological elements encountered in the body and the particle surface[17,19].Secondly,for such increasingly complex molecular systems, the batch-to-batch consistency needs to be validated with the highest accuracy, which is unfortunately not possible today with conventional methods.Therefore, the development of viable advanced characterization methods and protocols is very crucial for organic nanocomposites.
In this work, surface-enhanced confocal Raman microscopy(SECoRM)and confocal far-field Raman microscopy were applied to investigate nano sub-structured sub-micron pharmaceutic composite particles. The SECoRM technique ensures the high surface sensitivity of surface-enhanced Raman spectroscopy(SERS)and the high resolution of confocal Raman microscopy.On the other hand,far-field Raman microscopy is a volume-sensitive method that mainly provides information about the bulk and thus complements the SeCoRM data to get an idea of the arrangement of the compounds within the composite particles. Near-field (tip-enhanced)Raman spectroscopy has recently been applied to investigate surface and structural properties of nanoscale organic composites[20-22].
However, up to now, SERS experiments have been typically carried out by depositing the analyte onto special SERS substrates[23-25]. Typical SERS substrates consist of (precious) metal nanostructures (e.g. nanoparticles) providing a collective oscillation of their conductive band electrons in resonance with the incident light (localized surface plasmon resonances (LSPR)),leading to a strong enhancement of the electric field close to the metal nanostructure surfaces [23-26]. A multitude of SERS substrates and manufacturing procedures have been reported in literature,providing for nanostructures with different sizes,shapes,materials and arrangements [23,27-30]. However, the deposition of sub-micron composite particles on SERS substrates may not lead to the desired accuracy in measuring the particle structure and arrangement since SECoRM maps are recorded in reflection mode.Accordingly, the field-enhancing metal nanoparticles would be located below the sub-micron analyte particles from the view of the microscope objective.Thus,the incident light would have to travel through the whole analyte particle before interacting with the conductive band electrons of the metal nanoparticles in this configuration. Additionally, scattered light has to travel again through the sample before reaching the detector leading to a further loss of signal intensity.In order to receive a sufficient signal quality, the laser power must be increased resulting in a stronger contribution of far-field signals to the recorded Raman spectra. To overcome this limitation,in this study,organic sub-micron particles were directly coated with silver nanoparticles deposited by sputtering.The so formed silver nano grains,better referred to as silver surface plasmon amplification by stimulated emission of radiation(spasers),are directly formed on top of the analyte particle surface[31]. As a consequence of the strong local field enhancement, the intensity of the incident laser light can be drastically reduced so that Raman spectra will be dominated by near-field signals.
As a model system, results obtained on furosemide/polyvinylpyrrolidone (PVP) sub-micron composite particles produced using the spray flash evaporation (SFE) process were presented.Furosemide is a poorly water-soluble loop diuretic and PVP is a common biocompatible polymer. The technique has been previously described elsewhere and it has the advantage of allowing for the continuous production of sub-micron and nanoscale organic compounds and composites from the vacuum spraying of a pressurized and heated solution [22,32-38].
2. Experimental
2.1. Chemicals
Furosemide and polyvinylpyrrolidone (PVP, K30) were purchased from Sigma-Aldrich(St.Louis,Missouri,USA)and were used without further purification. Ethanol absolute (>99.98%, AnalR Normapur) was sourced by VWR (Radnor, PA, USA), and dichloromethane (DCM) (>99.5% for synthesis) was provided by Carl Roth GmbH (Karlsruhe, Germany). Both solvents were used without further purification.
2.2. Production of furosemide/PVP sub-micron composite particles
Furosemide/PVP sub-micron composite particles were produced by SFE process (Fig. 1). A solution of 3.0 g furosemide and 1.0 g PVP in a solvent mixture of 240 mL ethanol and 160 mL dichloromethane was prepared first. This solution was given into the solution tank of a vertical SFE crystallizer pressurized at 40 bar(N2). The furosemide/PVP solution was sprayed through a 120°C preheated hollow cone nozzle with a diameter of 100 μm into a vacuum reactor chamber with a base pressure below 0.1 mbar.The pressure inside the SFE atomization chamber varied between 5 and 10 mbar during the spraying process. After the fast solvent evaporation,furosemide/PVP submicron particles were collected with a steel filter as white-yellowish ultra-fine powder.
2.3. Silver coating of furosemide, PVP and furosemide/PVP submicron particles
For SERS, furosemide, PVP and furosemide/PVP submicron particles were deposited on glass substrates and uniformly distributed by a gentle robbing of two glasses. Afterwards, the cover glasses were sputtered silver in an HHV Auto 306 (Bangalore, India)sputtering device at a distance of 15 cm from the silver target. All prepared samples were directly coated with 40 nm nominal thickness of silver at a deposition rate of 4.0 Å/s. A schematic representation of the silver coating and the formed silver spaser on a submicron composite particle formed by two compounds with random molecular arrangement is presented in Fig.1.
2.4. Analysis methods
Scanning electron microscopy(SEM)images were recorded on a FEI Nova NanoSEM 450(Hillsboro,Oregon,USA)at an acceleration voltage of 10 kV using an in-lens secondary electron detector. To prevent charge accumulation, furosemide/PVP particles were coated with a 10 nm thick layer of gold by sputtering before the analysis.The size distribution and particle mean size of furosemide/PVP sub-micron particles were determined by measuring 260 particles using ImageJ software. The particle size distribution was fitted with a Gaussian line shape using OriginPro 2019b (version 9.6.5.169).
X-ray powder diffraction (XRPD) was performed on a Bruker AXS Advance D8 (Karlsruhe, Germany) diffractometer using Cu-Kα radiation (λ =1.54 Å) in Bragg-Brentano geometry. The acceleration voltage was 40 kV and the operating current was 40 mA. The step size for all scans was set to 0.0148°(2 θ). The loose powder samples were measured on a rotating sample holder. The coherence length Lhklwas calculated from the full width at half maximum (FWHM) of single diffraction peaks by using the wellknown Scherrer equation assuming Gaussian-shaped peaks.
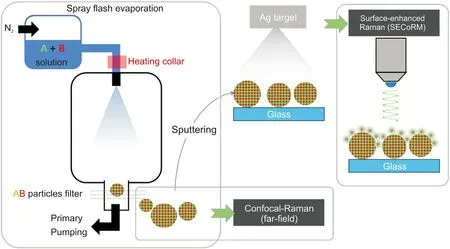
Fig.1. Schematic representation of the performed experiments.Furosemide/PVP sub-micron composites are produced by the spray flash evaporation(SFE)process.The structure of these particles is evaluated by comparing the results of bulk-sensitive confocal far-field Raman microscopy and surface-sensitive surface-enhanced confocal Raman microscopy(SECoRM).
Confocal Raman spectroscopy and microscopy were performed on a HORIBA(Kyoto, Japan) LabRam HR evolution confocal Raman microscope. Single point spectra of uncoated samples were obtained with a linear polarized 532 nm diode laser excitation with an adjusted output power of 1.8 mW at an acquisition time of 3 s/spectrum. Single-point SERS spectra of silver sputtered samples were taken with an acquisition time of 3 s and a laser output power of 54 μW. Confocal far-field Raman microscopy maps of pristine samples and SECoRM maps of silver sputtered samples along the substrate plane were also recorded with the 532 nm diode laser and output power of 54 μW with an acquisition time of 0.5 s/spectrum,and step size between 200 and 500 nm.The laser light was focused onto the sample through a 100 × , 0.9 NA objective. Raman scattered photons were collected by the same objective through an edge filter,a confocal aperture with a diameter adjusted to 200 μm for far-field experiments and 50 μm for SERS experiments and a diffraction grating with 300 lines/mm before hitting a deep cooled CCD camera (- 60°C). Confocal Raman maps were analyzed and treated using LabSpec Spectroscopy Suite 6.4.4. (HORIBA, Kyoto,Japan).
X-Ray photoelectron spectroscopy(XPS)was carried on a Thermo Scientific Escalab 250 Xi (Waltham, MA, USA) by acquiring survey and high-resolution scans of C1s, N1s, Cl2p, O1s and S2p with a monochromatic Al k-α source. Two independent procedures were applied to determine the molecular fraction in the composite surface; the first was by peak fitting the C1s spectrum and comparing the peak area of the component associated to carboxylic groups(R-COOH)from furosemide and the one from R-CNOH groups from PVP.Alternatively,from the N/Cl ratio in pure furosemide formulated by SFE,we derived the furosemide contribution to the total nitrogen content in the furosemide/PVP surface which allows counting the ratio between furosemide and PVP molecules at the composite surface. This ratio was compared with the furosemide:PVP molar ratio in the precursor solution to evaluate the tendency of each compound to form a core-shell arrangement.
3. Results and discussion
3.1. Structure and morphology analysis of furosemide/PVP particles
The first insight on the size, morphology and crystallinity of furosemide/PVP particles is provided by SEM and XRPD analyses(Fig. 2) showing the presence of spherical sub-micron particles with a rough cauliflower-like surface. Furosemide/PVP particles feature a mean diameter size of 0.38 μm (±0.24 μm). The furosemide/PVP sub-micron particles crystal structure was investigated by XRPD. XRPD pattern shows typical reflections from furosemide crystals superimposed a broad amorphous reflection between 16°and 25°ascribed to PVP. The coherence lengths along the main crystallographic directions reveal that furosemide crystals dimensions are below 50 nm, i.e., about ten times smaller than the average particles size estimated from SEM analysis. From these results, we conclude that SEM particles correspond to large aggregates,however,no information is available on the arrangement of furosemide and PVP molecules within single sub-micron composite particles. To fill in this gap, far-field Raman microscopy and SERS is subsequently applied to investigate furosemide/PVP submicron particles.
3.2. Far-field Raman microscopy and SERS investigations of pure furosemide and PVP
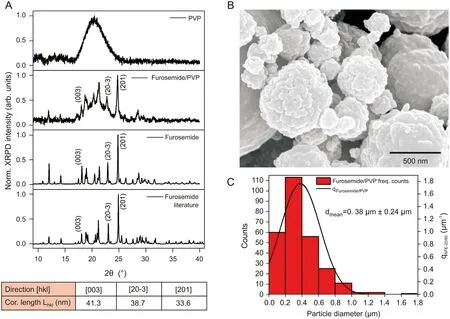
Fig.2. (A)XRPD pattern of furosemide and PVP precursors,furosemide/PVP sub-micron particles and a reference XRD pattern of furosemide.The coherence lengths derived from the XRPD pattern of furosemide/PVP indicate the formation of nano-structured furosemide crystals. (B) SEM image of furosemide/PVP particles characterized by a rough cauliflower-like surface. (C) Furosemide/PVP particles provide a mean size of 0.38 μm (±0.24 μm).
In order to facilitate the interpretation of Raman spectra from furosemide/PVP composites, far-field Raman spectra and maps of pure, commercial furosemide and PVP particles are characterized first. Afterwards, specific marker bands allowing to clearly distinguish between furosemide and PVP signals in the composite particles spectra and images are identified from these datasets.Ideally,marker bands should be selected in wavenumber regions where no(or nearly no) signal superposition occurs. This procedure was already successfully applied in a tip-enhanced Raman spectroscopy study aimed to identify RDX and TNT molecules in RDX/TNT composite nanoparticles and CL-20 and HMX layers in CL-20/HMX nanoscale co-crystals [21,22]. For furosemide, the chosen marker band is the in-plane ring bending vibration at 686 cm-1[39]. For PVP,the selected marker band is the most intense CH2asymmetric stretching vibrations of the saturated PVP chains at 2924 cm-1[40].The far-field Raman spectra and the marker bands of pure furosemide (red) and PVP (green) compounds are shown in Fig. 3A.Specific molecular orientation is known to affect the relative peak intensities in surface-enhanced Raman spectra. Because of this,marker bands selected in far-field spectra may not be useful in the molecular identification in surface-enhanced spectra from silvercoated pure furosemide and PVP particles. The eventual modification of relative peak intensities is useful to demonstrate that the silver spasers are effective in enhancing the local field at the particles surface.For this,pure compounds particles are sputtered with silver at the relatively high sputtering rate of 4.0 Å/s to favor the formation of silver islands spasers instead of a continuous metal layer. Additionally, the diameter of the confocal aperture was reduced from 200 μm to 50 μm under SERS conditions, aiming to minimalize the contribution of far-field Raman signals to the recorded Raman spectra.However,the use of the smaller diameter is more important for the characterization of the furosemide/PVP sub-micron particles (see next section), as it decreases the measurement volume and allows the characterization of only a few submicron particles. To compare the data set of the original compounds with those of the furosemide/PVP particles, the same conditions are used in SERS experiments.As expected,the obtained SECoRM maps of silver-coated furosemide and PVP sensibly differ from the corresponding far-field Raman maps by slight peak position shifts and by the relative Raman intensities. Compared to farfield spectra, SERS spectra show sensibly higher intensities, which allows reducing the intensity of the incoming laser beam by 1/33.The increase of the total Raman intensity points to a successful field enhancement by silver spasers. In far-field spectra, the brighter spots in the microscope image(generated from Raman intensity of the marker band)simply correspond to the region characterized by a higher number of molecules (bulk-sensitive). As evident from Fig. 3B, this is not the case in surface-enhanced spectra, for which the brightest spots are located at particles edges, while central regions display extremely weak signal enhancement. This phenomenon can be explained by the fact that the incident laser light(532 nm)is linearly polarized and focused(along the z direction)on the sample by a 100×objective with a numeric aperture of 0.9 and that the local enhancement of the electromagnetic field is provided by the LSPR at the silver nano grain surfaces. In the used configuration, the main component of the incident light electric field vector oscillates in the plane parallel to the sample substrate (i.e.,parallel to the xy-plane) although the 0.9 NA objective creates additional electric field vector components with angles up to 64°.However,the main area of the enhanced field created by the LSPR is aligned parallel to the xy-plane (Fig. 4). In this geometry, silver particles lying on top of a flat crystal will only barely(or even not)contribute to the measured Raman intensity enhancement because nearly no (or no) Raman scattering molecules are located in the enhanced field area (Fig. 4A). Reversely, silver spasers located at vertical surfaces(i.e.,sharp edges)lead to a strong Raman intensity enhancement since a relatively high number of Raman scattering molecules are located within the provided enhanced electric field(Fig. 4B).
Both furosemide and PVP SERS spectra of silver-coated samples feature significantly higher Raman intensities of the selected marker bands especially for particles edges. Although an accurate calculation of the enhancement factor is not possible because of the high variability of the number of molecules localized in the enhanced field areas;Raman intensities in SERS spectra exceed the intensities of far-field spectra by factor between 80 and 200. The real field enhancement factor is suposed to be much higher since in SERS the signal comes from only a few molecules in the proximity of silver spasers, while in far-field spectra all molecules contained in microscopic grains contribute to the scattering intensity.
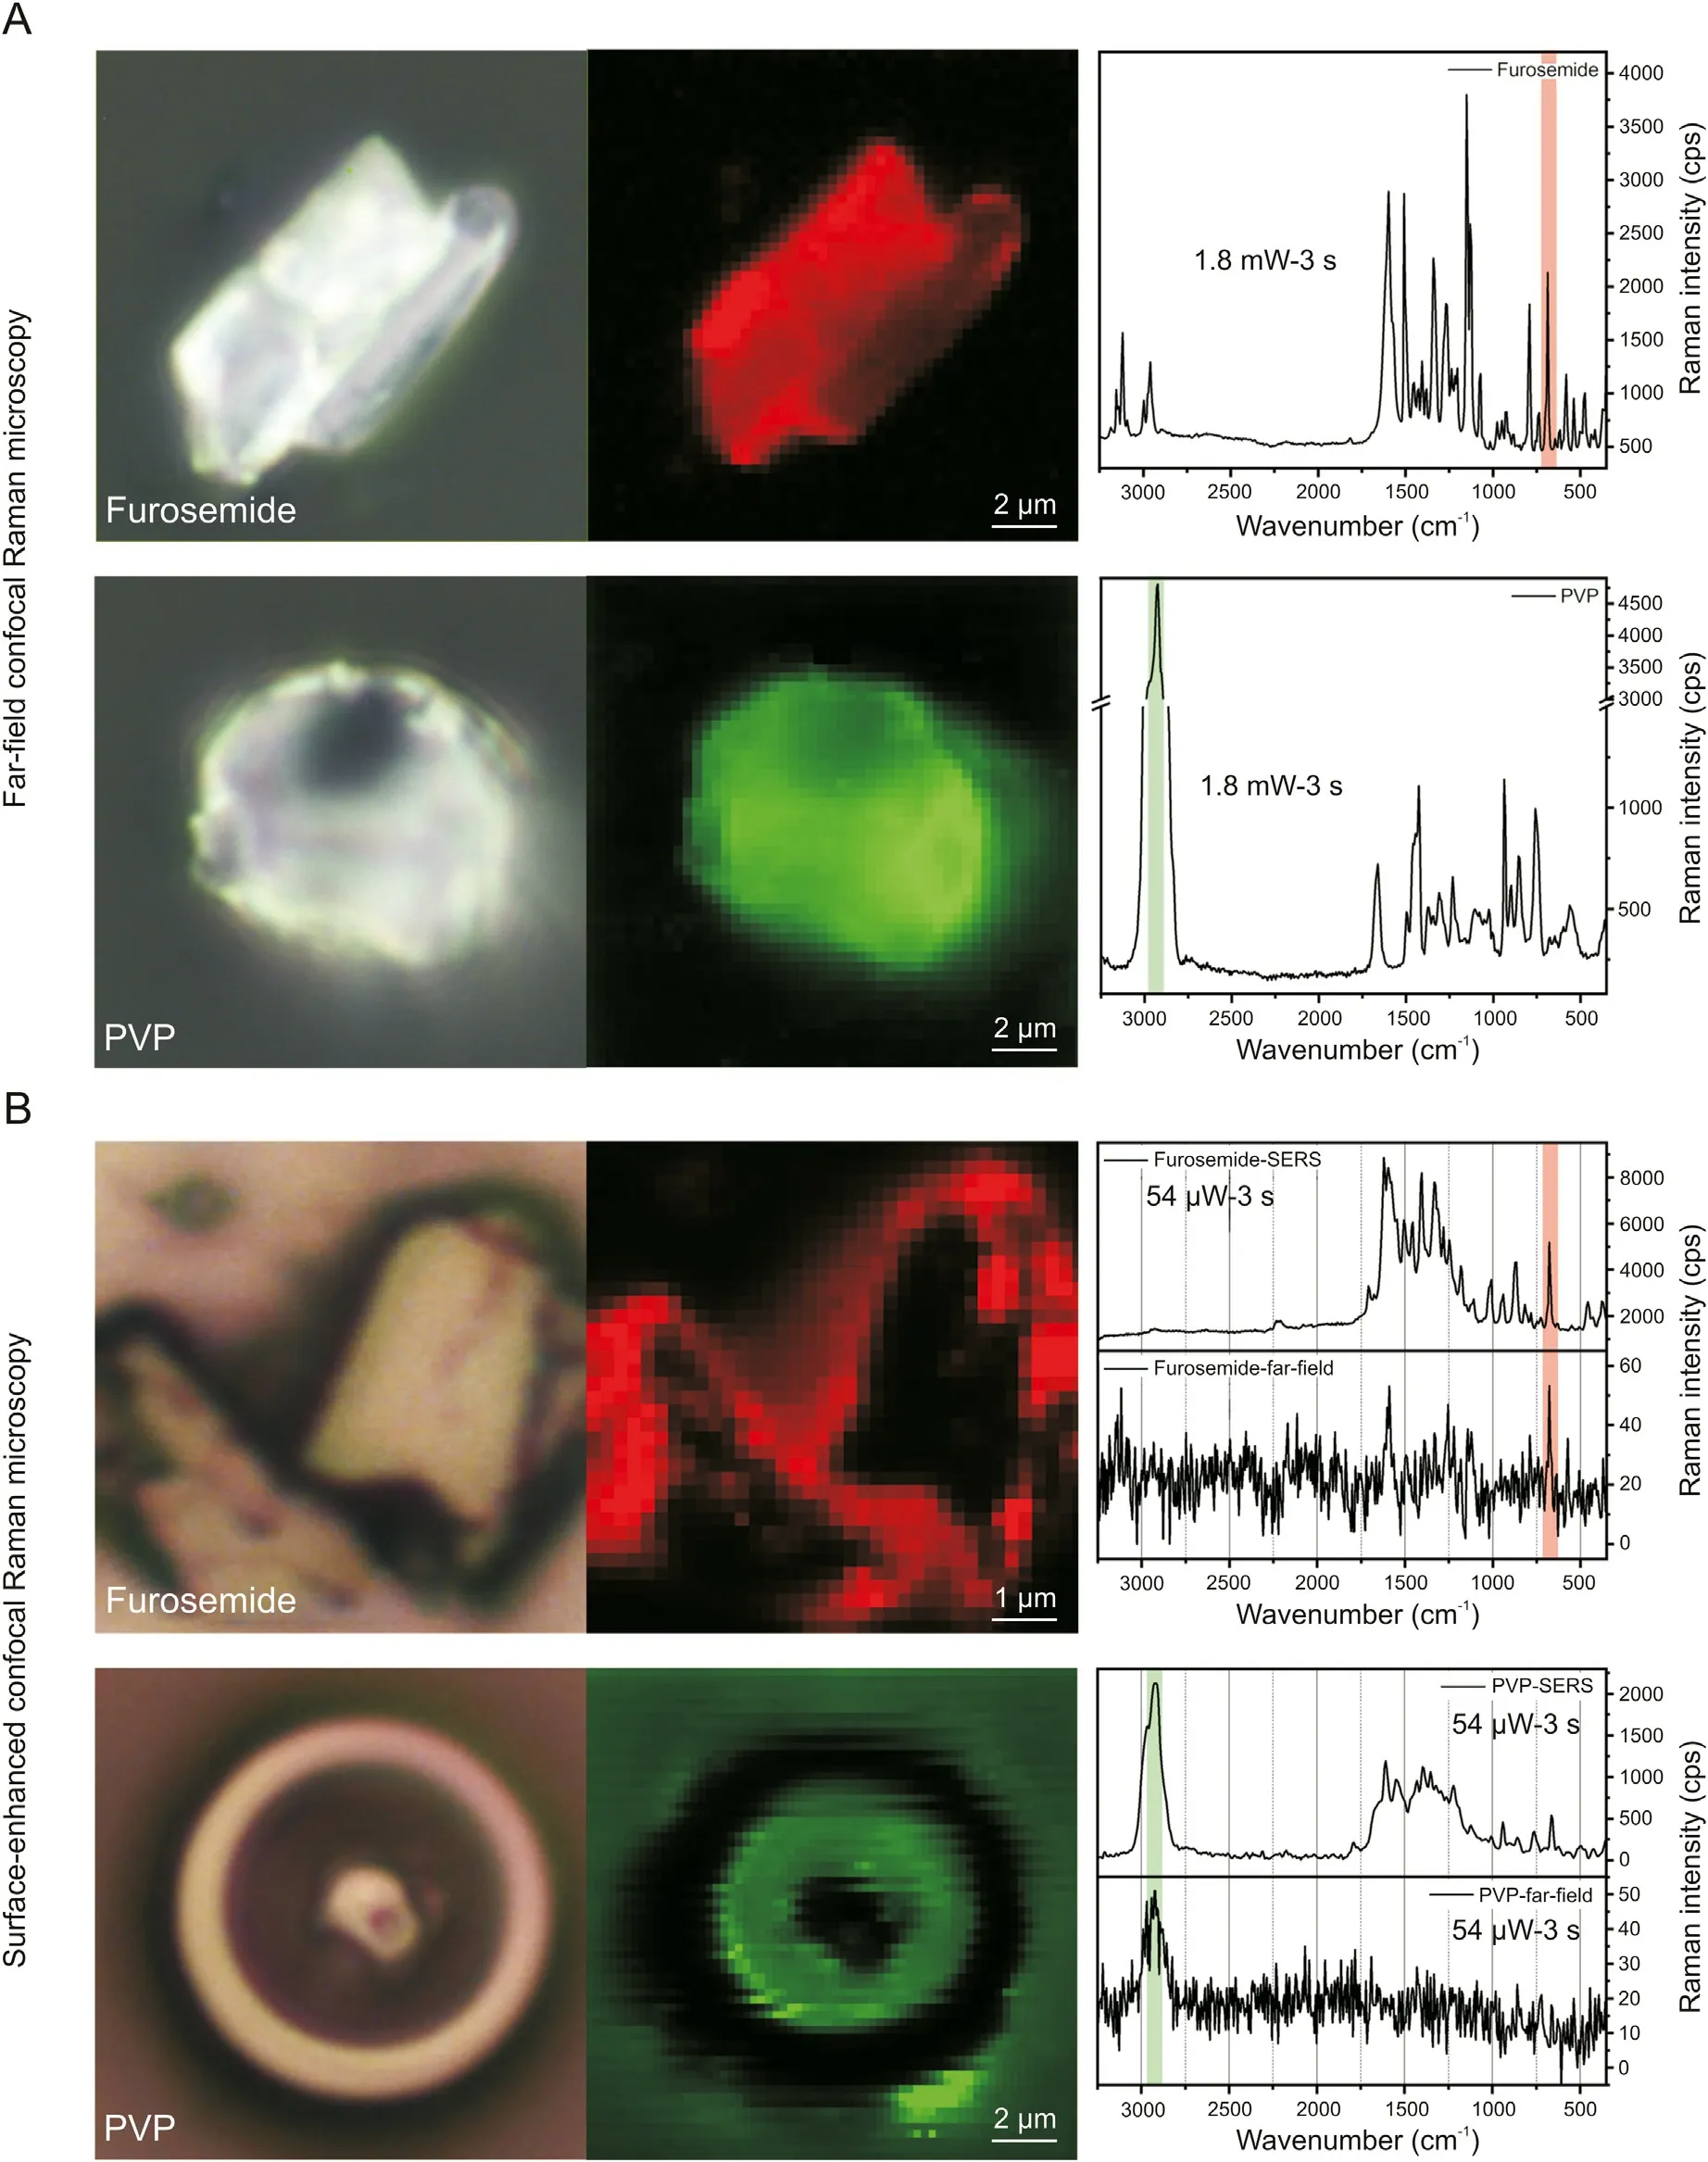
Fig. 3. (A) Optical microscopy images and the corresponding far-field Raman maps and spectra for pure furosemide and PVP. The in-plane ring bending vibration localized at 686 cm-1 (red)is chosen as marker band for furosemide and the CH2 asymmetric stretching vibrations of PVP at 2924 cm-1(green) is selected for PVP identification. (B)SECoRM maps and SERS spectra of silver coated furosemide and PVP showing the presence of the chosen marker bands.
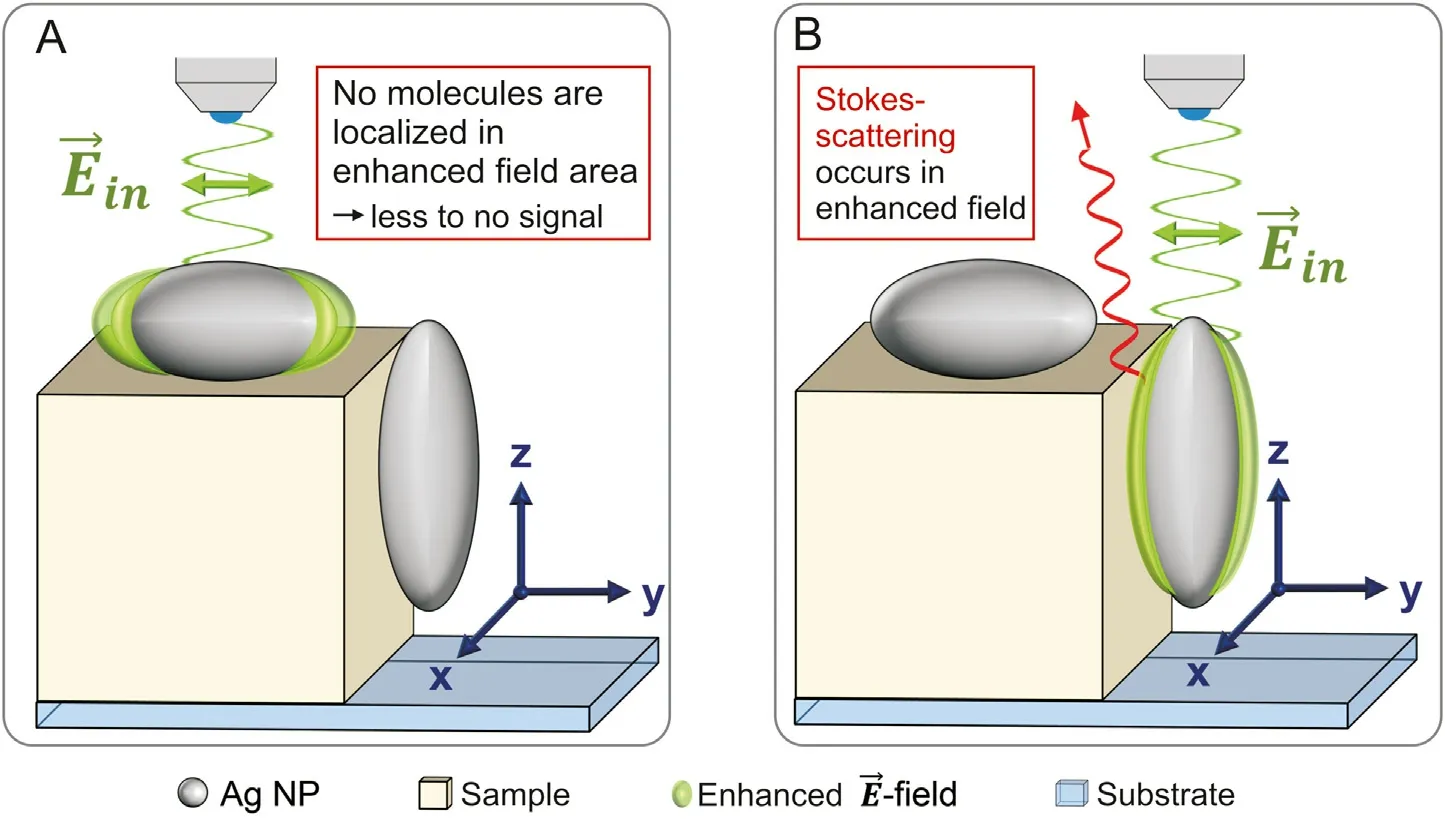
Fig.4. Schematic geometrical illustration of the coupling between the incident radiation field(Ein)with localized surface plasmons generating a strong electric field mostly parallel to Ein at the silver nanoparticle surface. Please note that the silver nanoparticles are solely presented as ellipsoid nanoparticles within this scheme. Due to the sputtering process silver spasers will adopt various shapes in reality. (A) The illuminated Ag NP lies on a flat surface thus no (or nearly no) molecules are localized in the enhanced field area.Consequently,no (or nearly no)photons are Raman scattered and contribute the SERS spectrum. (B)The illuminated Ag NP is attached on a perpendicular surface (towards E→in ).Many molecules are localized within the enhanced field leading to frequent Raman scattering.
Since the silver spasers are in direct contact with the sample surfaces, chemical enhancements may also contribute to the total enhancement. This may be evident in the CH2asymmetric stretching vibration of PVP (marker band) occurring at the Stokes shift of 2924 cm-1, equivalent to 630 nm, which seems to be additionally enhanced by a chemical interaction with the silver surfaces.Light of this wavelength does not(or only barely)induce a resonant oscillation of the localized surface plasmons of silver nanoparticles with a mean diameter of few tens of nm [41].Therefore, Stokes shifted light emitted in this range is expected to be less enhanced as compared to resonant wavelengths(E2instead of E4enhancement) [26]. Despite this, the intensity ratio between the PVP marker band intensity and the next most intense band only decreases from about 5:1(far-field spectra)to ~2:1(SERS spectra).Thus, it is supposed that a charge transfer between the silver surface and the absorbed PVP molecules may take place, resulting in an amplification of the molecule polarizability. Interestingly, both furosemide and PVP SERS spectra clearly display two very broad background signals(with point-to-point variable intensity)roughly centered at 1600 cm-1and 1350 cm-1.Mao et al.[40]found similar signals in Raman spectra of PVP functionalized with onedimensional silver nanowires and ascribed the signal at 1605 cm-1to the shifted C=O stretching vibration (from 1665 to 1605 cm-1) due to the chemical interaction of PVP carbonyl functional group with the silver surfaces.In our case the broad features at 1600 cm-1, and 1350 cm-1appearing in both silver-coated furosemide and PVP SERS spectra, are rather ascribed to the D and G bands of the sp2-hybridized carbon atoms from amorphous carbon species formed at the surface of the silver spasers during the exposure to the incident laser beam.More in details,the collective oscillation of the conductive band electrons induces the heating up of silver nanoparticles, leading to the partial graphitization of organic molecules in the proximity of silver particles. In order to exclude that the organic material degradation occurs during the silver sputtering process, pure furosemide and PVP were coated with a 5 nm thick titanium layer. Since the broad bands at 1600 cm-1and 1350 cm-1are absent in Raman spectra of titaniumcoated furosemide and PVP, the formation of graphitic carbons is very unlikely to occur already during the sputtering procedure(Fig. 5). Raman spectra from titanium-coated furosemide and PVP samples differ from far-field spectra only by the presence of fluorescence signals arising from the titanium nano species formed at the organic particle surfaces (Fig. 5). Anyway, since the origin of these broad peaks is related to amorphous carbon contamination,these bands can be removed by background subtraction for SERS spectra analysis.

Fig.5. (A)SERS spectra of PVP before and after background correction.Intense D and G bands from sp2-hybridized amorphous carbon species are seen at between 1100 cm-1 and 1700 cm-1. These signals are ascribed to carbon formed on silver nano grains during laser irradiation. A perfectly similar feature is observed for silver-coated furosemide. (B) Farfield Raman spectrum of furosemide coated with 5 nm titanium. No signals from amorphous carbon species are found. The fluorescence band (between 3300 and 2000 cm-1) is ascribed to nanoscale titanium particles.
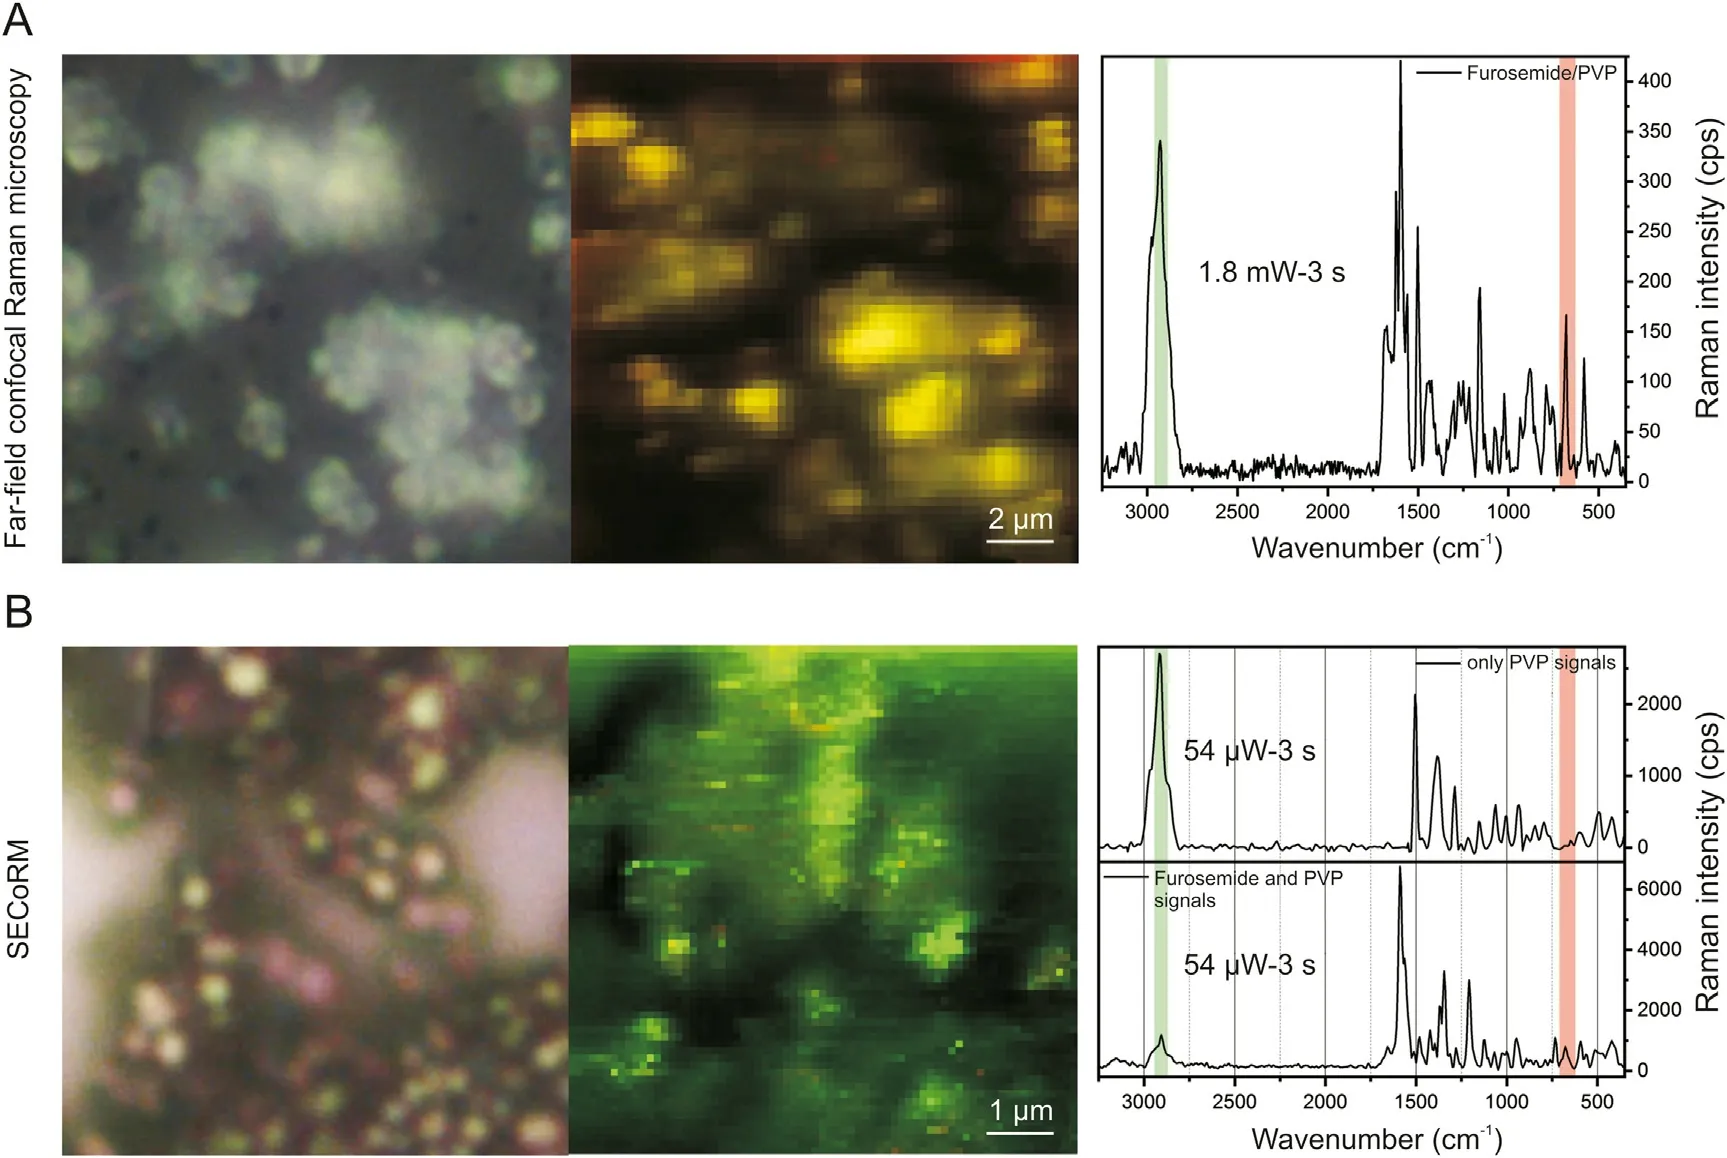
Fig.6. (A)Optical microscope image(left)and far-field confocal Raman microscopy map (right) of furosemide/PVP sub-micron composite particles. The yellow pixels indicate the presence of both furosemide and PVP marker bands in each single point Raman spectrum as shown in the background-corrected spectrum.(B)Optical microscope image(left)and SECoRM map (right) of furosemide/PVP sub-micron composite particles. The green colored pixels demonstrate that PVP is dominantly found at the furosemide/PVP particle surfaces. Background-corrected SERS spectra showing only PVP markers (majority) and PVP-furosemide markers are presented.
Since small amounts of surface molecules contribute to most of the signal in SERS, band position shifts and the modification of relative intensities may occur due to electrostatic and chemical interactions with the metal nanoparticle surface inducing slight changes in molecular orientations and arrangement [42-45].Despite this, furosemide and PVP marker bands identified in farfield spectra can still be applied in SERS to identify each compound in furosemide/PVP composite particles.
3.3. Far-field Raman microscopy and SERS investigations of submicron furosemide/PVP particles
The previous results demonstrate that the formation of silver spasers through direct sputtering on the top of furosemide and PVP microstructures allows for performing surface-enhanced Raman spectroscopy and microscopy. This section will apply this method to investigate furosemide/PVP sub-micron composite particles. In the first step, far-field Raman microscopy maps of uncoated furosemide/PVP particles are recorded. As expected, far-field spectra extracted from confocal far-field Raman microscopy images show both marker bands from furosemide and PVP (Fig. 6A). The ratio between the different compounds is visually illustrated in Fig. 6A,showing a typical far-field color map of furosemide/PVP submicron particles. The Raman intensities of both marker bands are depicted superimposed to generate a single map in which the furosemide and the PVP marker bands appears in red and green respectively. If in the Raman spectra both marker bands occur,the corresponding pixel color in the map is displayed in yellow. The dominant yellow color clearly indicates that furosemide and PVP domains do not segregate in microscopic phases but rather form well-intermixed nanoscale domains. Even though far-field Raman maps can prove the formation of furosemide/PVP sub-micron composite particles, they do not provide information about the arrangement of furosemide and PVP molecules within single composite particles. Surprisingly, in SECoRM maps (Fig. 6B), contrary to far-field Raman maps,the majority of pixel clearly display a green color,indicating the dominant PVP marker band intensity in the SERS spectra. The absence of the furosemide marker band within most of the SERS spectra can only be explained by the arrangement of furosemide and PVP molecules within the furosemide/PVP sub-micron particles. More in details, as SERS is highly surface sensitive and is strongly modulated by molecular orientations and chemical interactions between silver and surface molecules,it can be safely concluded that PVP is most dominantly found at the surface of SFE-produced furosemide/PVP composite particles[23,26,46]. Therefore, the combination of far-field Raman microscopy and SECoRM results points toward the formation of a kind of furosemide/PVP core/shell arrangement.
3.4. Building mechanism of furosemide/PVP sub-micron particles
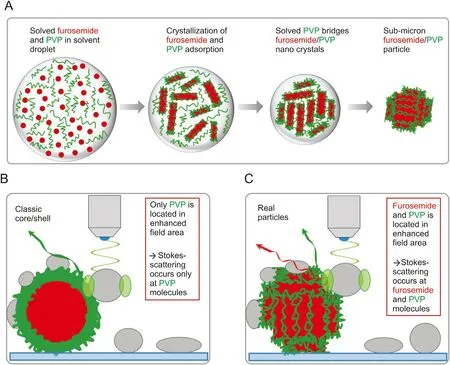
Fig. 7. (A) Proposed building mechanism of furosemide/PVP sub-micron composite particles. (B) Schematic representation of a SERS experiment on an estimated classical furosemide/PVP core/shell particle. In this arrangement no furosemide molecules are located within the enhanced field area. Thus Stokes-scattering occurs only on PVP molecules,resulting in the absence of furosemide vibrational modes within the SERS spectrum. (C) Schematic representation of a SERS experiment on a real furosemide/PVP sub-micron composite particle. Since the PVP shell appears much smaller in the real case, surface-near furosemide molecules can be located in the enhanced field area. Consequently, furosemide vibrational modes appear in some SERS spectra.
Though most SERS spectra contain the PVP marker band only,some SERS spectra and SECoRM maps present both furosemide and PVP marker bands. The occurrence of furosemide signals within these SERS spectra cannot be explained by the formation of classical core/shell sub-micron particles with a completely closed PVP encapsulation of furosemide spherical core. An estimation of the structure of a typical furosemide/PVP particle with a diameter of 380 nm,based on the specific densities of furosemide and PVP and their mass fractions within the precursor solution (0.75 and 0.25,respectively),would be consistent with a furosemide core diameter of 336 nm and a PVP shell thickness of 22 nm. This core-shell structure is not compatible with SECoRM maps because the rapid decay of the electric field provided by the LSPR will not allow recording any signal from the core furosemide molecules (Fig. 7).Based on the rough furosemide/PVP particle surface observed in SEM images and coherence lengths of furosemide crystals derived from XRPD (<50 nm), it is concluded that furosemide must be sensibly smaller than what is predicted from an ideal core-shell structure. In the SFE process, the mixed solution is sprayed through a preheated hollow cone nozzle into the constantlypumped vacuum reactor. The micron sized aerosol droplets undergo a fast solvent evaporation when travelling from the injection nozzle to the particles filter.When the saturation point is reached,the less soluble compound will be the first to crystallize.Since PVP has a 100 × higher solubility in the used ethanol/DCM solvent mixture (about 1000 g/L) respect to furosemide (10 g/L), furosemide is very likely to crystallize before PVP transforming into its amorphous solid phase (Fig. 7A). The primary furosemide nanocrystals formed within the aerosol droplets are thought to have the dimensions calculated from the PXRD coherence lengths with a strongly anisotropic morphology. During further droplet evaporation, PVP molecules start to adsorb onto furosemide crystal surfaces, forming a PVP shell around these nano-crystals and thus preventing their agglomeration or fusion (Fig. 7A). Because of the high PVP mass fraction (0.25), the PVP is much too abundant to stabilize the furosemide suspensions in the droplets, thus leading to a flocculation of PVP-coated furosemide nanodomains. This flocculation is induced by solved PVP molecules forming bridges between single furosemide/PVP core/shell nanoparticles leading to the aggregation of primary particles. Finally, further aggregation results in the formation of spherical furosemide/PVP sub-micron particles which are seen in SEM images. Moreover, the rough surface morphology of these particles can be directly assigned to the formation of PVP coated anisotropic furosemide nano-crystals.The proposed building mechanism can explain the presence of the furosemide marker band as shown in SECoRM maps because the PVP shell (few nm) is considerably thinner than what would be expected from mass ration in a model spherical core-shell structure(22 nm). Consequently, furosemide molecules are located within the field-enhanced volume and contribute to the SERS spectra(Fig. 7C).
In order to double check the interpretation of far-field and nearfield Raman results, XPS was additionally performed onto furosemide/PVP sub-micron composite particles. From the surface composition (atomic percentage of C, N, O S and Cl species) and from the analysis of high-resolution C1s spectra of pure furosemide and furosemide/PVP particles(Fig.8), it is concluded that while in the precursor solution the furosemide/PVP ratio is 53:47, the surface ratio derived by XPS analysis is found to be about 40:60. This confirms the PVP tendency to coat Furosemide by forming an ultrathin layer, reasonably less than 3 nm thick, on furosemide in agreement with far-and near-field Raman results.More details on XPS analysis can be found in the Supplementary data.
4. Conclusion
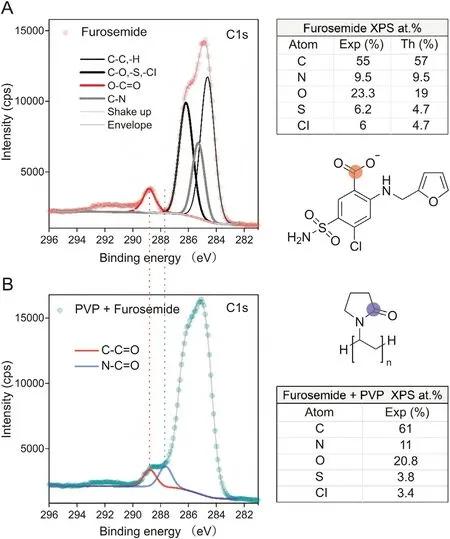
Fig.8. Results from XPS analysis on(A)furosemide and(B)furosemide/PVP composite.The peak fitting of the C1s spectra allows comparing the characteristic functional groups of furosemide (R-COOH) and PVP (R-CNOH). The normalized fraction of PVP(0.55) and furosemide (0.45) can be derived. Tables report the atomic percentage compositions derived from the quantification on high-resolution spectra(Exp)and the values calculated from the chemical formula of furosemide (Th). The atomic percentage can be used to derive PVP (0.60) and furosemide (0.40) molecular fractions at the surface.
The sub-micron composite particles formed by furosemide and PVP and produced by SFE were investigated. Particles were characterized by SEM, XRPD, XPS and far-field and near-field Raman spectroscopy and microscopy. First, SEM allowed demonstrating a sub-micron particle structure, and XRPD revealed a nanoscale furosemide domains. Finally, the comparison between far- and near-field Raman spectroscopy and microscopy provided clear insights into the arrangement of furosemide and PVP molecules within composite particles. Overall, spherical furosemide/PVP composite sub-micron particles are demonstrated to be formed by nanoscale PVP-coated furosemide crystals which aggregate to form the resulting superstructure.More interesting,we could show that silver coating of organic sub-micron composite particles leads to the formation of effective silver spasers capable of strongly enhancing Raman signals intensity from the particles surface. The formation of these spasers enables SERS investigations and thus the characterization of the surface chemical composition silver-coated particles. In particular, the combination of confocal Raman microscopy is an effective method to obtain data from a statistically relevant number of particles in a single map in a short time span.The main challenges associated with this methodology on organic nanostructures come from assessing the eventual degradation of molecules in direct contact with laser-irradiated silver spasers,possibly leading to the formation of amorphous carbon. The sp2hybridized carbon amount within these amorphous carbon species results in the appearance of strong broad of D and G bands within SERS spectra. Though the bands can be removed by background subtraction, they may mask weaker vibrational modes within the spectrum. This problem might be solved by protecting the sample surface with a few nm of a poor thermal conductive insulation layer before silver coating. We believe that many composites could be tested by this combination of far-and near-field Raman approaches as a standard method for chemical surface characterizations and molecular arrangement investigations of sub-micron organic composite particles.
Declaration of competing interest
The authors declare that there are no conflicts of interest.
Acknowledgments
The authors thank their colleague C′edric Martin(Spinofrin SAS,Boulogne-Billancourt, France) for recording the presented SEM image.The Synthesis,Irradiation,and Analysis of Materials(SIAM),technological platform of University of Namur is acknowledged for XPS measurements.The authors also thank the Direction G′en′erale de l’Armement (DGA, France) and the Bundesamt für Ausrüstung,Informationstechnik und Nutzung der Bundeswehr (BAAINBw,Germany). ISL is a joint initiative of the Ministˋere Arm′ees (France)and the Bundesministerium der Verteidigung (Germany) and is actively supporting the NS3E joint laboratory including the Centre National de la Recherche Scientifique(CNRS)and the University of Strasbourg (UNISTRA).
Appendix A. Supplementary data
Supplementary data to this article can be found online at https://doi.org/10.1016/j.jpha.2020.12.002.
杂志排行
Journal of Pharmaceutical Analysis的其它文章
- A simplified LC-MS/MS method for the quantification of the cardiovascular disease biomarker trimethylamine-N-oxide and its precursors
- UHPLC-MS/MS analysis of cAMP and cGMP in rat plasma as potential biomarkers of Yin-Yang disharmony in traditional Chinese medicine
- Liquid chromatography-mass spectrometry method for the quantification of an anti-sclerostin monoclonal antibody in cynomolgus monkey serum
- Plasma-metabolite-based machine learning is a promising diagnostic approach for esophageal squamous cell carcinoma investigation
- Reducing SARS-CoV-2 pathological protein activity with small molecules
- Development of the general chapters of the Chinese Pharmacopoeia 2020 edition: A review
