Diagnosis and Numerical Modeling of an Explosive Cyclone over the Northwestern Pacific
2021-09-01SUNBaitangLIPengyuanZHANGShuqinGUOJingtianandFUGang
SUN Baitang, LI Pengyuan, ZHANG Shuqin, GUO Jingtian, and FU Gang
1) Laixi Meteorological Bureau, Qingdao 266622, China
2) College of Oceanic and Atmospheric Sciences, Ocean University of China, Qingdao 266100, China
3) College of Ocean and Meteorology, Guangdong Ocean University, Zhanjiang 524008, China
4) North Marine Forecasting Center, Ministry of Natural Resources, Qingdao 266100, China
Abstract An explosive cyclone that took place over the Northwestern Pacific from 12 UTC 18 to 18 UTC 21 November 2007 was investigated. The synoptic situations and structure of this cyclone were documented by using the 1°×1° final analysis data of the National Center for Environmental Prediction. This cyclone developed explosively around 18 UTC 19 and reached its maximum deepening rate (MDR, 1.3 Bergeron) around 06 UTC 20 November 2007. At its MDR moment, the surface cyclone center was located in the downstream of the upper-level trough and northern entrance zone of the upper-level jet. The diagnosis using Zwack-Okossi equation suggested that cyclonic-vorticity advection and warm air advection acted to deepen this cyclone, while adiabatic cooling suppressed its development. In an investigation of this cyclone development, numerical sensitivity results obtained by using the Weather and Research Forecasting model showed that the latent heat release in the lower level had less contribution, whereas the surface sensible and latent fluxes played important roles. With a warmer ocean surface, the cyclone tended to intensify. Two topography tests were designed to examine the mountain influences on the development of this cyclone: removing a mountain and doubling the height of a mountain. Results show that the Changbai Mountains suppressed the development of the cyclone by preventing the southern moisture air from invading the inland. Without the moisture air, no latent heat release occurs when this cyclone passes over the Changbai Mountains.
Key words explosive cyclone; Changbai Mountains; Zwack-Okossi equation; WRF model
1 Introduction
The study of extratropical cyclones has received considerable attention ever since the work of the ‘Bergen School’ in the 1910s and 1920s (e.g., Bjerknes, 1919; Bjerknes and Solberg, 1922). In recent decades, researchers have referred to these cyclones that develop explosively as ‘bombs’ (Sanders and Gyakum, 1980; Sanders, 1986;Lupoet al., 1992; Bosartet al., 1996; Lim and Simmonds,2002; Yoshida and Asuma, 2004; Finket al., 2012; Pang and Fu, 2017; Zhanget al., 2017). Sanders and Gyakum(1980) defined explosive cyclogenesis as a condition in which a cyclone’s central sea level pressure falls at a rate of 1 hPa h-1or greater. Explosive cyclones frequently occur over the Northwestern Pacific during the cold season(Qi 1993; Zhanget al., 2017; Fuet al., 2018). Studying explosive cyclones over the Northwest Pacific Ocean is of great importance due to the great social and economic losses caused by these cyclones (Slateret al., 2017).
Many studies on explosive cyclones over the Northwest Pacific Ocean focus on the development mechanism (Li and Ding, 1989; Zhaoet al., 1994; Huanget al., 1999;Xieet al., 2009; Pang and Fu, 2017). Li and Ding (1989)found that large-scale latent heat release is crucial to the explosive development of a cyclone over the northwest Pacific Ocean. Pang and Fu (2017) indicated that the presence of a deep tower of high potential vorticity (PV) above the surface cyclone when these cyclones underwent explosive cyclogenesis. They also mentioned that the high PV in the lower troposphere was associated with the latent heat release. These findings are similar to those of previous studies about explosive cyclones over the north Atlantic Ocean (Davis and Emanuel, 1991; Čampa and Wernli, 2012; Binderet al., 2016). From a PV point of view, three distinct positive PV anomalies mainly determine the evolution of an extratropical cyclone: an upperlevel stratospheric intrusion, a low- tropospheric diabatically produced PV anomaly, and a warm surface anomaly(Čampa and Wernli, 2012; Binderet al., 2016). In the mature stage of a cyclone, the three anomalies can become vertically aligned to form a so-called PV tower,which represents a troposphere-spanning column of air with anomalously high PV values. Positive PV anomalies in the lower troposphere play a major role in the evolution of the cyclone. However, which processes contribute to the generation of the positive PV anomalies in the lower troposphere is unknown due to different cyclone cases. To investigate the role of different processes in the generation of PV in this study, we employ the Weather and Research Forecasting version 4 (WRF v4.0) model to conduct sensitivity tests on latent heat release and surface fluxes.
Another issue related to explosive cyclone development is topographic effects and surface forcing, especially vis-à-vis a cyclone passing over a mountain range and transitioning from land to oceans. Pepleret al.(2017)suggested that topography affects the spatial distribution of cyclones over the east coast of Australia. However,other factors, such as how the mountain affects PV generation and rainfall distribution, that determine the evolution of the explosive cyclone are not well studied. Inspired by Pepleret al.(2017) and combined with the fact that the Changbai Mountains are a major mountain range located in the north of the Korean Peninsula that usually blocks the cold air from Siberia during the winter and forms the Japan-Sea Polar-Airmass Convergence Zone in its leeside, thereby providing favorable conditions for the generation of cyclones, we want to investigate the role of the Changbai Mountains in the evolution of the explosive cyclone. According to Yoshida and Asuma (2004), a few explosive cyclones pass over the Changbai Mountains,which is why this kind of explosive cyclone is worthy of study. The cyclone in the present study is generated on land and then does not explosively develop until it moves over the sea. Therefore, the influence of the Changbai Mountains should be studied. The significant topographic uplift may hinder the development of explosive cyclones.The role of topography in the development of the cyclone should be studied.
The following part of the paper is organized as follows:The data and methodology are introduced in Section 2. A synoptic overview and diagnostic analysis of the Zwack-Okossi (Z-O) equation are introduced in Section 3. The sensitivity test results obtained by the WRF model are shown in Section 4. Finally, the conclusion and discussion are given in Section 5.
2 Model Configuration, Data, and Methodology
2.1 Model Configuration
This study uses the WRF model, which is a fully compressible Eulerian nonhydrostatic model with a terrainfollowing hydrostatic pressure vertical coordinate. Specifically, version 4.0 of the WRF’s Advanced Research core (Skamarocket al., 2008), released in June 2018, was used. We conducted a 78 h simulation initialized at 00 UTC 18 November 2007. A domain with a grid spacing of 30 km was employed and with mesh sizes of 170×100.The Changbai Mountains range from 38°46´ to 47°30´N and 121°08´ to 134°00´E, with a length of more than 1300 km and a width of 400 km from east to west. The grids in the WRF model can reasonably reproduce the feature of the topography. Vertically, the domain has 35 levels with the top layer at 50 hPa. The YSU scheme (Honget al.,2006) was employed for the atmospheric boundary layer process simulation. The Kain-Fritsch scheme (Kain and Fritsch, 1990) was used for cumulus parameterization. The rapid radiative transfer model (RRTM; Mlaweret al., 1997)scheme for longwave radiation and the Dudhia scheme(Dudhia, 1989) for shortwave radiation were used. The Lin scheme (Linet al., 1983) was selected for microphysical parameterization.
2.2 Data
Six-hourly National Centers for Environmental Prediction Final (FNL) analysis data with a resolution of 1°×1°were used for the initial and lateral boundary conditions of the simulation in this study. ETOPO1 bedrock data were provided by the National Geophysical Data Center with a horizontal resolution of 1°×1°. Multifunction Transport Satellite infrared satellite image was provided by the Cooperative Institute for Meteorological Satellite Studies.
2.3 Methodology
The Z-O equation, which was originally developed by Zwack and Okossi (1986), explicitly links the near- surface variation with forcing above near-surface level. The Z-O equation was further developed by Lupoet al.(1992)in a generalized form. In the present study, we adopted the Z-O equation developed by Lupoet al.(1992) as follows:

whereptis the upper-level pressure,plis the pressure at the reference level,ζgis the geostrophic relative vorticity at a reference level,Vis the horizontal wind vector,ζais the absolute vorticity,Ris the dry-air gas constant,fis the Coriolis parameter,Tis the air temperature,Cpis the specific heat at constant pressure,Sis the static stability,Fis the frictional force,ωis the vertical velocity at pressure coordinate,ζagis the ageostrophic vorticity, andQ˙ is the diabatic heating/cooling rate per unit mass.Q˙ has the following form cited from Crandall (2016):

whereγmandγdare the moist- and dry-adiabatic lapse rates, respectively;θeis the equivalent potential temperature; and the rest of the variables have their usual meanings. As reported by Lupoet al.(1992), terms A, G, and H represent divergence (convergence) that is produced as the atmosphere readjusts to a spatially varying, geostrophically balanced state in response to locally increased(decreased) vorticity values. Terms B, C, and D represent heating (cooling) processes that force horizontally nonuniform upward (downward) displacements of the height fields. Term F represents a correction term that accounts for the possibility that the imbalanced atmosphere may attempt to reach a balanced state other than geostrophic.Term E represents the divergence (convergence) caused by frictional effects and is most important in the planetary boundary layer. Finally, term I reflects the vertically integrated divergence left in place as the atmosphere adjusts to its current state. According to the calculation of all terms, the first five terms (A-E) are one order of magnitude larger than the last four terms (F-I). In this study, we use only terms A-E to diagnose the development of the cyclone.
3 Case Overview and Diagnostic Analyses
3.1 Case Overview
On the basis of the track (Fig.1a), the cyclone was first found over the Mongolian Plateau at 12 UTC 18 November 2007. Then, the cyclone moved southeastward, and its central sea level pressure gradually dropped (Fig.1b).Between 12 UTC 19 and 18 UTC 19, the cyclone moved through the Changbai Mountain area and finally entered the Japan Sea. Hereafter, the cyclone track turned northeastward and developed explosively. At 00 UTC 20, the deepening rate of the central sea level pressure was larger than 1 Bergeron (Fig.1b). At 06 UTC 20, the cyclone moved to the southern flank of Sakhalin Island and its deepening rate reached its maximum value (1.3 Bergeron).Twelve hours later, the deepening rate was below 1 Bergeron. At 06 UTC 21, the cyclone was positioned over the ocean east of Sakhalin Island and the central sea level pressure reached the minimum value (972.4 hPa). Later, the cyclone was in the dissipating stage.
On the basis of the central sea level pressure drop and the cloud imagery (Fig.2), the evolutionary process of this cyclone event was classified into four stages: gradually deepening stage, explosively developing stage, mature stage, and dissipating stage. During the first stage, between 12 UTC 18 and 18 UTC 19, the cyclone moved through the Changbai Mountain region and the central sea level pressure gradually dropped about 11.3 hPa within 30 h. Figs.2a and 2b describe the cyclone with a horizontal scale of about 1000 km. An obvious spiral cloud shape is present in these two images. In the explosive developing stage (Figs.2c and 2d), between 00 UTC 20 and 12 UTC 20, a comma-shaped cloud system tended to form over the ocean with a frontal cloud south of the comma cloud system. The central sea level pressure dropped about 12.7 hPa in 12 h. In the mature stage, between 18 UTC 20 and 06 UTC 21, the cyclone showed a spiral-shaped cloud with a strong frontal cloud system south of the cyclone center with the central pressure dropping about 6.8 hPa in 12 h (Figs.2d and 2e). After 12 UTC 21, the cyclone was in the dissipating stage and the cloud image showed no spiral-shaped cloud (figure not shown). The central sea level pressure started to increase.
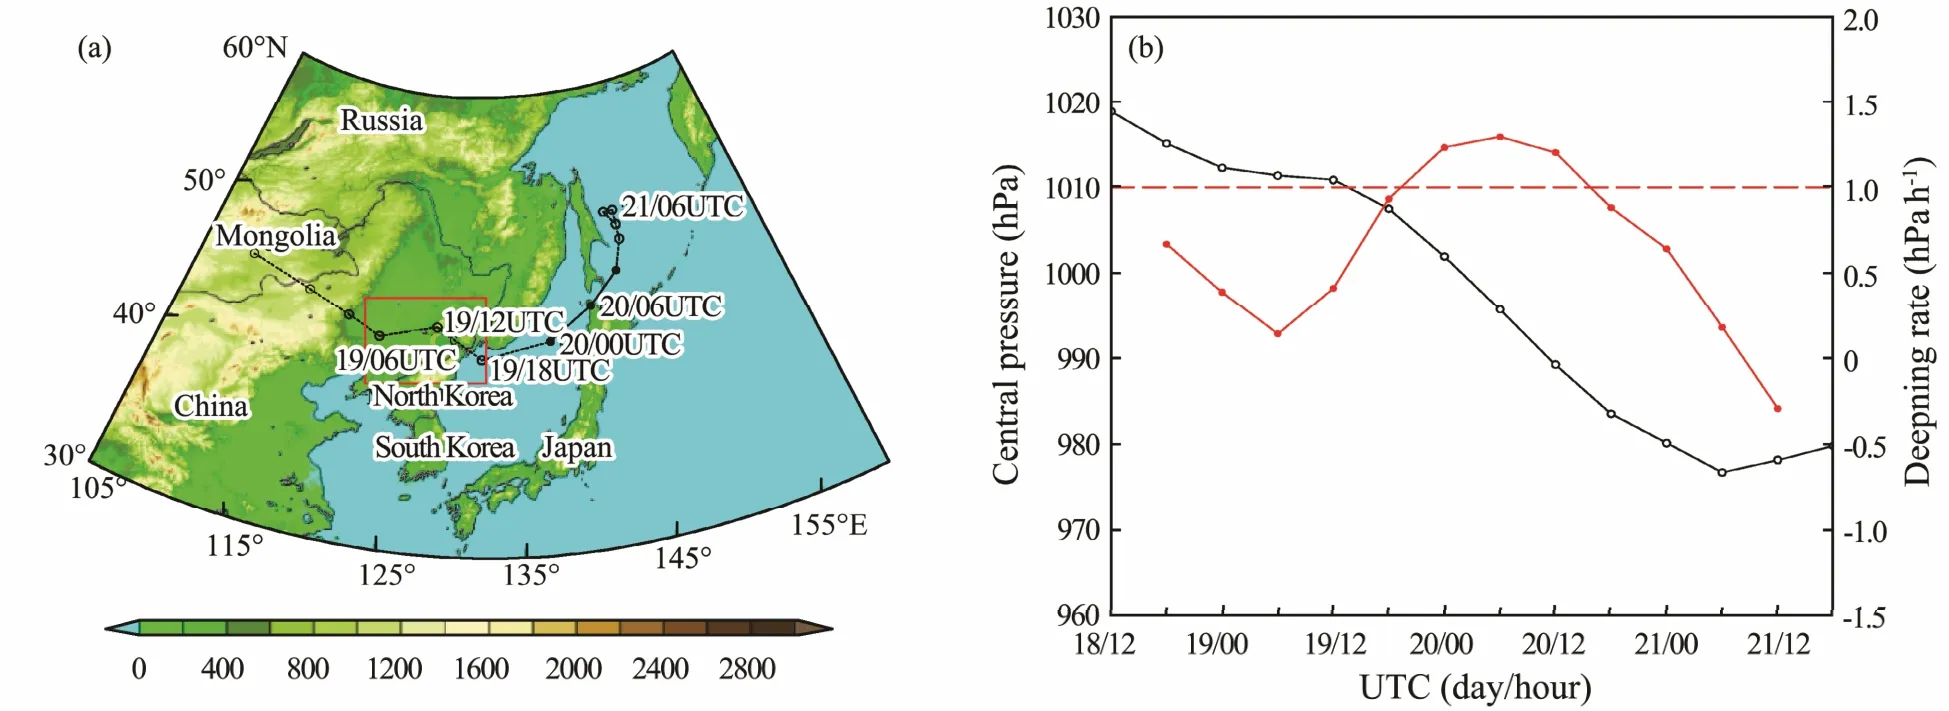
Fig.1 (a) Cyclone track during the period from 12 UTC 18 to 18 UTC 21 November 2007 derived from FNL data. Solid circles with solid lines denote the explosive developing stage. Open circles with dashed lines denote the initial and dissipating stages. The red rectangular area is selected for later orography tests. (b) Time evolution of the central sea level pressure (black solid line, hPa) and its deepening rate (red solid line, hPa h-1).

Fig.2 MTSAT infrared albedo imagery (shaded, K) (a) 12 UTC 19, (b) 18 UTC 19, (c) 06 UTC 20, (d) 12 UTC 20, (e) 18 UTC 20, (f) 00 UTC 21 November 2007. Red dots represent the location of the surface cyclone center. The red trapezoidal box represents the location of the Changbai Mountains.
At the 500 hPa level, a trough and the surface cyclone center is located downstream of the trough, which was favorable for the development of the cyclone due to the positive vorticity advection (Figs.3a-3c). The surface cyclone center was located at the left side of the jet entrance region from 06 UTC 19 to 06 UTC 20 November (Figs.3a-3c). Around 06 UTC 21 November (Fig.3d), the surface cyclone center was located at the right side of the jet exit region. Many researchers suggested that the highfrequency centers of explosive cyclones predominantly appear at the poleward side of the jet axis (Sanders and Gyakum, 1980; Yoshida and Asuma, 2004; Zhanget al.,2017). The finding of the present study is consistent with that of previous studies. At the 850 hPa level, the southerly jet located south of the cyclone center transported the warm moist air to the cyclone center, which was favorable for the development of the cyclone (Fig.4c). The cyclone moved northeastward and the southerly jet vanished (Fig.4d). The cyclone gradually dissipated. In addition, when the cyclone passed over the Changbai Mountain area, the warm moist air brought by the southerly lower-level jet was prevented from invading the inland(i.e., the north side of the cyclone) due to the presence of the mountain.
3.2 Analyses of the Z-O Vorticity Budget
At the beginning of explosive cyclogenesis, the surface cyclone center was located west of the total tendency maximum (Fig.5a). By 18 UTC 19 November (Fig.5b), the vorticity tendency maximum was located to the east of the surface cyclone and moved northeastward. In Fig.5c, the total tendency maximum had moved to the northeast of the cyclone. By the final map time, the surface cyclone was located near the negative tendency maximum (Fig.5d). At this time, the cyclone was in the dissipating stage. This finding may have forecast significance in terms of the intensification of a cyclone.
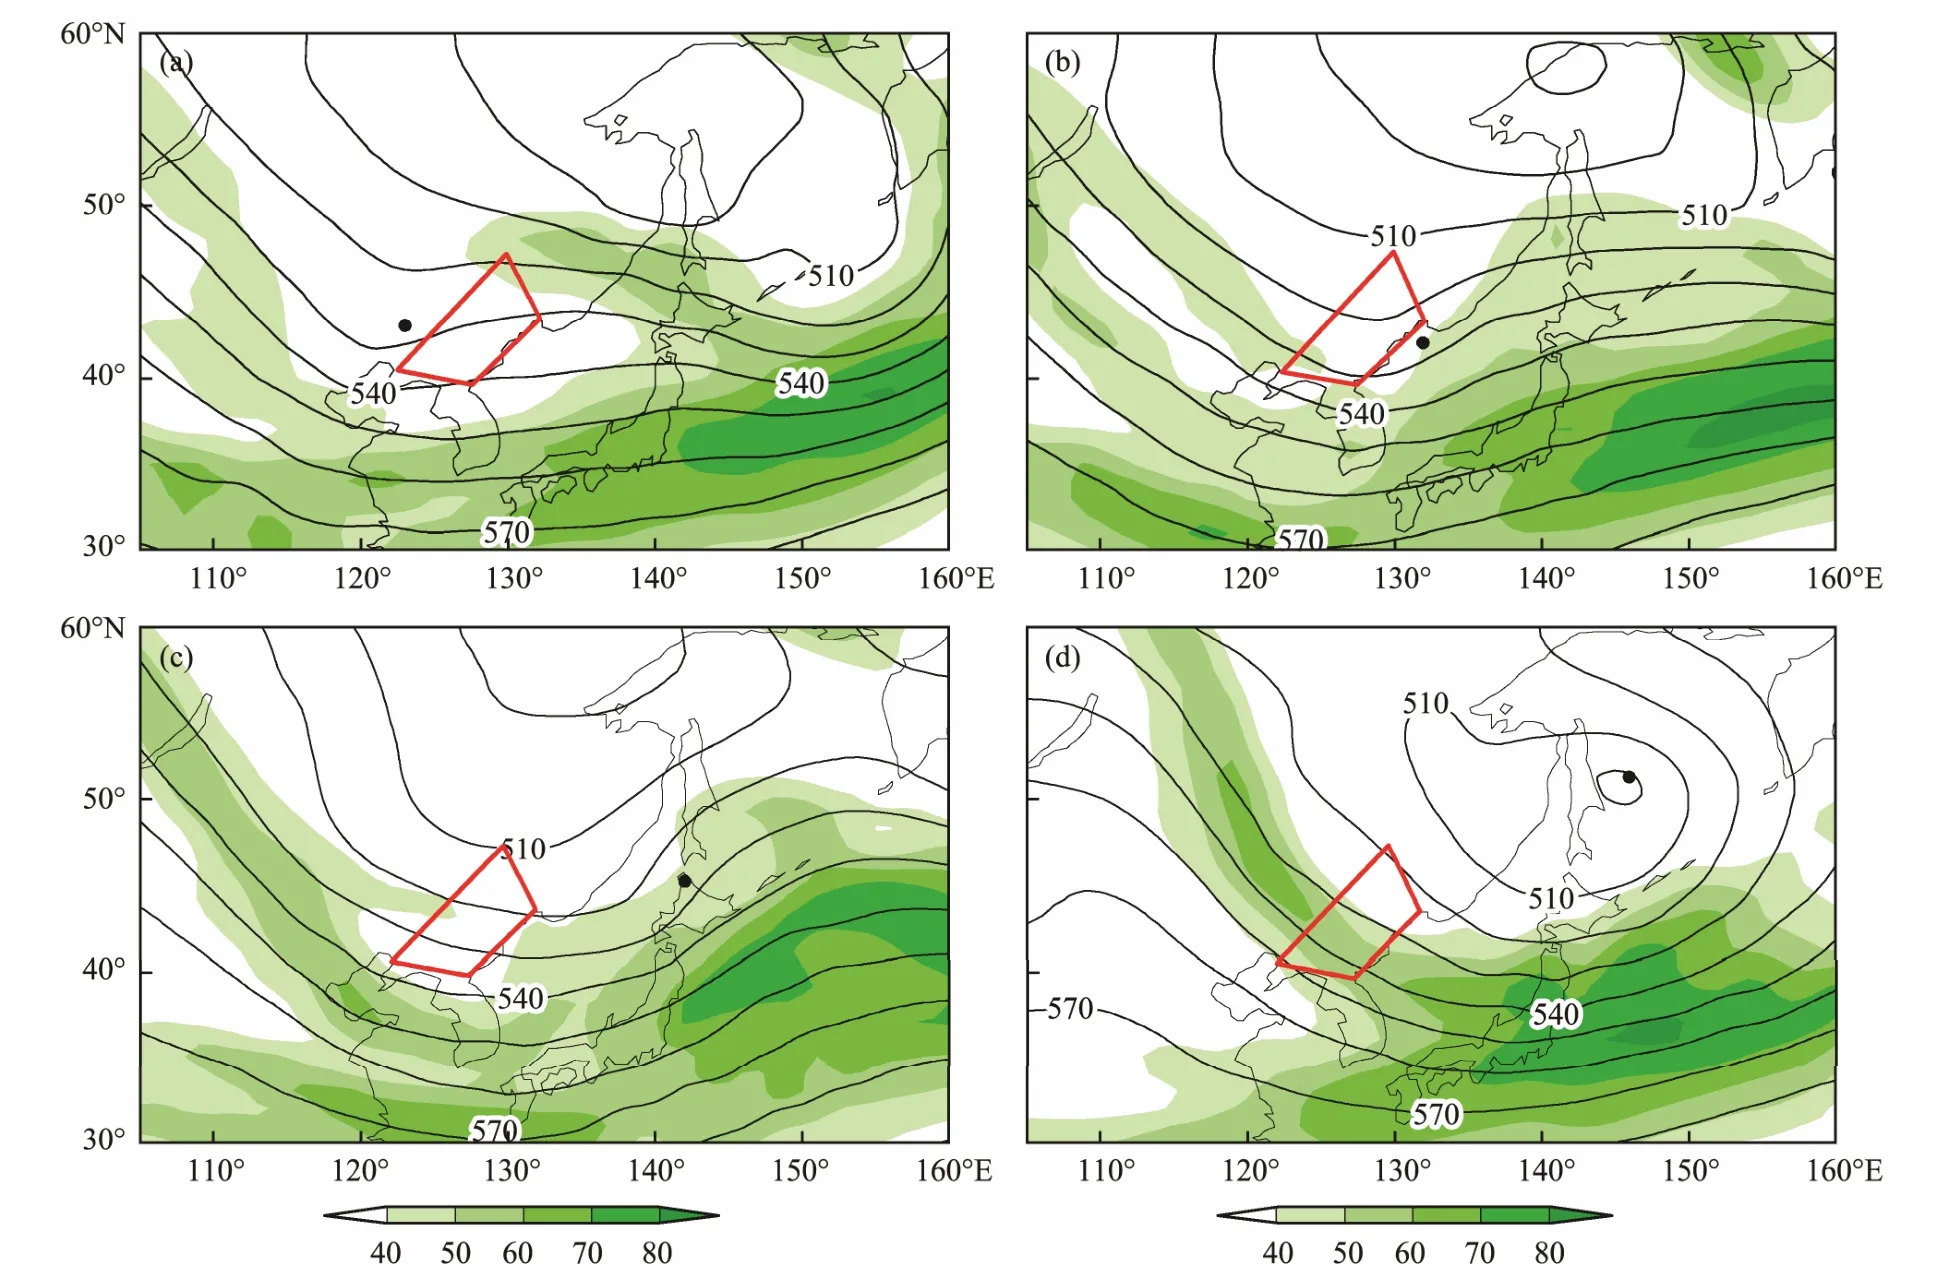
Fig.3 Geopotential height at 500 hPa (solid line) and wind speed at 300 hPa (shaded, m s-1) (a) 06 UTC 19, (b) 18 UTC 19,(c) 06 UTC 20, (d) 06 UTC 21 November 2007. Black dots represent the location of the surface cyclone center. The red trapezoidal box represents the location of the Changbai Mountains.
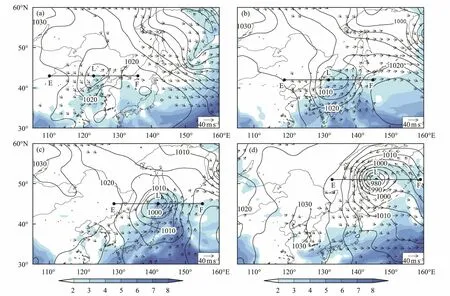
Fig.4 Sea level pressure (solid line, hPa), wind speed at 850 hPa (wind vector, >12 m s-1), and specific humidity at 850 hPa (shaded, g kg-1) (a) 06 UTC 19, (b) 18 UTC 19, (c) 06 UTC 20, (d) 06 UTC 21 November 2007. Line EF is used for later cross section analysis. The letter ‘L’ denotes the location of the surface cyclone center.

Fig.5 Total vorticity tendency term in the Z-O equation (solid line, 10-9 s-2) (a) 06 UTC 19, (b) 18 UTC 19, (c) 06 UTC 20, (d) 06 UTC 21 November 2007. Black dots represent the location of the surface cyclone center.

Fig.6 (a) Vorticity advection, (b) temperature advection, (c) latent heat release, (d) adiabatic cooling, (e) friction, unit:10-9 s-2 at 06 UTC 20 November 2007. Black dots represent the location of the surface cyclone center. The black rectangular area denotes the 10°×10° area for calculating the above five terms’ area mean.
Fig.6 shows the five largest terms - namely, the vorticity advection, temperature advection, adiabatic cooling, the latent heat release, and the friction term - at 06 UTC 20 November 2007 in the cyclone mature stage. The largest contributor to the total vorticity tendency is the temperature advection in Fig.6b with the maximum center to the east of the surface cyclone center. The latent heat release term and vorticity advection term are the second and third largest contributors with the maximum center to the east of the surface cyclone center. The surface cyclone center was located near the maximum center of the adiabatic cooling term, which offset the total vorticity tendency.The frictional term plays a similar role in the evolution of the cyclone as the adiabatic cooling term. Other times showed similar features as in Fig.6.
To further investigate the role of the five terms in the evolution of the cyclone, we calculate the area mean of the five terms. The area was selected as a 10°×10° box centered at the surface cyclone center shown in Fig.6. In Fig.7,an explosive cyclone was initiated primarily by the vorticity advection in the first two time periods (Figs.7a, 7b).Then, temperature advection increased to be comparable to the vorticity advection. In contrast, adiabatic cooling in the ascending air and friction term damped the two primary development terms, while latent heat release exerted a small influence in the cyclone domain. Vorticity advection plays an important role in the development period.

Fig.7 Area mean value of vorticity advection (VADV), temperature advection (TADV), latent heat release (DIAB), adiabatic cooling (ADIA), and friction (FRIC) at (a) 06 UTC 19, (b) 18 UTC 19, (c) 06 UTC 20, (d) 06 UTC 21 November 2007.
4 Numerical Modeling
Three distinct positive PV anomalies occur in an extratropical explosive cyclone: surface, lower-tropospheric,and upper-tropospheric PV anomalies (Čampa and Wernli,2012; Pang and Fu, 2017). During the mature stage of the cyclone, these three positive PV anomalies often became vertically aligned and formed a so-called PV tower (Pang and Fu, 2017). To investigate the role of PV in the evolution of the cyclone event, four test runs - namely, a control run, no latent heat release run (noLHR), no surface flux run(noSFLX), and no latent heat release and surface flux run(noLHR+SFLX) - were conducted using WRF v4.0 (hereafter named diabatic tests). The horizontal resolution of the noLHR run, the noSFLX run, and the noLHR+SFLX run were set to 10 km, and the microphysical scheme was switched off during these three runs to avoid the latent heat release from the microphysical scheme. The cyclone passed over the Changbai Mountains during the initial stage of the cyclone. The cyclone did not develop explosively until it passed through the mountain and over the ocean. To examine the influences of the mountain on the evolution of the cyclone, we designed two topography tests: removing the mountain (hereafter noTOPO) and doubling the height of the mountain (hereafter Double-TOPO). The same physical parameterizations were deployed in all these tests. The name of all sensitivity tests is shown in Table 1, and SST tests will be introduced in ‘c)SST tests’ later.
a) Diabatic tests
Fig.8a shows the tracks of the cyclone from various sources, including FNL, the control run, the noLHR run,the noSFLX run, and the noLHR+SFLX run. The track of the control run was somewhat south of the FNL track before the cyclone passed over the Japan Sea. Over the Japan Sea, the cyclone track of the control run was located to the west of the FNL track. The central sea surfacepressure of the control run was lower than the FNL result(Fig.8b). The model simulation produced a stronger cyclone and reproduced the cyclone reasonably based on the track and the central sea level pressure (Figs.8a, 8b).

Table 1 Name of all sensitivity tests
From Figs.8a and 8b, we can see that the moving track of the cyclone from the noSFLX run and the noLHR +SFLX run was far to the east of the FNL track and the central sea level pressure from these two runs almost did not decrease compared with the three other runs. The later results suggest that the surface latent and sensible heat fluxes played an important role in the evolution of the cyclone. However, the latent heat release may contribute little to the evolution of the cyclone. Fig.9 shows the vertical cross section of PV and equivalent potential temperature at 06 UTC 20 November 2007. A positive PV anomaly and warm core is present in the lower troposphere (about 850 hPa) near the cyclone center in Figs.9a and 9b. Tropopause folding and the PV tower were not observed in both reanalysis data (Fig.9a) and simulation(Fig.9b). In the noSFLX run and the noLHR+SFLX run(Figs.9c, 9e). No positive PV anomaly was found in the lower troposphere near the cyclone center. In the noLHR run (Fig.9d), the positive PV anomaly can be seen in the lower troposphere to the west of the cyclone center. On the basis of the above analysis, we can infer that the surface flux is of great importance to the evolution of the cyclone.
b) Topography tests
The track of the cyclone and the central sea level pressure from two topography tests were compared with the control run, and no obvious difference was found between these tests (figure not shown). These results suggest that the Changbai Mountains cannot affect the moving path and the intensity of the cyclone in terms of the track and the central sea level pressure. However, the Changbai Mountains may prevent the warm moist air from invading the inland and further affect the development of the cyclone.From the evolution of PV in these three tests (Fig.10), one can see that almost no positive PV anomaly is observed in the lower troposphere near the cyclone center in the control run and the DoubleTOPO run. However, when the mountain is removed, a positive PV anomaly occurs in the lower troposphere near the cyclone center during the evolution of the cyclone. The positive PV anomaly in the lower troposphere may be related to the latent heat release(i.e., rainfall). Fig.11 shows the rainfall difference between the control run, the noTOPO run, and the DoubleTOPO.In Figs.11a1, b1, more rainfall was observed in the noTOPO run than in the control run, while in Figs.11a2, b2, almost no rainfall difference was found in the cyclone center.However, in the south of the Changbai Mountains, more rainfall was observed in the DoubleTOPO run. On the basis of the above analysis, we can infer that the Changbai Mountains prevented the warm moist air from invading the inland and further affected the evolution of the cyclone.
c) SST tests
On the basis of above analysis, we can infer that the surface sensible and latent heat flux is determined by the underlying surface (i.e., the ocean). Hence, sea surface temperature (SST) may play a vital role in the evolution of the cyclone, especially for the explosive development of the cyclone. Two SST tests were designed: (1) SST +2K and (2) SST - 2K (as shown in Table 1). Fig.12 shows the time evolution of the central sea level pressure. The test results suggest that the cyclone tended to intensify with warmer ocean surface, and vice versa. This analysis further confirmed the diabatic test results, which indicated that the surface flux plays an important role in the evolution of the cyclone.

Fig.8 (a) Cyclone track during the period from 12 UTC 18 to 18 UTC 21 November 2007. Black line denotes FNL data.Blue line denotes the control run. Green line denotes the noLHR run. Red line denotes the noSFLX run. Light blue denotes the noLHR+SFLX run. Solid circles with solid lines denote the explosive developing stage. Open circles with dashed lines denote the initial and dissipating stages. (b) as in (a) but for time evolution of the central sea level pressure.

Fig.9 Cross section of equivalent potential temperature (red line) and PV (shaded, PVU, 1 PVU = 10-6 K kg-1 m2 s-1)along the line EF at 06 UTC 20 November (a) FNL data, (b) the control run, (c) the noSFLX run, (d) the noLHR run,(e) the noLHR+SFLX run. The arrow denotes the location of the surface cyclone center.

Fig.10 Cross section of equivalent potential temperature (red line) and PV (shaded, PVU, 1 PVU = 10-6 K kg-1 m2 s-1)along the line EF at (ai) 09 UTC 19, (bi) 12 UTC 19, (ci) 15 UTC 19, (di) 18 UTC 19 November 2007, i = 1, 2, 3 denote the control run, the noTOPO run, and the DoubleTOPO run, respectively.
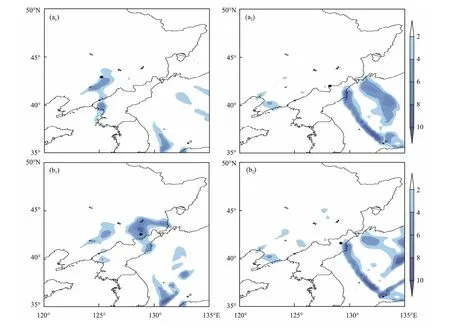
Fig.11 Rainfall difference (mm) at (ai) 09 UTC 19, (bi) 15 UTC 19 November 2007. i = 1, 2 denotes the noTOPO run minus the control run and the DoubleTOPO run minus the control run, respectively.
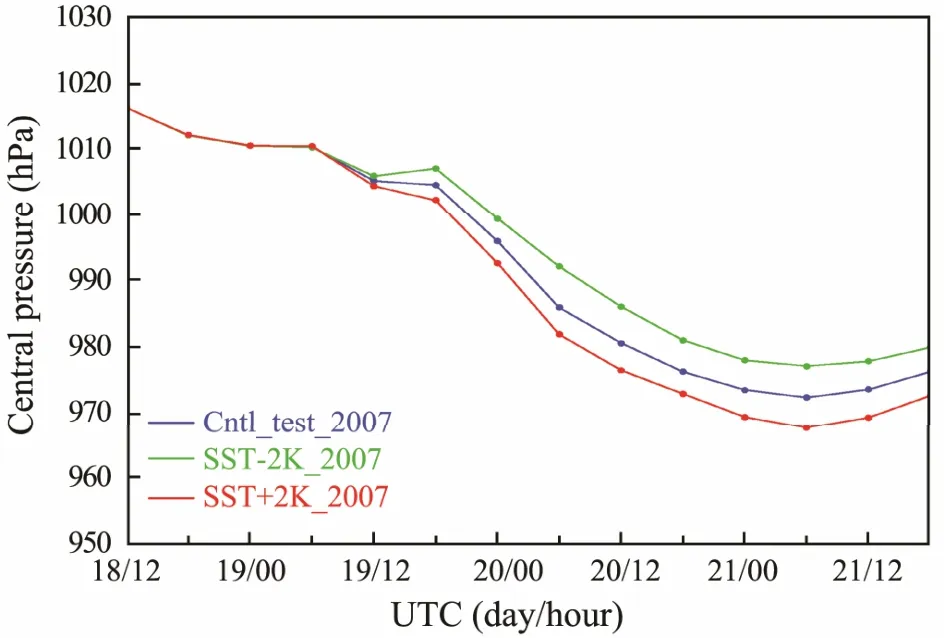
Fig.12 Time evolution of the central sea level pressure.Blue line denotes the control run. Green line denotes the SST - 2K run. Red line denotes the SST + 2K run.
5 Discussion and Conclusions
In this study, an extratropical explosive cyclone occurred over the Northwest Pacific from November 18 to 21, 2007 was investigated observationally and numerically. A comma-shaped cloud system formed during the mature stage of the cyclone, with a strong frontal cloud to the south of the comma-shaped cloud. The cyclone passed over the Changbai Mountains without explosive development during the initial stage. After passing through the mountains and entering the Japan Sea, the cyclone developed explosively at 00 UTC 20 November 2007. The maximum central deepening rate reached 1.3 Bergeron at 06 UTC 20.Then, the cyclone moved northeastward and dissipated over the ocean to the east of Sakhalin Island at 18 UTC 21. The surface cyclone was located poleward side of the upper-level jet, which was favorable for the development of the cyclone. A lower-level jet transported warm moist air to the cyclone center.
The Z-O vorticity budget equation was utilized to diagnose the evolution of the cyclone. The results suggest that the explosive cyclone was initiated primarily by the vorticity advection during the initial stage. Thereafter,temperature advection increased to be comparable to the vorticity advection. In contrast, adiabatic cooling in the ascending air and friction term damped the two primary development terms, while latent heat release exerted a relatively small influence in the cyclone domain.
The diabatic test results suggest that the surface latent and sensible heat flux plays an important role in the evolution of the cyclone in terms of PV anomaly in the lower troposphere. This result is further confirmed by the SST tests. Two SST tests indicate that the cyclone tended to intensify with a warmer ocean surface. The topography tests indicate that the Changbai Mountains prevented the warm moist air brought by the lower-level jet from invading the inland and further led to the non-explosive development of the cyclone. Thus, the cyclone cannot develop explosively due to the presence of the Changbai Mountains. When the cyclone moved over the Japan Sea,it was intensified by the warm sea surface and then developed explosively.
Acknowledgements
This study is supported by the National Key R&D Program of China (Nos. 2017YFC1404100 and 2017YFC 140 4101), and the National Natural Science Foundation of China (Nos. 41775042 and 41275049).
杂志排行
Journal of Ocean University of China的其它文章
- Paleosalinity and Its Association with Organic Matter:A Case Study from the Eocene Shahejie Formation,Laizhou Bay Sag, Bohai Bay Basin (China)
- Studies on the Inversion Phenomenon of Physical Properties Observed in the Huagang Formation Reservoir in the Xihu Sag Based on the Water-Rock Reaction Experiments
- Effect of Sand Body Enrichment Under the Restriction of a Tectonic Transfer Zone: A Case Study on the Pinghu Formation in the Kongqueting Region on the Pinghu Slope
- Relationship Between Paleogene Reservoir Densification and Hydrocarbon Accumulation in the Xihu Depression
- Adjoint Method-Based Algorithm for Calculating the Relative Dispersion Ratio in a Hydrodynamic System
- Analysis of the Leading Modes of Autumn Precipitation over the Yangtze River Basin
