Critical peak rebate strategy and application to demand response
2021-08-24HejunYangXinyuZhangYinghaoMaandDaboZhang
Hejun Yang, Xinyu Zhang, Yinghao Ma and Dabo Zhang
Abstract Time-of-use (TOU) pricing strategy is an important component of demand-side management (DSM), but the cost of supplying power during critical peak periods remains high under TOU prices.This affects power system reliability.In addition, TOU prices are usually applicable to medium- and long-term load control but cannot effectively regulate short-term loads.Therefore, this paper proposes an optimization method for TOU pricing and changes the electricity consumption patterns during the critical peak periods through a critical peak rebate (CPR).This reduces generation costs and improves power system reliability.An optimization model for peak-flat-valley (PFV) period partition is established based on fuzzy clustering and an enumeration iterative technique.A TOU pricing optimization model including grid-side and customer-side benefits is then proposed, and a simulated annealing particle swarm optimization(SAPSO) algorithm is used to solve the problem.Finally, a CPR decision model is developed to further reduce critical peak loads.The effectiveness of the proposed model and algorithm is illustrated through different case studies of the Roy Billinton Test System (RBTS).
Keywords: Demand side management (DSM), TOU price optimization, Critical peak rebate, Reliability analysis
1 Introduction
Demand response refers to the demand side management mode in which users transfer or reduce loads in response to electricity prices or incentive signals.Time-of-use(TOU) pricing is an important part of demand response strategy [1–3], which can not only delay the need for grid investment, but also improve power system stability, and thus has been widely used in the electricity market [4–6].However, as discussed in [7], users are not well prepared to respond to time-varying prices, and therefore TOU pricing is usually only applied to medium and long-term load regulation.Thus, even if peak-flat-valley (PFV) TOU pricing is implemented, load in the critical peak period(i.e., critical peak load) will still be high [8].The presence of critical peak load not only reduces the utilization rate of power equipment, but also affects the safe and reliable operation of the power system.Therefore, it is necessary to combine TOU pricing with short-term critical peak load regulation to improve system reliability and the economy of system operation.
PFV period partition is an important part of TOU electricity price research.Several studies in [9–11]derive period partition results directly from experience, while ignoring the difference of period partition in different cases.The K-means clustering algorithm is used in [12] to obtain the best period partition results,though the randomness of initial values can cause nonunique partial results.In [13], a novel approach is proposed to efficiently reveal the latent cluster structure of multi-view data for clustering, while [14] introduces a classifier design method based on a modification of traditional fuzzy clustering.An evolving fuzzy clustering approach is developed in [15], which uses a fuzzy membership concept to break down clustering in epochs instead of running the clustering of all data at once.To integrate more comprehensive information from different views, reference [16] develops a fuzzy clustering model using a low-rank tensor to address the multi-view data clustering problem.However, the algorithms in [13–16] are complex to implement and have difficulty in meeting the fuzzy judgment criteria of period partition.An enumeration iteration method is used in [17] to partition periods of each month.However, it is sensitive to outliers and has no constraints on the length of the period.Since the length of the period will affect user electricity consumption habits, it needs to be limited.
TOU electricity prices are usually determined according to multiple objectives and obtained through optimization algorithms.In [17], a TOU price optimization model considering the benefits of the grid side is proposed, while [18] develops a consumer satisfaction indicator to measure the quality of the user experience.In[19], an optimal TOU electricity pricing model is investigated and the particle swarm optimization (PSO) algorithm is adopted to solve the proposed optimization problem.However, although the PSO algorithm has a high convergence speed, it is easy for it to converge to a local optimal solution.The simulated annealing (SA)algorithm introduced in [20] has high global convergence, but takes a long time to converge.
Critical peak pricing (CPP) is a pricing mechanism proposed for the critical peak load, and it can guide users to reduce or transfer their critical peak loads [21].At present, most CPP-related research is based on a fully open electricity market environment [22].Reference [23]introduces the design and implementation of CPP among types of electricity users, while the study presented in[24] develops a critical peak rebate (CPR) strategy in the CPP mechanism and analyzes the load adjustment effects of TOU price and CPP strategy, respectively.In [8], a TOU pricing with incentive strategy is developed without considering the incentive cost and the impact of incentives on other periods.
This paper mainly studies the load regulation effect on TOU electricity pricing and CPR strategy, and analyzes the reliability of the regulation results.A period partition method based on fuzzy clustering and enumeration iteration is proposed first to obtain the optimal period partition.It uses an “exponential similarity coefficient” instead of “Euclidean distance” to dilute the influence of outliers on moving variables.To meet the interests of both grid and user, a multi-objective PFV TOU electricity price optimization model is then established.A simulated annealing particle swarm optimization (SAPSO) algorithm is then proposed with high convergence speed and global convergence for the optimal TOU prices.A critical peak load regulation model based on CPR strategy is constructed to combine critical peak load regulation with TOU pricing, where the critical peak rebate in the model is derived from users’power shortage cost [25, 26].Finally, the Roy Billinton Test System (RBTS) system is used in case studies to prove the correctness and effectiveness of the proposed model and algorithm.
The distinctive features and innovative contributions of this paper are as follows:
1.Based on fuzzy clustering theory, this paper proposes a PFV period partition model, which can comprehensively analyze the load data of several typical days and add length constraints to the periods.An iterative algorithm is then proposed to find the optimal period partition scheme.In addition, to reduce the influence of outliers on the position of moving variables, an exponential similarity formula is introduced to characterize the similarity of each time to different periods.
2.Considering the interests of both grid and demand sides, an optimization model of TOU pricing is proposed and is solved using the SAPSO algorithm,which is developed based on the PSO and SA algorithms to ensure high convergence speed and global convergence.
3.Within the context of TOU pricing, a critical peak load adjustment model based on CPR strategy is proposed to further reduce peak load.In this model, the critical peak load reduction is determined by an elastic coefficient adjustment strategy and the principle of proportional distribution is implemented by signing agreements with users.
4.A CPR decision-making model based on power shortage cost is proposed to compensate users’ participation in the CPR strategy and to further improve the stability of the power system.
2 Optimal period partition iteration method based on fuzzy clustering
According to TOU electricity pricing theory, a typical day is divided into a few PFV periods [1].Thus this section establishes a period partition model based on fuzzy clustering theory and presents a period partition algorithm based on an enumeration iterative algorithm.
2.1 Period partition optimization model
Users’ load characteristics in a single quarter are similar, so this section divides PFV periods by analyzing the load data in a quarter.A typical day in each month is selected, and the load data of three typical days in each quarter are grouped to divide into PFV periods.From fuzzy clustering theory, three fuzzy judgment criteria are designed, i.e.:
1.The probability of the lowest point on the load curve being in the valley period is 100%, and the probability of the highest point being in the valley period is 0%.
2.The probability of the highest point on the load curve being in the peak period is 100%, and the probability of the lowest point being in the peak period is 0%.
3.The possibilities of other points of the load curve belonging to different periods are determined by the semi trapezoid membership.
If the load at the timeiof the typical day of thejth month in the quarter is expressed asqij, wherej= 1, 2, 3 andi= 1,2, …, 24, andqminjandqmaxjrepresent the respective minimum and maximum loads during a typical day of thejth month, the range normalization ofqijis expressed according to semi trapezoid peak membership degree as:

whereUijrepresents the peak membership degree of timeiin the typical day of thejth month.
The peak membership degreeUiwhich represents the probability of timeibeing in the peak period is given as:

According toUivalues from small to large, all times are sorted and boundaries between different periods are determined jointly by peak and valley membership degrees.These cannot be obtained byUialone.Therefore, this paper introduces moving variables and reference points of peak membership.(0,0,0) and (1, 1, 1) are the reference points of the minimum and maximum peak membership, respectively, while the moving variables are the points on the shortest distance between (0, 0, 0) and (1, 1, 1).The boundaries are determined by calculating the maximum similarity between the peak membership degrees at each moment and the corresponding moving variables.
mp,mfandmvare defined as the moving variables of membership degree in PFV periods, and are uniformly expressed asms={p,f,v}.To reduce the influence of outliers on the position of the moving variables, the similarityrisbetween the timeiand the moving variablesscan be obtained by:

In this section, length constraints are added to period partition results, and the PFV period partition model can be expressed as:
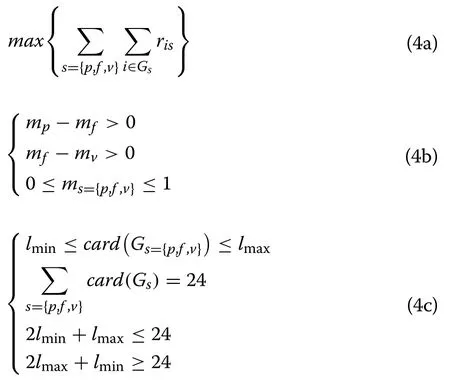
whereGsrepresents the time set of periods, andcard(Gs)represents the number of times in the periods.lminandlmaxrepresent the minimum and maximum of the period length, respectively.
2.2 Period partition iterative algorithm
The three moving variables are considered to move in equal steps, and the objective function is calculated step by step.The period partition result is selected as the optimal result when the objective function is the largest.The calculation process of the optimal result is as follows:
Step 1Set the moving step size ofms={p,f,v}as:

whereNis the maximum number of steps that the moving variable moves.
Step 2Initialize moving variables.Sincems∈ [0,1], with the constraint conditions shown in (4b),ms={p,f,v}is initialized as:

Step 3Determine the period partition.The 24 times are sorted in positive order according to the values ofUi, and the sequence corresponding to timeiis set asLi.In the light of (4c), it is considered that whenLi∈ [1,lmin], the probabilityUiofiis small, soi∈Gv.WhenLi∈ [25−lmin,24],Uiis large, soi∈Gp.lmintimes are then added to the largestriffrom remaining times toGf, and the maximumris={p,f,v}of each remaining time is calculated and classified into the corresponding setGs.
Step 4Calculate the value of the objective function.Ifcard(Gs={p,f,v}) >lmax, the objective function value of this iteration is 0; otherwise, it is calculated according to (4a).
Step 5Determine the optimal results.If the current value of the objective function is greater than the optimal one, the current value is used as the optimal value and the period partition results are saved as the optimal results.
Step 6Determine if the iteration is terminated.Ifmp= 1,mf= 1-Δmandmv= 1 − 2Δm, terminate the iteration and go to Step 7.Otherwise, find the firstms={p,f,v}that does not satisfy the stopping criteria in descending order, setms=ms+ Δmand initialize the boundary variables greater thanmsaccording to (6), and then return to Step 3.
Step 7Output optimal period partition results.
3 Optimization model of PFV TOU electricity price
In this section, the objective functions of the grid-side and user-side are integrated to establish a TOU electricity price optimization model.The SAPSO algorithm is then proposed to obtain the optimal electricity prices.
3.1 Grid side objective functions
The objective functions of the grid-side are to minimize the peak load and the peak-to-valley load difference, as:
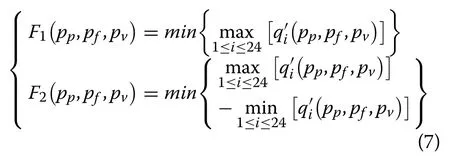
whereF1(·) andF2(·) are the objective functions,pp,pf,andpvare decision variables, andq′i(·) denotes the optimized power at timei.
3.2 User side objective functions
The maximum power consumption similarity and the maximum user satisfaction are taken as objective functions:

The power consumption similarityK(Spearman similarity equation) and the user satisfactionSare:


whereqiandrepresent the loads at the timeibefore and after optimization, respectively, whereasandqand‾q′ are the respective average loads before and after optimization.p0is the initial price andpirepresents the TOU price at timei.
3.3 Constraint functions of PFV TOU Pricing
1.Users’ benefitAfter implementing the TOU price, the electricity expense of users will not increase, i.e.:

whereg1(·) is the constraint function.QsandQ′sare the loads in periodsbefore and after optimization,whereasp0andpsare the electricity prices in periodsbefore and after optimization, respectively.
2.Benefit to the power supplierthe stability of the power system will be improved considering the TOU price,and the power supply cost will be reduced.The total benefit to the power supplier will not be reduced after the TOU price, i.e.:

whereλis the benefit coefficient [27].
3.Electricity rateTo prevent the peak and valley periods from being inverted, it is necessary to restrict the price relationship of each period, as:

4.Marginal cost priceThe price in the valley period shall be higher than the marginal cost price in the valley period, i.e.:

wherepcis the marginal cost price.
5.Electricity consumption similarityTo make the optimal load strategy similar to the users’ power consumption habits, it is necessary to ensure that the load distributions before and after optimization are consistent, i.e.:

whereηis the adjustment coefficient.
6.Total electricity consumption:The total daily load should be guaranteed to change within a certain range before and after the TOU price as:

3.4 Single‑objective fitness function of TOU optimization
This section transforms the multi-objective function into a single objective function by proportion coefficients and the penalty functionJ(P) related to the constraints as:

whereβiis the ratio coefficient of objective functionFi(·)and can be used to represent different user types.P= (pp,pf,pv) andJ(P) is the penalty function from [28].
3.5 Calculation method of hourly load
The price elasticity coefficient of demand can show the sensitivity of user demand to price change.This section defineseij(i, j=p, f, v) as the price elasticity coefficient,which represents the impact of the price change in periodjon the load in periodi.The effect of the price change on demand is given as:

whereQp,QfandQvdenote the power consumption in peak, flat and valley periods at the initial price, respectively, whereas ΔQp, ΔQfand ΔQvare the respective load changes in different periods after the TOU price.Δpp, Δpfand Δpvare the respective changes of price in different periods considering the TOU price.
From (16), the load change at each time after the TOU price can be further calculated as:

whereiandlare times, and Δqiandqiare the load change and initial load at the timei, respectively.eilis the elasticity coefficient corresponding to the periods of timeiand timel.klis the number of times in the periodlandplis the electricity price at the timelunder the TOU price.
The loadq′iat the timeiunder the TOU price is:

3.6 Optimization method of PFV TOU price based on the SAPSO algorithm
This section combines the PSO algorithm with the SA algorithm and proposes a SAPSO algorithm which has high convergence speed and global convergence, to obtain the optimal TOU electricity prices.
In this section, the new variables are defined as follows:Mis the iteration number,idenotes theith particle,andjdenotes thejth dimension.Each particle has three dimensions,j= 1 for the peak period,j= 2 for the flat period, andj= 3 for the valley period.Each particle has position and velocity variables, which are continuously updated during iterations.andare the position and velocity variables of thejth dimension of theith particle in thekth iteration.XmaxandXmindenote the upper and lower limits of the position variable, whileVmaxandVminrepresent the upper and lower limits of the velocity variable.BiandB′ are the local and global optimal fitness variables of particlei.bijis the optimal position variable of thejth dimension of theith particle, whilebgjis the optimal position variable of thejth dimension of all particles.T0is the initial temperature,Tis the temperature variable andDis the decay rate of temperature.
The optimization steps of TOU pricing based on the SAPSO algorithm are as follows:
Step 1Initialize position variables, velocity variables,and temperature variables.
• Select 2 × 3 ×Mrandom numbersRij(i= 1, 2,…,M;j= 1,2,3), which are uniformly distributed in [0, 1],and setk= 0.
• Initialize the position variableXij0, velocity variableVij0of each particle, and the temperature variableTas:

Step 2Initialize local and global optimization variables.
• Calculate the fitnessF[of all particles and assignF[Xi0] to the local optimal fitness variableBi.It is assumed that the local optimal location variablebijis the location variableXij0.
• Compare the local optimal fitness variableBiof all particles, assign the minimum value to the global optimal fitness variableB′, and assign its location variable to the global optimal location variablebgj.
• Letk=k+ 1.
Step 3Update velocity and position variables.
• Select 3 ×Mrandom numbersHij, which are uniformly distributed in (− 1, 1).
• Update the velocity variableVij0and position variableXij0of all particles as:

wherec1andc2are constants,~ U (0, 1) andR′ij~ U (0, 1) are two independent random variables,andρis the contraction factor, which can be calculated by:

• Limit the position variable according to the upper and lower limits as:

Step 4Calculate the fitness of all particles.
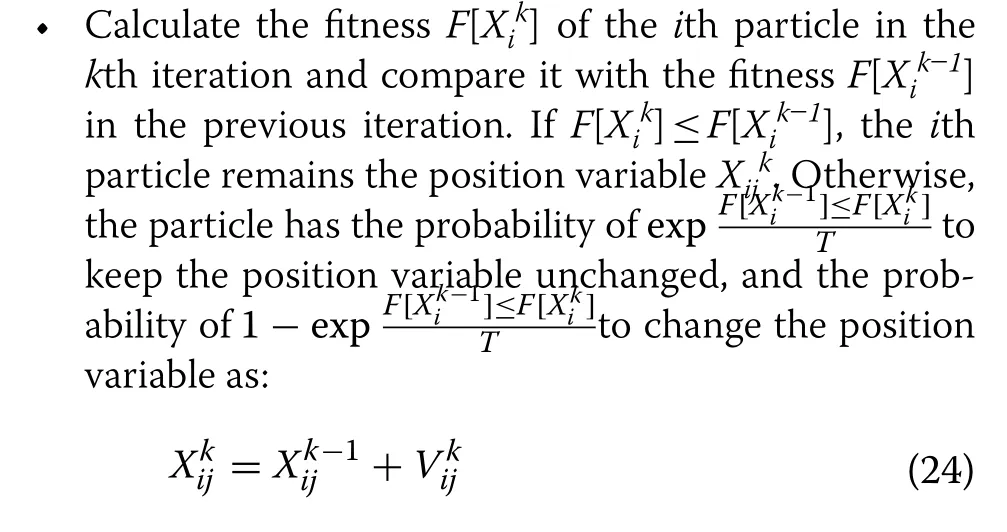
• If the position variable of particleichanges, recalculate the fitness variableF[Xik].
Step 5Update the local and global optimization variables of all particles.
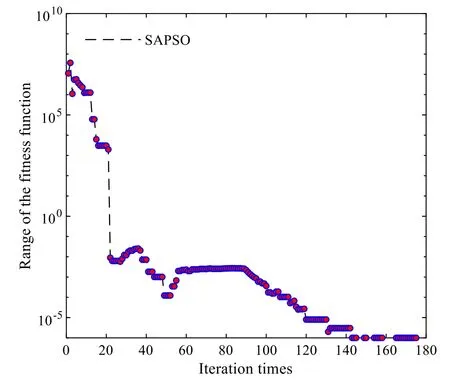
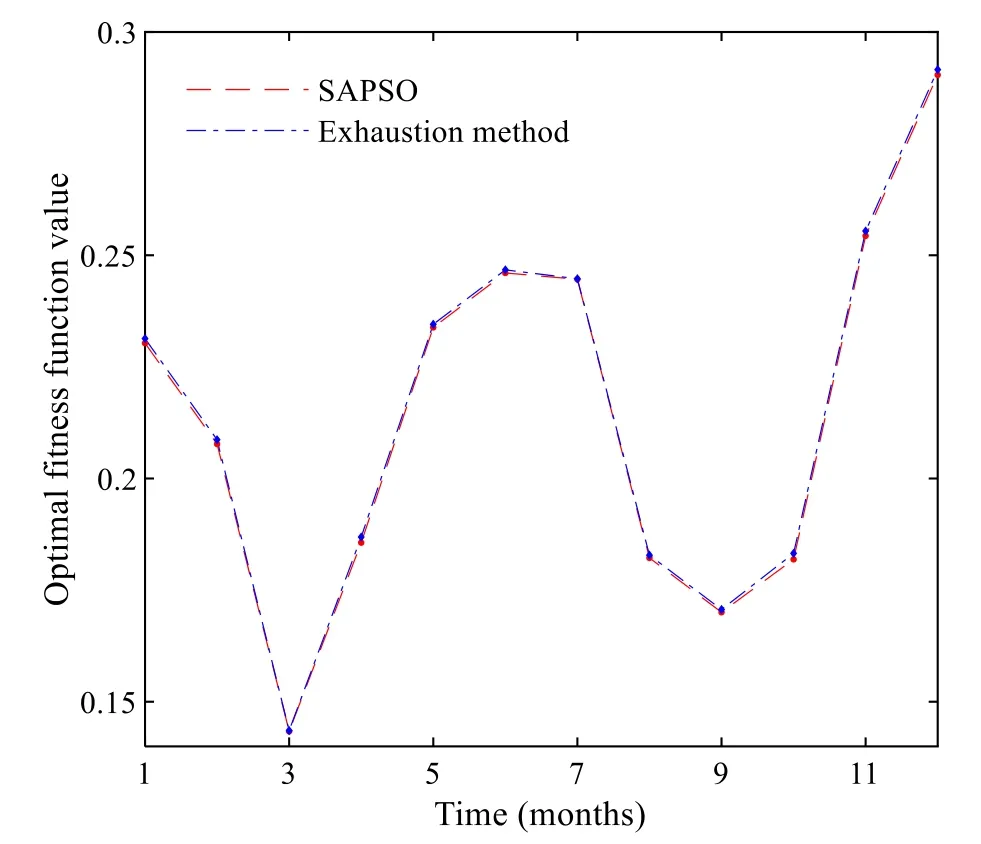
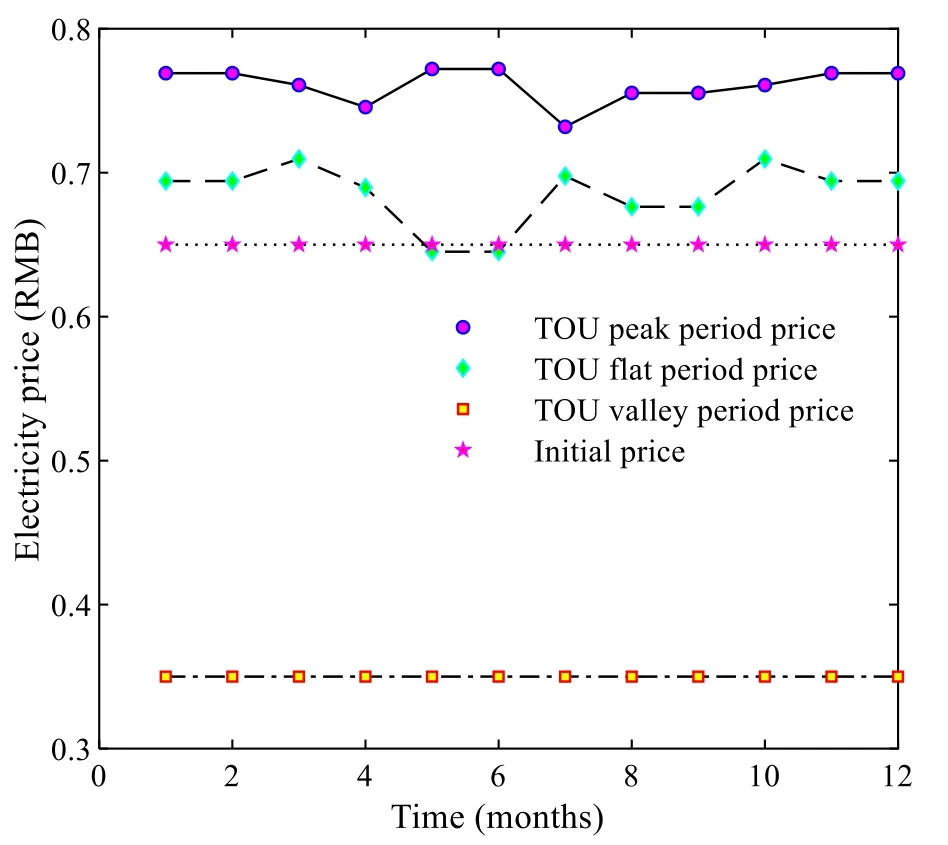
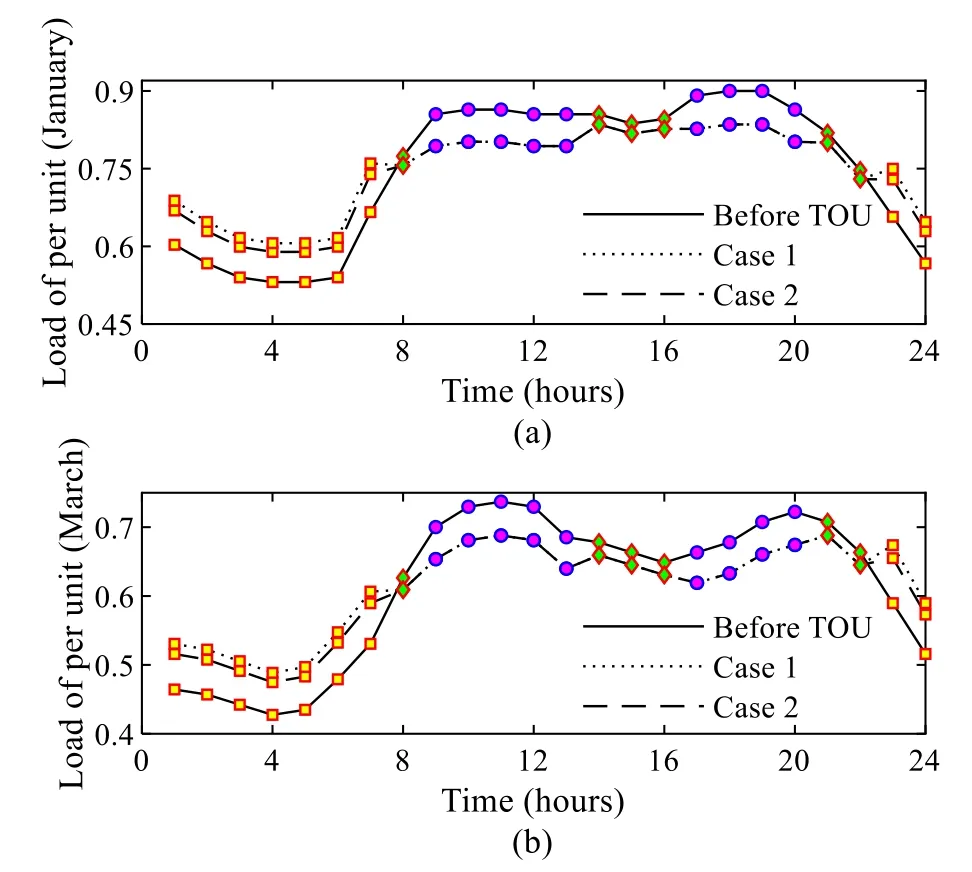
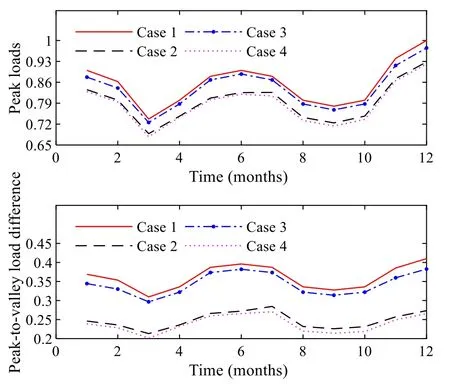
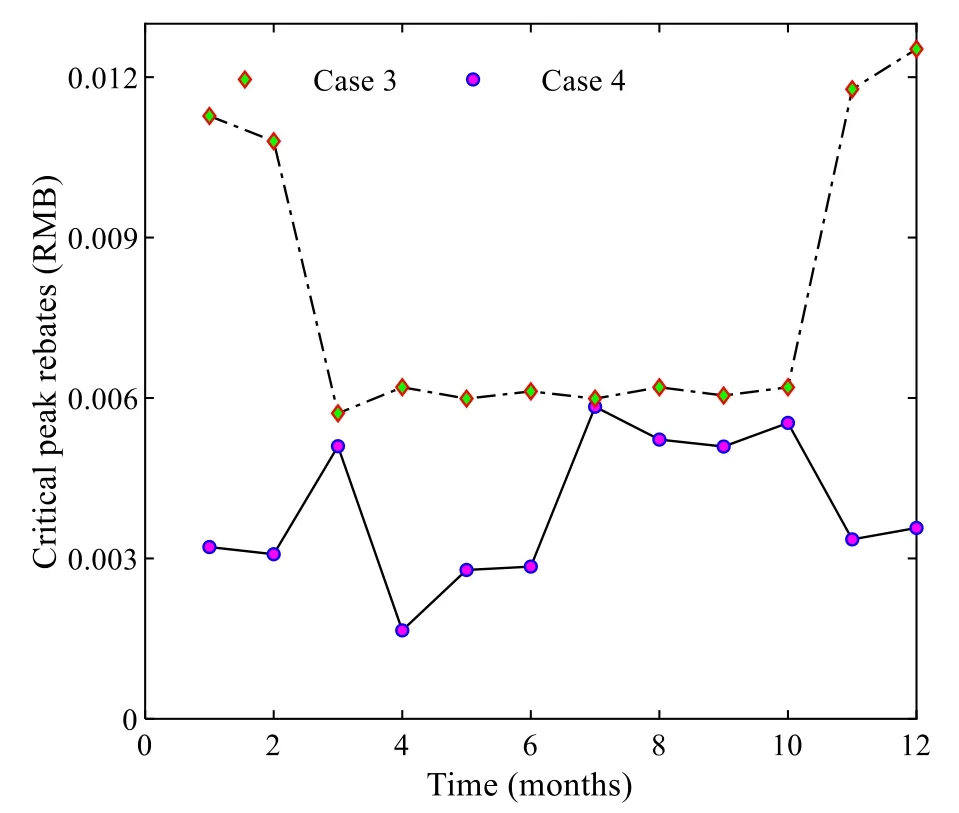
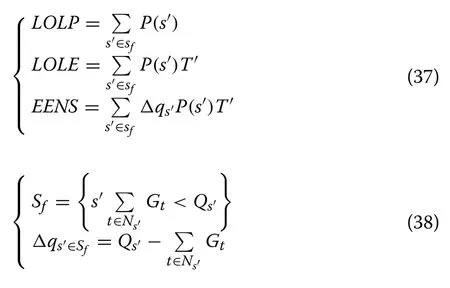
• Compare the fitness variableF[Xik] of theith particles in thekth iteration with the local optimal fitness variableBi.IfF[Xik] • Compare the minimum local optimal fitness min(Bi)of all particles with the global optimal fitness variableB′.If min(Bi) Step 6Update the temperature variable as follows: Step 7Termination criterion of iteration. Check whether the fitness converges to the rated value.If so, output the global optimal fitness variableB′, the global optimal location variablebgj(j= 1,2,3), and the optimized load at each time; otherwise, letk=k+1and return tostep 3. This section further divides the critical peak period and regulates the critical peak load.The third-order price elasticity matrix in the previous section cannot directly reflect the elastic relationship between the critical peak period and other periods.Therefore, based on the CPR strategy, a critical peak load regulation model is presented.This signs contracts with users to determine the load to be directly reduced in the critical peak period and provides users with the critical peak rebate for load reduction.In this paper, the scheme of implementing CPR under TOU pricing is set as a TC strategy. In this section, the daily critical peak loads are adjusted separately.Because the daily load distribution may differ greatly from that of the quarterly load, the periods are divided again according to the daily load under TOU pricing, and the steps are as follows: Step 1Input the daily load data under TOU pricing,and divide PFV periods according to the TOU period partition method.Because the daily load is analyzed instead of the quarterly load, the dimension of variableqijis 1, and Step 2Save the period partition results in step 1 and the value of the peak period moving variablemp.The peak membership degreeUiof each time in the peak period is compared withmp, and ifUi≥mp, timeibelongs to the critical peak period; otherwise, timeibelongs to the peak period. Step 3Output period partition results. The critical peak load adjustment strategy is based on the premise that the period partition results before and after the CPR strategy are consistent.The load adjustment process is as follows: • Calculate the load to be reduced in the critical peak period. • Calculate the load increase in other periods according to the historical data and elastic coefficients. • Predict the load of each time after CPR strategy according to the proportional apportionment principle. Setas the total load in periodsunder TOU pricing.Q′pis the total load in the peak period, andp1andcpthe peak period and the critical peak period after the critical peak period partition, respectively.Thenwhereis the load of the peak period andQ′cpis the load of the critical peak period.Letθcpbe the critical peak-peak load transfer rate,θcfthe critical peak-flat load transfer rate,θcvthe critical peak-valley load transfer rate, thenθcp+θcf+θcv= 1.denotes the load of each period after CPR strategy, and ΔQcpdenotes the load reduction of the critical peak period under CPR.Assuming that the total load of the day remains unchanged after CPR strategy,the load of each period under CPR is: Then the load at each time, according to the proportional apportionment principle, is calculated by: wheresis the period of timei,q′iandq′′idenote the load of timeibefore and after the CPR strategy, andandQ"s={cp,pl,f,v}represent the load of periodsbefore and after the CPR strategy, respectively. In order to maximize the value of ΔQcpwithout changing the period partition, ΔQcpcan be obtained by: This section uses the price elasticity matrix and the load data at each time under TOU pricing to find the load transfer rate.The CPR and the peak price are assumed to have the same effect on the flat load and valley load, i.e.: Letθcp:θcf:θcv=a1:a2:a3.a2anda3can be expressed as: a1can be approximately obtained from the relationship between load changes in different periods under TOU pricing as: Load transfer rates are calculated by: The power shortage costC(qi) in [26] has a quadratic relationship with load reductionqiat timeias: whereC(qi) is the cost of reducing the loadqi,τiis the user type parameter, andk1andk2are constant coefficients.In this paper, the data in [26] is used, i.e.,k1= 0.5,k2= 1.The benefit of power reduction is: whereC′(qi) denotes the benefit of load reductionqi, andC′(qi) =C(qi).piis the TOU price at timei, andaiis the rebate corresponding to timei.The relationship betweenaiandqiis: From the above equations, whenqi≠ 0,ai=k1qi, and the daily rebateAduring the critical peak period can be obtained as: whereGcprepresents the set of critical peak times. In this study, to simplify the calculation, the maximum peak load day in each month is selected as the typical day.The minimum and maximum lengths of periodlminandlmaxare 6 and 10, respectively.The ratio coefficients areβ1=β2=0.5,β3=β4= − 0.3, the benefit coefficientλis 0.062, the marginal costpcis 0.35 RMB, the adjustment coefficientηis 1.2, the initial pricep0is 0.65 RMB,and the elasticity coefficients are set according to [17].The load data and reliability test data are provided by the RBTS system [29, 30], and the peak load is 185 MW.For statistical purposes, it considers 30 days in a month. According to the period partition optimization model,the optimal period partition results of four quarters are obtained.Figure 1 shows the initial load of the first two quarters with different periods distinguished by color markings.In the first quarter, the peak periods are 9:00–13:00 and 17:00–20:00, the flat periods are 8:00,14:00–16:00 and 21:00–22:00, while the valley periods are 1:00–7:00 and 23:00–24:00. Fig.1 Period partitioning for: a first quarter b second quarter Since the load data of the fourth quarter is similar to that of the first quarter, the first three quarters are thus taken as an example to show the peak membership degree of each time in different quarters.The period partition results of the three quarters are shown in Fig.2. Fig.2 Peak membership of each time Taking the first quarter as an example, the value of the objective function and the length of the iteration time are analyzed, as shown in Fig.3.Figure 3a shows that when the number of iterationsN= 48, the function value tends to be static, and it takes 0.262 s to complete period partition as shown in Fig.3b.It can be concluded that the proposed period partition method is efficient. Fig.3 Iterative process of period partition The influence of randomness in the heuristic algorithm on optimization results is examined through repeated experiments.Taking the optimization of TOU electricity pricing in March as an example, 10 groups of experiments are repeated, and the variation of the range of global optimal fitness function with the number of iterations is shown in Fig.4.In a single experiment, the relationship between the global optimal fitness function and the iteration number is shown in Fig.5. Fig.4 The relationship between the range of fitness function and the number of iterations Fig.5 The relationship between the global optimal fitness function and the number of iterations According to Fig.4, although randomness has a great influence on the fitness function, the influence decreases rapidly with the number of iterations.When the number of iterations is more than 160, the influence of randomness on the optimization results largely disappears.It can be seen from Fig.5 that although the entry of randomness at the beginning results in a large fitness function, the algorithm converges rapidly.When the number of iterations is close to 20, the global optimal fitness function decreases significantly, while with over 160 iterations, the SAPSO algorithm obtains the global optimal solution. In addition, the exhaustion method is introduced to verify the global convergence of the optimization results of the SAPSO algorithm.The value range of the TOU price is set as [0.35, 1.2], and the interval is divided into 1000 parts on average.The peak, flat, and valley period prices are exhausted respectively, and the fitness function values under different TOU price cases are obtained.The exhaustion method and SAPSO algorithm are used to calculate the optimal fitness function for 12 months, as shown in Fig.6. Fig.6 Comparison between exhaustion method and SAPSO algorithm It can be seen from Fig.6 that the optimal fitness function obtained by the SAPSO algorithm is smaller than that of the exhaustion method mentioned above,so the SAPSO algorithm has good global convergence.Because the length of the feasible region is 0.85, the deviation from the optimal value is less than 8.5E−04,which fills the daily needs.Thus, the SAPSO algorithm proposed in this paper is accurate and effective. 5.4.1 Analysis on the effect of TOU price The optimal electricity prices for 12 months of the year are shown in Fig.7.The different peak, flat and valley prices have the effect of reducing the peak load and increasing the valley load.It is noted that the valley price is close to the marginal price, so that the load adjustment effect is optimal. Fig.7 Optimal results of TOU electricity prices Based on the initial load of typical days in January and March, two cases are analyzed using the SAPSO algorithm, i.e., Case 1: optimize the TOU price according to the objective functions of the grid side; Case 2: optimize the TOU price by combining the objective functions of the grid side and the user side through (16).The price optimization results of the two cases are shown in Table 1.Based on the hourly load calculation method,the loads at each time corresponding to the price in Table 1 are calculated, as shown in Fig.8.Table 1 indicates that after considering objective functions of the user side, the peak and flat prices decrease while the valley price remains stable, and thus the users’ electricity expenses decrease.It can be concluded from Fig.8 that after the implementation of the TOU price, the peak load decreases significantly, while the valley load increases.However, compared with Case 1, the load curve of Case 2 is closer to the initial load, and the power consumption similarity increases accordingly. Fig.8 Load curves before and after TOU price: a January; b March Table 1 Optimal TOU electricity of different cases The value ofβican be used to represent different user characteristics.Three types of users are defined, i.e., Case 1:β1=β2= 0.5,β3=β4= − 0.3; Case 2:β1=β2= 0.01,β3=β4= − 0.6; Case 3:β1=β2= 0.8,β3=β4= − 0.01.Taking March as an example, the typical daily load curves of different types of users under TOU pricing are shown in Fig.9.As can be seen, the load adjustment effect of TOU pricing is different for different types of users.The load curve of Case 2 is the closest to the initial curve, while the difference of the peak load and peak-to-valley load in Case 3 are the smallest.In addition, the load curve of Case 1 is the most balanced. Fig.9 Load curve of different types of users under TOU price 5.4.2 Effect analysis of CPR The load at TOU price is divided into four periods of critical peak, peak, flat, and valley periods.The frequency distribution of each time in critical peak and peak periods of 12 typical days is summarized in Fig.10.As shown,there are usually two maximum points in the load distribution of a day, and the distribution of the peak period is usually concentrated around 12:00 and 19:00. Fig.10 Distribution of time in different periods Taking the typical days of March and July as examples, the CPR strategy and TC strategy are implemented respectively to adjust the load curves, as shown in Fig.11.The CPR strategy can reduce the load of the critical peak period and the load difference between the critical peak and peak periods.However, the CPR strategy has little impact on the load in other periods, which ensures user’s power consumption similarity. Four cases from two aspects of maximum load and reliability are analyzed, including, Case 1: initial load; Case 2: load after TOU price; Case 3: load after CPR strategy;Case 4: load after TC strategy. 5.5.1 Analysis on load regulation effect of TOU pricing and CPR strategy. The differences of the peak load and peak-to-valley load of 12 typical days in four cases are analyzed and compared in Fig.12.It can be seen that the fluctuation of peak load is much higher than the peak-to-valley load difference under the same regulation mode.Both TOU pricing and CPR strategy can effectively improve load characteristics, especially TOU pricing.The maximum load reduction of CPR under TOU pricing is slightly less than that under the initial price, while the reduction effect of CPR strategy on peak-to-valley load difference is better than that of peak load.Among the cases, Case 4 has the best load characteristics, which proves that the combination of TOU pricing and CPR strategy can maximize the effect of load adjustment. Fig.12 Load characteristics in different cases Based on the 12 typical days, Case 3 and Case 4 are implemented and the critical peak rebates in the two cases are shown in Fig.13.The cost of implementing the CPR strategy under TOU pricing is much lower than that of direct implementation.Thus, to reduce the cost of CPR, the CPR strategy should be combined with TOU pricing. Fig.13 Critical peak rebates in different cases 5.5.2 Reliability comparison before and after load adjustment To measure the reliability of the power system in different conditions, loss of load probability (LOLP), loss of load expectation (LOLE) and expected energy not supplied (EENS) are used as the reliability indices: whereSfis the state set of insufficient capacity of the system,Gtis the output power of thetth generator,Qs′is the load under states′,T′ is the rated period, Δqs′is the load reduction caused by insufficient capacity or constrained power generation under states′. The calculated reliability results are shown in Table 2.It is observed that the reliability data of different cases are different.Both TOU pricing and CPR can significantly improve system reliability, but the effect of TOU pricing is more noticeable. Table 2 Analysis of CPR adjustment in different cases Since the EENS indicators of Case 2 and Case 4 are different, to draw general conclusions, the EENS of the four cases at different peak load levels are analyzed, as shown in Fig.14.It is observed that with the increase of peak load, the EENS values of the four cases increase, while the values of Case 4 are always the lowest.Thus, the implementation of TC strategy can keep the power system at optimal reliability level under different peak loads. Fig.14 EENS in different cases This paper studies the optimal demand response decision and reliability analysis based on TOU pricing and CPR strategy.An iterative method of optimal period partition based on fuzzy clustering is proposed, and the typical daily load curve is divided into PFV periods.The optimal TOU price model considering the interests of both the grid and the user is established, and a SAPSO algorithm is proposed to solve the problem.The peak period under TOU pricing is then divided into a critical peak period and a peak period, and a critical peak load adjustment strategy is proposed to reduce the critical peak load proportionally by signing a user agreement.Given the quadratic relationship between power shortage cost and loadreduction, the decision-making model of CPR is established to calculate daily critical peak rebate.Finally, the IEEE RBTS reliability data is used to verify and analyze each model. The following conclusions can be drawn from the case analysis: 1.When using fuzzy clustering and enumeration iteration technology to divide PFV periods, the iteration results tend to be stable when the number of iterations is above 50.It can also be concluded from the period partition results that the lengths of the three periods are similar, and the time composition of each period is relatively fixed. 2.By combining the grid side and user side objective functions to build the TOU price optimization model, it not only reduces peak load and increases valley load, but also ensures user satisfaction and power consumption similarity, as observed from the load curve under TOU pricing. 3.From the established decision-making model of CPR, it is seen that the rebate is positively related to power reduction.To keep compensation costs down,the load reduction should not be too large.The CPR strategy can effectively reduce critical peak load, but the compensation cost of the TC strategy is lower than that of CPR. 4.CPR and TOU pricing can effectively improve system reliability, while the TC strategy can maintain the optimal reliability level under different peak loads. There are, however, some limitations in the proposed methods in this paper.When the scale of the power system is large and there are many types of users, the selection of a typical day will become an important factor affecting the effect of load adjustment.Therefore, it is necessary to research the selection of typical days in different situations.In addition, in actual scenarios, not all users will be willing to participate in the CPR strategy, even with users’power shortage cost compensated.Therefore, the relationship between the actual participation rate of users and the compensation modes needs to be further explored. Abbreviations TOU: Time-of-use; DSM: Demand side management; CPR: The critical peak rebate; PFV: Peak-flat-valley; SAPSO: Simulated annealing particle swarm optimization; RBTS: Roy Billinton test system; PSO: Particle swarm optimization; SA:Simulated annealing; CPP: Critical peak pricing; TC: The strategy of implementing CPR under TOU price. Acknowledgements Not applicable Authors’ contributions Hejun Yang as the corresponding author, building the modeled, designed and tested the proposed strategy and wrote the papers.Xinyu Zhang contributed to write and revise the manuscript and performed some additional changes.Yinghao Ma and Dabo Zhang checked the data in case studies.All authors have read and approved the paper. Funding This work was supported by Fundamental Research Funds for the Central Universities (PA2021KCPY0053), Anhui Provincial Natural Science Foundation(1908085QE237). Availability of data and materials All data used or analyzed during this study are included in the published article. Declarations Competing interests The authors declare that they have no known competing financial interests or personal relationships that could have appeared to influence the work reported in this paper.
4 Critical peak load regulation based on the CPR strategy
4.1 Critical peak period partition
4.2 Load adjustment strategy based on proportional allocation principle


4.3 Calculation of load transfer rate


4.4 CPR decision model


5 Case study
5.1 Basic data
5.2 Optimal peak‑flat‑valley period partition


5.3 Analysis of SAPSO algorithm

5.4 Effect analysis of TOU price and CPR


5.5 Comparison between TOU pricing and CPR


6 Conclusions
杂志排行
Protection and Control of Modern Power Systems的其它文章
- A comprehensive review of DC fault protection methods in HVDC transmission systems
- Application of a simplified Grey Wolf optimization technique for adaptive fuzzy PID controller design for frequency regulation of a distributed power generation system
- A critical review of the integration of renewable energy sources with various technologies
- Operational optimization of a building-level integrated energy system considering additional potential benefits of energy storage
- An integrated multi-energy flow calculation method for electricity-gas-thermal integrated energy systems
- Sliding mode controller design for frequency regulation in an interconnected power system
