Application of a simplified Grey Wolf optimization technique for adaptive fuzzy PID controller design for frequency regulation of a distributed power generation system
2021-08-24SasmitaPadhyandSidharthaPanda
Sasmita Padhyand Sidhartha Panda
Abstract A Simplified Grey Wolf Optimizer (SGWO) is suggested for resolving optimization tasks.The simplification in the original Grey Wolf Optimizer(GWO) method is introduced by ignoring the worst category wolves while giving priority to the better wolves during the search process.The advantage of the presented SGWO over GWO is a better solution taking less execution time and is demonstrated by taking unimodal, multimodal, and fixed dimension test functions.The results are also contrasted to the Gravitational Search Algorithm, the Particle Swarm Optimization, and the Sine Cosine Algorithm and this shows the superiority of the proposed SGWO technique.Practical application in a Distributed Power Generation System (DPGS) with energy storage is then considered by designing an Adaptive Fuzzy PID (AFPID) controller using the suggested SGWO method for frequency control.The DPGS contains renewable generation such as photovoltaic, wind, and storage elements such as battery and flywheel, in addition to plug-in electric vehicles.It is demonstrated that the SGWO method is superior to the GWO method in the optimal controller design task.It is also seen that SGWO based AFPID controller is highly efficacious in regulating the frequency compared to the standard PID controller.A sensitivity study is also performed to examine the impact of the unpredictability in the parameters of the investigated system on system performance.Finally, the novelty of the paper is demonstrated by comparing with the existing publications in an extensively used two-area test system.
Keywords: Frequency control, Distributed power generation system, Adaptive fuzzy PID controller, Grey wolf optimization, Electric vehicle
1 Introduction
The Grey Wolf Optimizer (GWO) is a new optimization method applied to diversified objectives in different optimization tasks.Because of its comprehensibility, high flexibility, and quick programmability features [1], and dealing with fewer algorithm parameters, it has attracted significant research interests from numerous fields over a short time [2, 3].The performance of the GWO can be enhanced by maintaining an equilibrium amongst the exploration and exploitation stages in the course of searching.A lot of effort has been put in to modify the GWO to improve its performance on optimization problems [4–7].However, modifications of the original GWO method to enhance its versatility increase its complexity.To address such issues, this study simplifies the original GWO method as proposed in [8, 9].In the original GWO, four categories of grey wolves,namely alpha (α),beta (β),delta(δ), and omega (ω) are engaged in mimicking the leadership ladder and equal importance is given to the alpha, beta and delta wolves to compute the updated position of wolves throughout the iterations.In the proposed Simplified GWO (SGWO), the least fit wolves, i.e., the delta wolves, are eliminated and more importance is attached to the α wolves to find updated positions.This not only reduces the complexity and improves the execution time but also improves the solution quality.
In most countries,the majority of electricity supplies are through centralized power plants [10, 11].This results in problems such as high power loss during transmission and distribution, deficiencies in the power grid, unreliable power supply, etc.In addition, there is a lack of flexibility in conventional centralized electricity generation to adjust to the challenges posed by recent changes in energy consumption.Hence a clear shift can be observed from a centralized system to a decentralized mode[12,13].To satisfy the demand of an isolated community, the expansion of DER(Distributed Energy Resources)can be done by interconnection with storage devices[14–17].The probabilistic characteristics of wind and solar sources and random demand create power imbalance and produce frequency oscillation.To overcome these challenges, an intelligent and flexible secondary controller is needed one which can operate in any situations with reduced settling time and oscillation.Therefore, for a Distributed Power Generation System (DPGS) which includes distributed energy resources and energy storage systems, an algorithm which can improve system response and thereby prevent system collapse is essential.
Previous work has shown that effective frequency regulation of the DPGS system is dependent on controller design and the practice used to select the control parameters and gains.Numerous methodologies have been proposed to design the controller gains,e.g.,optimal controller[18],Genetic Algorithm (GA) [19], Particle Swarm Optimization (PSO)[20], Differential Evolution (DE) [21], Teaching Learning Based Optimization(TLBO)[22],Gravitational Search Algorithm (GSA) [23], Cuckoo Search (CS) algorithm [24], BAT algorithm (BAT) [25], MWOA [26], SCA [27] etc.The Jaya algorithm in [28] optimizes PID parameters for frequency control of a power system with renewable sources,while the Electro Search Optimization (ESO) algorithm [29] with balloon effect is proposed to control the frequency of an isolated power system.
Classical controllers may not provide the desired performance for systems containing nonlinearity and constraints [30, 31].Conversely, a Fuzzy Logic Controller(FLC) enhances the attainment of PID structure and can handle nonlinearity and uncertainty.Depending on the choice of Scaling Factors (SFs) engaged in input/output and the controller gains, an FLC can be designed [32].On some occasions, straight forward FLC approaches are not enough to produce the required control actions.In this instance, the controller structure of the FLC can be modified to make it adaptive[33, 34].This paper proposes an Adaptive Fuzzy PID (AFPID) structure that receives the input signal and appropriately changes the output control signal.
The main contributions are:
1.A Simplified GWO (SGWO) approach is proposed to adjust the AFPID parameters of a DPGS for frequency regulation.
2.The advantage of the proposed SGWO over GWO is established by taking several unimodal and multimodal standard functions.
3.The SGWO strategy is deployed to adjust the parameters of an AFPID controller and the outcomes are correlated with the SGWO tuned PID controller in a real engineering problem.
4.Frequency variations, control signals, and power responses of individual regulated sources of the DPGS are examined with established PID and AFPI D controllers.
5.A sensitivity study is performed to prove the robustness of AFPID by introducing variability to parameters of the DPGS.The consequence of uncertainties on DPGS due to AFPID and PID controllers are demonstrated by considering some serious scenarios.
2 System modeling
The proposed SGWO method is tested for tuning of the adaptive fuzzy PID controller to reduce frequency deviation in a DPGS as illustrated in Fig.1 [34].The DPGS system in Fig.1 contains sources such as WTG (Wind Turbine Generator), PV (Solar Photovoltaic), AE (Aqua Electrolysers), an FC (Fuel-cell), a DEG (Diesel Engine Generator), a FESS (Flywheel Energy Storage System), a BESS (Battery Energy Storage System), an EV (Electric Vehicle), etc.In Fig.1, the different elements for generation of power (WTG, PV, FC, DEG) and storage of power (BESS, FESS, and EV) are represented by appropriate transfer functions.Sixty percent of the power generated from the WTG and PV are used for producing the source power and the remaining 40% is used by the AE to make hydrogen for the FC.The dynamic characteristic of the DPGS system is highly erratic as the renewable power outputs rely on climatic conditions.For all the subsystems considered in the DPGS, a centralized controller is implemented instead of many controllers.This results in low maintenance, simple control, and design flexibility with fewer control variables.Communication delays for the signals to reach the controller and for receiving the control signals from the controller are considered.To obtain an acceptable time domain signal with reduced settling time and oscillation, the signals are modified by rate limiters according to the electromechanical characteristics of individual elements presented in the distributed power network as shown in Fig.4.
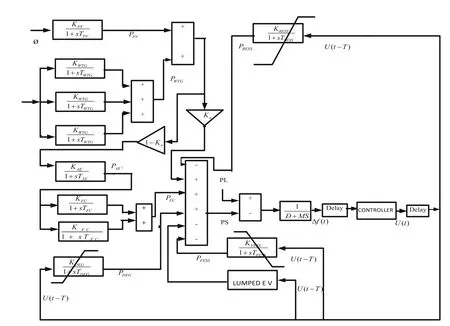
Fig.1 Hybrid power system under study
A.Wind turbine generator
The power produced by three WTGs in Fig.1 is represented by PWP.It depends upon density of air (ρ), velocity of wind (VW), wind turbine’s blade swept area (AR),and is given as:

where CPis the power coefficient.
The wind turbine system has numerous nonlinearities including the pitch system.Change in the pitch angle introduces nonlinearity into the wind turbine.
The WTG transfer function (T/F) is given as:

Where N=1, 2, 3 represents the number of WT units.KWTGand TWTGare the gain and the time constant.In(2), the change of wind power is the input to the wind turbine and the change in the power of the wind turbine generator is the output.
B.Photovoltaic cell
The photovoltaic power (PPV) equation is specified by:

where S is the area of the PV array taken as 4084m2, η is the conversion efficiency of PV cells taken as 10%, and ϕ is the solar irradiation in kW/m2.The PV system T/F is specified by:

The change in Solar irradiation is the input to the PV cell and output is the change in generated PV cell power.
C.Aqua electrolyzer
The aqua electrolyzer gets a significant proportion of the net power produced by wind and PV cells.It produces for FC power generation.The AE TF is given as

D.Fuel cell
The FC plays a major role as it is clear and has high efficiency.The fuel cell generator is a higher-order system but for low frequency, the 1st order T/F is taken as:

N=1, 2 for two units.
E.Diesel engine generator
The (DEG) can supply the deficiency power to minimize the power disparity among demand and supply.It is a nonlinear element as it has generation restrictions.Its T/F is given as:

F.Energy storage system modelling


The transfer function of the BESS is given as:

G.Electric vehicle (EV) modelling
The block diagram representation of EV for frequency regulation is shown in Fig.2.The LFC signal Δ U is given to the EV which receives/gives the real power throughout charging/discharging.The variable ±BkW indicates the battery capacity and TPHEVis the time constant of an EV.The present battery energy is represented by E which is regulated between limits Emaxand Eminassumed as 90% and 80% of the rated energy,respectively.K1and K2are the energy mismatch given as K1=E‐Emaxand K2=E‐Emin.

Fig.2 Modeling of one electric vehicle
In Fig.1, the group of EVs which are ready to contribute power to the grid are engaged as a lumped model for the frequency control scheme.In addition, the LFC signal is sent to the EVs according to their state of charge (SOC) for charging or discharging purpose.Afterward the SOC of the EVs is synchronized.In order for the EV to operate in an LFC strategy, dissemination of information among the EV and power system is necessary.In this paper the LC (local control) centers act as the link between the central load dispatching center(CLDC) and the EV.The LFC signal is directed by the CLDC to the EV and the actual states such as power available in the EV, inverter capacity and amount of SOC from the EV are dispatched to the CLDC by means of the LC centers.CLDC computes the LFC signal from the frequency variation and determines the involvement of the EV in the LFC.The charging and discharging of the EV count on its SOC while SOC is vastly reliant on the LFC signal which CLDC dispatches.When the SOC hits the limiting values, the EV stops participating in LFC.The model for the energy stored in one EV is illustrated in Fig.3.At instant t, the quantity of controllable EVs, Ncontrollable(t) taking part in the AGC is determined from statistics of the original quantity of controllable EVs at the start of the interval that stop participating in the LFC.The total energy model in Fig.3 finds the remaining stored battery energy in an LC center as in [15].The model for the energy stored in one EV is illustrated in Fig.3.
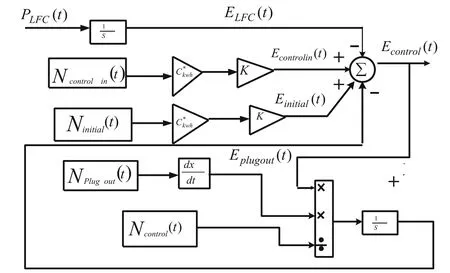
Fig.3 Total energy model of one EV
At time t, the quantity of controllable EVs Ncontrollable(t) taking part in AGC are determined form statistics of the original quantity of controllable EVs at the start of the interval(Ninitial(t))-(Nplugout(t))gives the EV number shifting from controllable condition to driving condition in that time while Ncontrolin(t) gives the EV number shifting from charging condition to controllable condition.Thus, Ncontrollable(t) can be obtained as:

The expression for the energy is given as:

Econtrolin(t) can be written as

In Fig.3, ELFCis the energy related to the LFC signal and is given by integrating the power of local control centre(PLFC)as:

H.Power system modelling
The dynamics of the power system with the change in power (ΔP) as input and the change in frequency (Δf) as output is given by:

In (14), D equals 0.03and is the damping parameter while M=0.4 is the inertia parameter of the DPGS system [20].The relevant data are given in the appendix.
2.1 Structure of AFPID controller
Various approaches can be employed for designing FLC scheme.One approach is the online selection of membership function (MFs) where complexity increases and requires high computation.Alternatively, a PID controller can be used and its gains and input scaling factors are upgraded using optimization technique.In the first design method, the SFs remains fixed while in the other approach the SFs are chosen regularly during controller operation.However, the effectiveness of the Fuzzy PID structure could be unacceptable because of no straight link among inputs errors to the PID.To overcome the above restrictions, Adaptive Fuzzy PID (AFPID) is planned as shown in Fig.4.
In the AFPID, the input is processed through the FLC and is connected to the PID controllers.For the projected AFPID controller, a standard rule base and five MFs (triangular) are selected as displayed in Fig.5.

Fig.5 Membership function of error and change of error of AFLC
The MFs are allocated linguistic variables Negative Big(NB), Negative Small (NS), Zero (Z), Positive Small (PS)and Positive Big (PB) for both input and output as presented later.The SFs are selected by the SGWO method.In the present study, a Mamdani fuzzy inference engine[30] is chosen.Frequency error and change in frequency error are taken as the inputs to the FLC.
2.2 Problem formulation
Minimization of frequency fluctuation (Δf) along with the controller output (Δu) is the objective function and can be depicted by integral square error (ISE) given as:

where k is selected as 5 to give both parts in (15) the same weight in the course of the optimization process.The SGWO method is engaged to tune the PID gains and the SFs of the AFPID controller.The Δf and Δusignal have least J value for the efficient performance of the DPGS.
3 Simplified grey wolf optimization (SGWO)
GWO is one of the recently recommended optimization approaches which is encouraged by coursing behavior and the social ladder of grey wolves [1].GWO has the following key steps:
1.Search the prey and approach it.
2.Encircle it and restricts its movement.
3.Kill the prey.
References[1–5]narrate the above points while in the proposed SGWO, only two categories of wolves (α and β) are considered while delta wolves are neglected like omega wolves in the original GWO algorithm.The updated position formula of the α, β, and δ wolves around the prey during hunting in the original GWO algorithm are governed by

Updated position formula of the α and β wolves in SGWO is formulated by modifying (16) and (17)as:


In the GWO technique, the position of a grey wolf is governed by positions of all participating wolves, i.e.α,β, and δ wolves irrespective of their fitness as:

Being at the front rank of the group, α category wolf is ahead of β category wolf, and the δ category wolf is skipped in the recommended SGWO.More significance is provided to α wolves positions relative to β wolves to decide the position of a grey wolf in the SGWO as expressed by:

4 Application of SGWO for frequency control problems
4.1 Performance assessment of SGWO
Before the application of SGWO, the performance of the SGWO technique for some benchmark test functions(BTFs) is assessed.The expressions of test functions,their features, and optimized values are available in the literature [1].While executing the SGWO algorithms the following algorithm parameters are chosen: search agents=30, maximum iterations=500, no.of runs=30 as proposed in the original GWO.The statistical outcomes such as average and standard deviations as well as execution time for 30 runs are listed in Tables 1, 2,and 3 for unimodal, multimodal, and fixed dimension functions, respectively.To validate the superiority of the SGWO technique over GWO, GSA, PSO in [1] and SCA in [27], the results are compared in the tables.As is seen from Table 1, the SGWO technique is more powerful for unimodal functions and outperforms GWO, GSA,PSO, and SCA for 5 (f1, f2,f3,f4, f7) out of 7functions.

Table 1 Comparison of proposed SGWO with other techniques for unimodal benchmark test functions

Table 2 Comparison of proposed SGWO with other techniques for multimodal benchmark test functions

Table 3 Comparison of proposed SGWO with other techniques for fixed-dimension test functions
The computational times for GWO and SGWO are given in Table 4 for all the unimodal functions.It can be seen that, for all the unimodal functions computational time is less for the SGWO than for the original GWO.For better illustration, the percentage improvements in execution times are reported in Table 4 as well as shown in Fig.6.The corresponding equivalent outcomes of multimodal test functions are provided in Table 5 and Fig.7.It is noticed from Table 5 that, the suggested SGWO surpasses GWO, GSA, PSO, and SCA in all multimodal test functions with reduced computational time compared to the original GWO (shown in Table 5 and Fig.7).
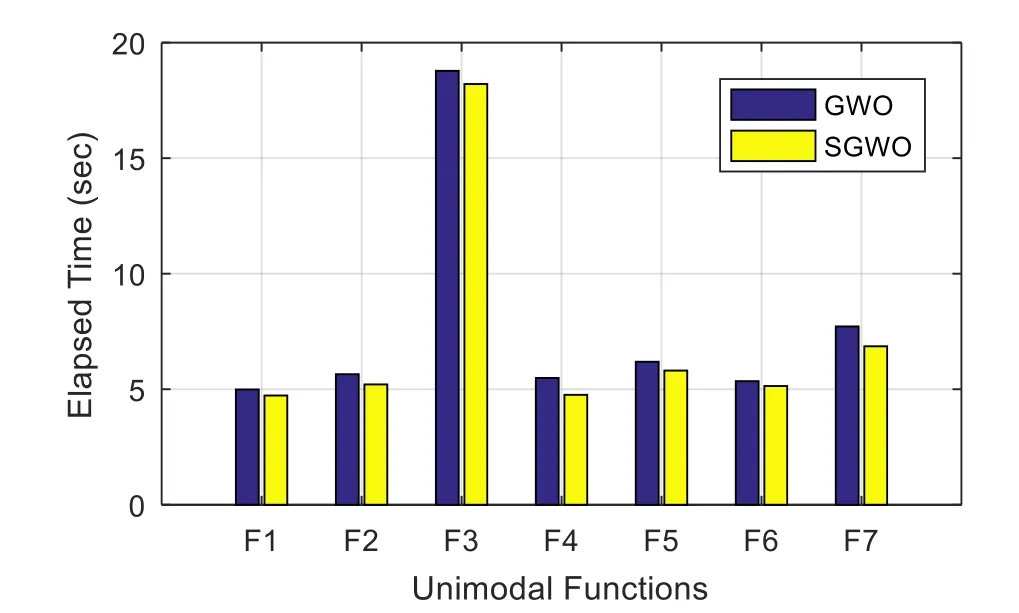
Fig.6 Unimodal function’s Execution time comparison
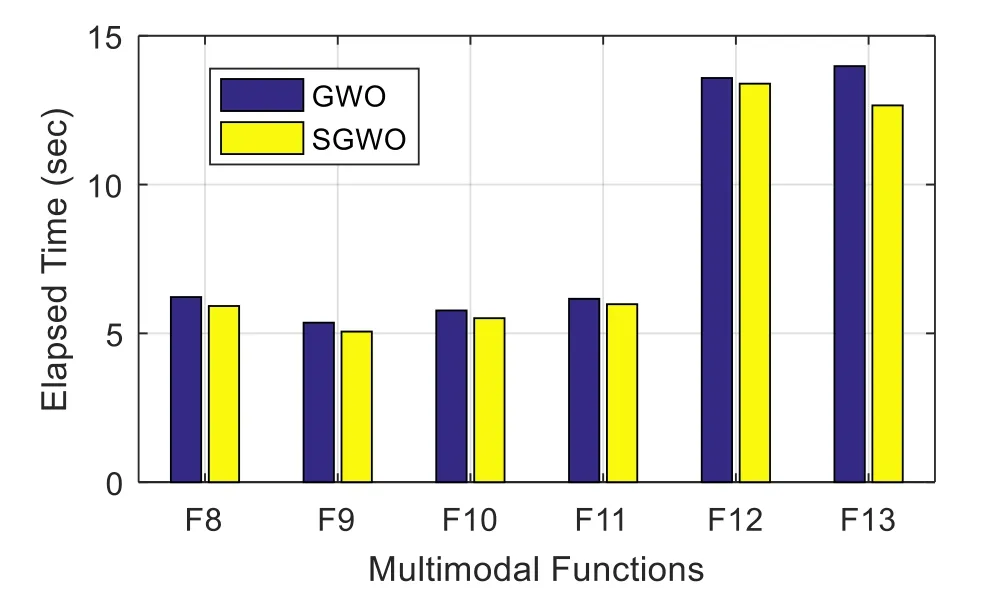
Fig.7 Multi-modal function’s execution time comparison of GWO and SGWO technique
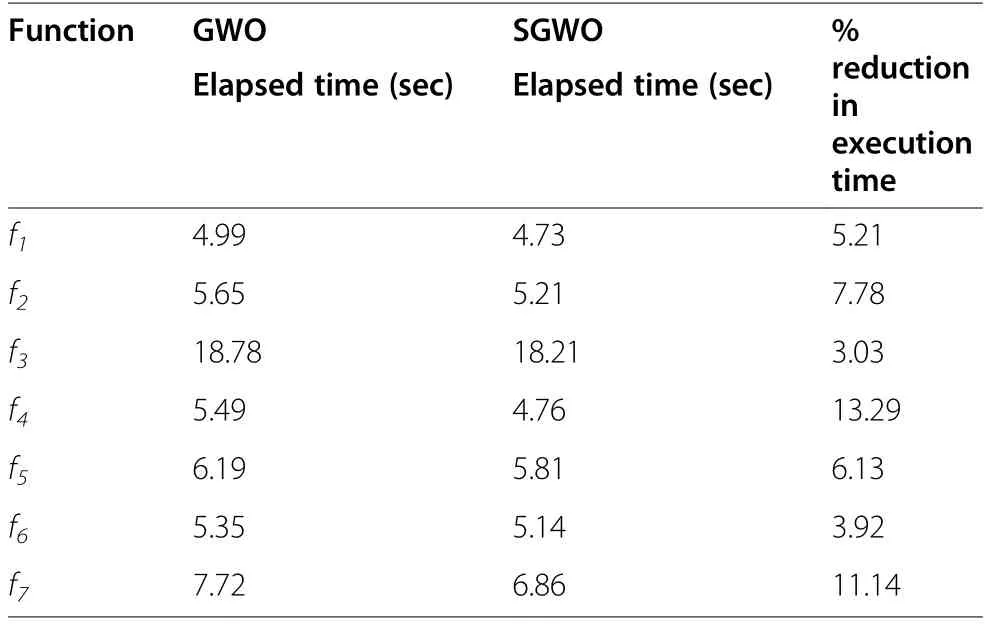
Table 4 Comparison of computational time between GWO and SGWO for unimodal functions

Table 5 Comparison of computational time between GWO and SGWO for multimodal functions
The outcomes of fixed dimension functions are listed in Table 3,which clearly shows that the proposed SGWO technique outperforms GWO, GSA, PSO and SCA for 4(f14, f16, f17, f19) out of 6 fixed dimension test functions.For the remaining two benchmark functions, SGWO provides a more desirable outcome than GWO, GSA,and SCA for f14.
The percentage of improvements in execution time are shown in Table 6 and Fig.8 from which it is evident that the SGWO technique offers the remaining two benchmark functions.The SGWO provides more desirable outcome than GWO, GSA, and SCA for f14.The percentage of improvements in execution time are reported in Table 6 as well as being shown in Fig.8 from which it is clear that the SGWO technique offers better results with reduced implementation time.
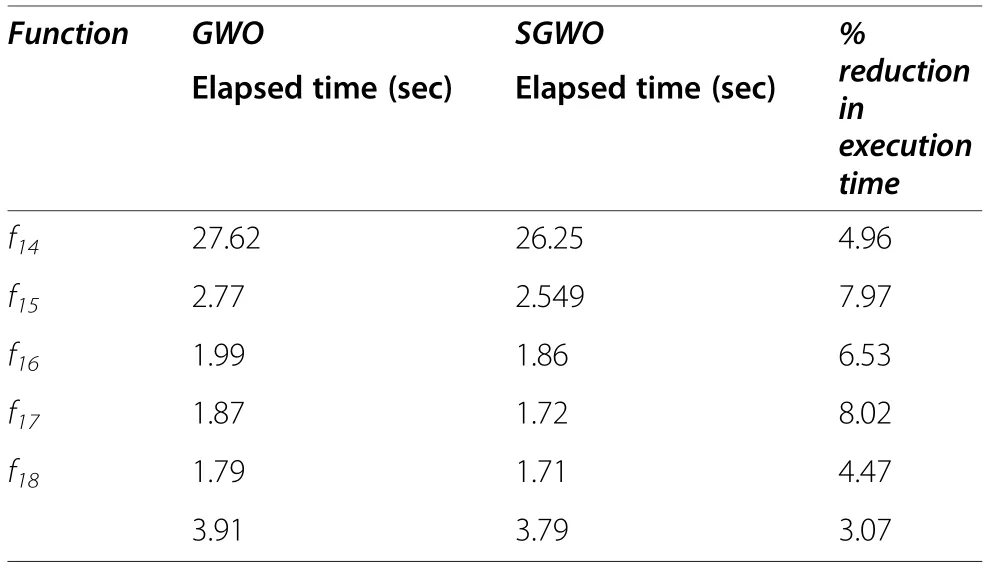
Table 6 Comparison of computational time between GWO and SGWO for fixed-dimension test functions
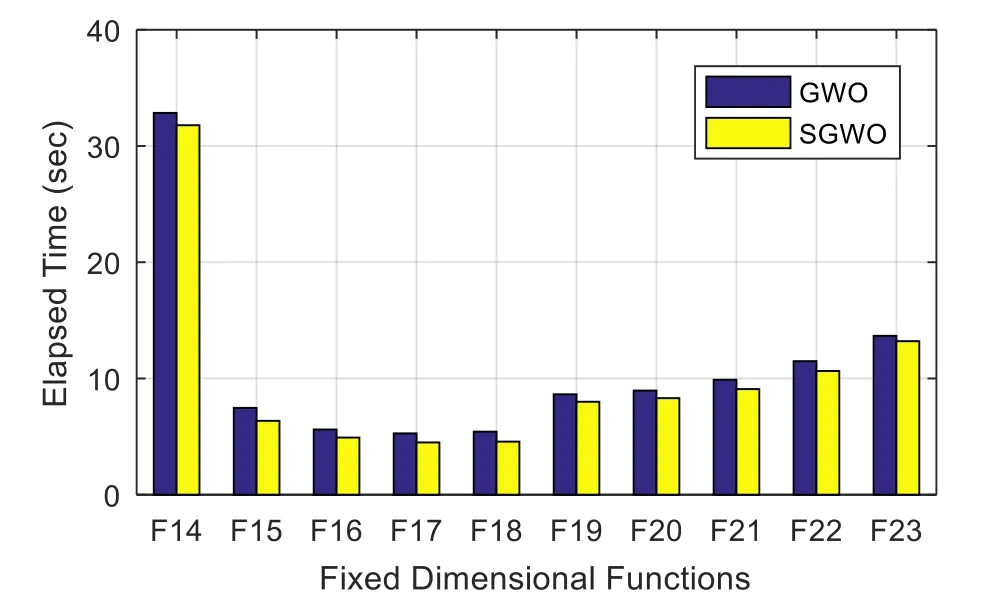
Fig.8 Fixed dimension function’s execution time
After comparing with different algorithms for unimodal, multimodal and fixed bench mark functions the algorithm is applied to a real engineering problem.The load demand (PD) is varied as shown in Fig.9 (a).The renewable powers are expressed by(2)–(4) taken from [17] as revealed in Fig.9 (b) and(c) is applied for real engineering problem which includes distributed power generation system and a two-area test system.Study is preformed with PID and AFPID controllers separately.The rule base for AFPID controller is shown in Table 7.The parameters of the suggested controllers are determined using the SGWO approach.

Fig.9 Independent load/sources a PD b PWTG c PPV

Table 7 Fuzzy rule base for AFPID
The DPGS frequency is affected by the irregular change of output powers of the PV and WTG, and needs to be controlled by a suitable act of the controllers.Table 8 provides the optimized parameters of the SGWO optimized PID and GWO optimized PID/AFPID.It can be seen that the J value attained with the execution of the GWO method for the PID controller is 11.95 which is reduced to 10.99 with the SGWO technique.Hence, it proves that the proposed SGWO method provides enhanced results compared to the original GWO technique for tuning the controllers.The suggested AFPID controller further reduces the J value to 7.774 which shows the dominance of the AFPID over the PID.Here, the SGWO method also gives better results than GWO.

Table 8 SGWO and GWO tuned PID and AFPID parameters

Table 9 Percentage change in J value under sensitivity analysis
To assess the time-domain response, different cases are tested.In the first case, exclusive change in the load as exposed in Fig.9 (a) is considered while the solar and wind generations are fixed.For the second case, variations in wind generation and load are introduced as demonstrated in Fig.9(a) and (b), while solar generation is kept constant.In the third case, all three PPV, PWTG,and PDare varied as shown in Fig.9.Lastly, robustness investigation is performed to assess the effectiveness of the proposed approach with varied system parameters.
4.1.1 Case1
4.1.1.1 Fluctuation in load with fixed solar and wind power
This case shows a change in PDas shown in Fig.9 (a)with fixed PPVand PWTGof 0.1 p.u and 0.3 p.u, respectively.From the total generation,0.16 p.u power is fed tothe AE to produce hydrogen gas for the fuel cell which produces a small amount of 0.0002 p.u Thus, the total generation which can cater to the demand is 0.24 p.u(As PG=PPV+PWTG+PFC-PAE).Between 50 and 100 s the total demand is 0.6 p.u as shown in Fig.9 (a).As the demand exceeds the generation, the power imbalance of 0.35 p.u is provided by the storage units of FESS, BESS,DEG, and EV.FESS and BESS providing 0.0035 p.u and 0.001pu as demonstrated in Fig.10 (c) and (d), respectively.DEG is also connected to the system to provide 0.009 p.u power while an influential role is played by the EV in supplying the power to the system amounting to 0.34 p.u, shown in Fig.10 (e) and (f), respectively.The total power from all this storage is around 0.35 p.u this matches the power required by the system &, the frequency is maintained.
During 100–180 s, the PDis 0.5 p.u, the renewable power after use for AE is 0.24p.u,and the fuel cell generates 0.00035 p.u and the DEG 0.006 p.u.Thus,the total generated power by adding the power of PV,WTG, DEG, and FC is 0.24635 p.u.The deficient power is nearly 0.25365 p.u and has to be provided by FESS, BESS, and EV.The major part of the deficient power is supplied by the EV which is 0.25 p.u while FESS releases 0.0028 p.u and BESS 0.004 p.u.It can similarly analyzed for the time interval of 180–230 s and 230–300 s.
The frequency deviations and control signals for Case 1 are illustrated in Fig.10 (a) and (b) from which it is clear that the effectiveness of the AFPID is superior to that of PID.The J value given by (15) with the SGWO optimized AFPID controller is 10.963 which is less than the 12.621 obtained with the SGWO optimized PID controller.Figure 10 (c)-(f) show the output powers of the different elements of the DPGS system.It can be observed that there is a noteworthy enhancement by the AFPID as the power variation is less with the AFPID controller than with the PID controller.

Fig.10 System performance for case 1 a ΔF b Δu c PFESS d PBESS e PDEG f PEV
4.1.2 Case 2
4.1.2.1 Fluctuation in load and wind power having fixed solar generation In case 2, the PDand PWTGare varied as shown in Fig.9(a) and (b) while the PPVis assumed constant at 0.1 p.u.For the period of 50–100 s, wind power generation is 0.4 p.u while the AE takes a power of 0.2 p.u.As a result, the power available to meet the demand is 0.3 p.u, while the demand power is 0.6 p.u during 50–100 s as shown in Fig.9 (a).Thus, the system needs extra powers are 0.3 p.u to maintain an equilibrium between generated and demanded power.Figure 11 (c) and (d) show that FESS and BESS supply (shown as negative) powers of 0.003 p.u and 0.009 p.u, respectively.Power supplied by the DEG is 0.009 p.u and EV is 0.28 p.u as demonstrated in Fig.11 (e) and (f), respectively.During 100–200 s, the load changes from 0.6 p.u to 0.5 p.u but the wind remains unchanged.To better visualize the impact the time interval of 200–230 s investigated during which there are variations in both load and wind.The demand power is 0.7 p.u, wind power generation is 0.2 p.u and PV generation remains at 0.1 p.u.

Fig.11 System performance for case 2 a ΔF b Δu c PFESS d PBESS e PDEG f PEV
The total net renewable power including the power consumed by the AE is 0.18 p.u in this time period,leading to a deficient power of 0.52 p.u which is catered for by the storage elements.Thus, PFESS=0.005 p.u, PBESS=0.015 p.u, PDEG=0.0015 p.u and PEV=0.5 p.u so the total power from the storage units is 0.5215 p.u.Figure 11 (a) displays the frequency variations of the system with both controllers and it is found to be less in the case of AFPID in comparison to the PID controller.The objective function value is decreased to 9.3074 with the proposed SGWO tuned AFPID compared to SGWO optimized PID value of 11.477.The power outputs of BESS, FESS, DEG, and EV are shown in Fig.11 (c)-(f)and the claimed AFPID controller’s better performance in terms of delivering improved system response compared to PID controller can be noted.
4.1.3 Case 3
4.1.3.1 Concurrent fluctuation of load solar and wind power
This is the case in which all the fluctuations are taken into consideration as given in Fig.9(a) –(d).The results are shown in Fig.12.

Fig.12 System performance for case 3 a ΔF b Δ u c PFESS d PBESS e PDEG f PEV
At t=50 s, it can be observed from Fig.9 (a)-(c) that the demand power is 0.6 p.u, the wind power generation is0.4 p.u, and PV cell generation is 0.2 p.u.AE consumes 0.24p.u from the renewable generation while the fuel cell produces 0.000097 p.u power.The DEG is also connected to the system at t=50 s to meet the demand and supplies a power of 0.0072 p.u as shown in 12 (e).The total generation less the AE power is thus 0.36729p.u which is 0.23p.u less than the demand.Therefore, the storage units BESS, FESS, and EV provide the deficient power to meet the demand power, i.e., PFESS=0.0075p.u,PBESS=0.0022p.u, PPEV=0.23p.u as displayed in Fig.12(c), (d) (f), respectively.So the total supply power is 0.6070 p.u which matches the demand and the system frequency is stable.
At t=100 s the PDis 0.5 p.u, the PWTGis 0.4 p.u and PPVis 0.49 p.u as can be seen from Fig.9(a) to (c).PAEand PFCare 0.356p.u and 0.0014p.u, respectively.As the generation is more than the load the DEG is disconnected, while the storage units FESS and BESS consume 0.0008 p.u and 0.00049 p.u from the system,respectively.EV charges during this period and the power taken is 0.008677 p.u which can be clearly seen from Fig.12 (e).Thus, the total supplied power is Prenewable-PAE+PFC+PDEG-(PFESS+PBESS+PEV)=0.5254p.u which matches the demand power.
Att=230 s, the generation from the renewable sources is 0.4 p.u which is significantly lower than PDof 0.9 p.u,as can be visualized from Fig.9 (a)-(c).As PAE=0.16p.u,PFC=0.000066p.u, and PDEG=0.0019p.u,EV provides most of the power which amounts to 0.64 p.u as seen in Fig.12 (e) while FESS delivers 0.00072p.u and BESS releases 0.0225 p.u.Thus, the total supply power is 0.905p.u which matches the demand power.Similarly, it can be claimed that with PID and AFPID controllers the power balance is maintained at every instant of time to make the system stable.
In case 3, the objective function values with PID and AFPID controller are 10.99 and 7.774, respectively.In all the three cases it is found that SGWO optimized AFPID controller conforms improved system response compared to SGWO optimized PID controller.
4.1.4 Case 4
4.1.4.1 Sensitivity analysis
The AFPID controller’s flexible nature can be authenticated by considering variability in the variables of the heterogeneous DGPS, such as during unexpected operations due to peculiar changes in environmental conditions.With variations of the power system variables such as KFESS, TFESS, KBESS, TBESS, M, and D, an alteration in the objective function value (J) will be obtained.The percentage change in J due to the changes in power system variables are compiled in Table 9.
A detailed examination of the outcomes presented in Table 9 shows the advantage of using the AFPID controller in the DPGS system for frequency regulation with noteworthy disparities in the system parameters.Among different parameters of the DPGS system, it is noted that the variations are smaller than 10% for all cases, as shown in Table 9.The flexibility of the proposed SGWO- tuned AFPID for frequency regulation is confirmed in the DPGS system with significant variations in the power system parameters.

Table 10 Performance table for a two-area thermal power system at ΔPD1=0.05puMW(5%SLP)
4.1.5 Case 5
4.1.5.1 Effect of uncertainty
For a linear control problem, PID structures are comparatively easy to design and are extensively used.However, the effectiveness of a PID controller may decrease when uncertainty is considered.To demonstrate the dominance of the suggested AFPID, the effectiveness of the AFPID is compared with the PID in various severe situations as presented below:
Scenario A: Solar and wind powers are not available while EV power and load demand are increased by 40%.
Scenario B:System inertia constant M is reduced by 50%
Scenario C: System inertia constant M and damping constant D are both reduced by 50%.
Scenario D: Time delay is increased by 150 ms.
Scenario E: EV demand is increased by 50%.
The system frequency deviations for the above scenarios are shown in Fig.13 (a)-(e).It can be noted that, for all the above scenarios, the frequency oscillates and the system loses its stability with the PID.In contrast, system stability is maintained with the proposed AFPID controller and frequency variations lie within thetolerance of±0.5 Hz.It is also noted from Fig.13 (e)that when uncertainty in EV demand is considered, the response with the proposed AFPID is better than the PID controller.

Fig.13 a-e Various Scenarios to show the effect of uncertainty
4.1.6 Case 6
4.1.6.1 Comparison with recent AGC technique
To demonstrate the advantage of the proposed frequency control approach, it is applied to an extensively employed two-area power system [22, 32, 35, 36].Two similar AFPID controllers are used in each area.
A sudden disturbance of 5% is induced in area 1 at t=0 s.The SGWO method is used to tune the parameters of the AFPID controller, and its effectiveness is contrasted with some modern optimization techniques such as PSO tuned FPI [32], TLBO tuned PID [22], JA tuned PIDN [37], hPSO-PS tuned FPI [32], BFOA & GA tuned PI [35], and hBFOA-PSO tuned PI [36], and the outcomes are presented in Table 10.The SGWO tuned AFPID parameters are:

Table 10 shows that the lowest ITAE value is attained with the modified SGWO- tuned AFPID i.e.lower than the newly proposed frequency control methods.The system responses given in Fig.14 show that SGWO-tuned AFPID outclasses other automatic generation control methods.
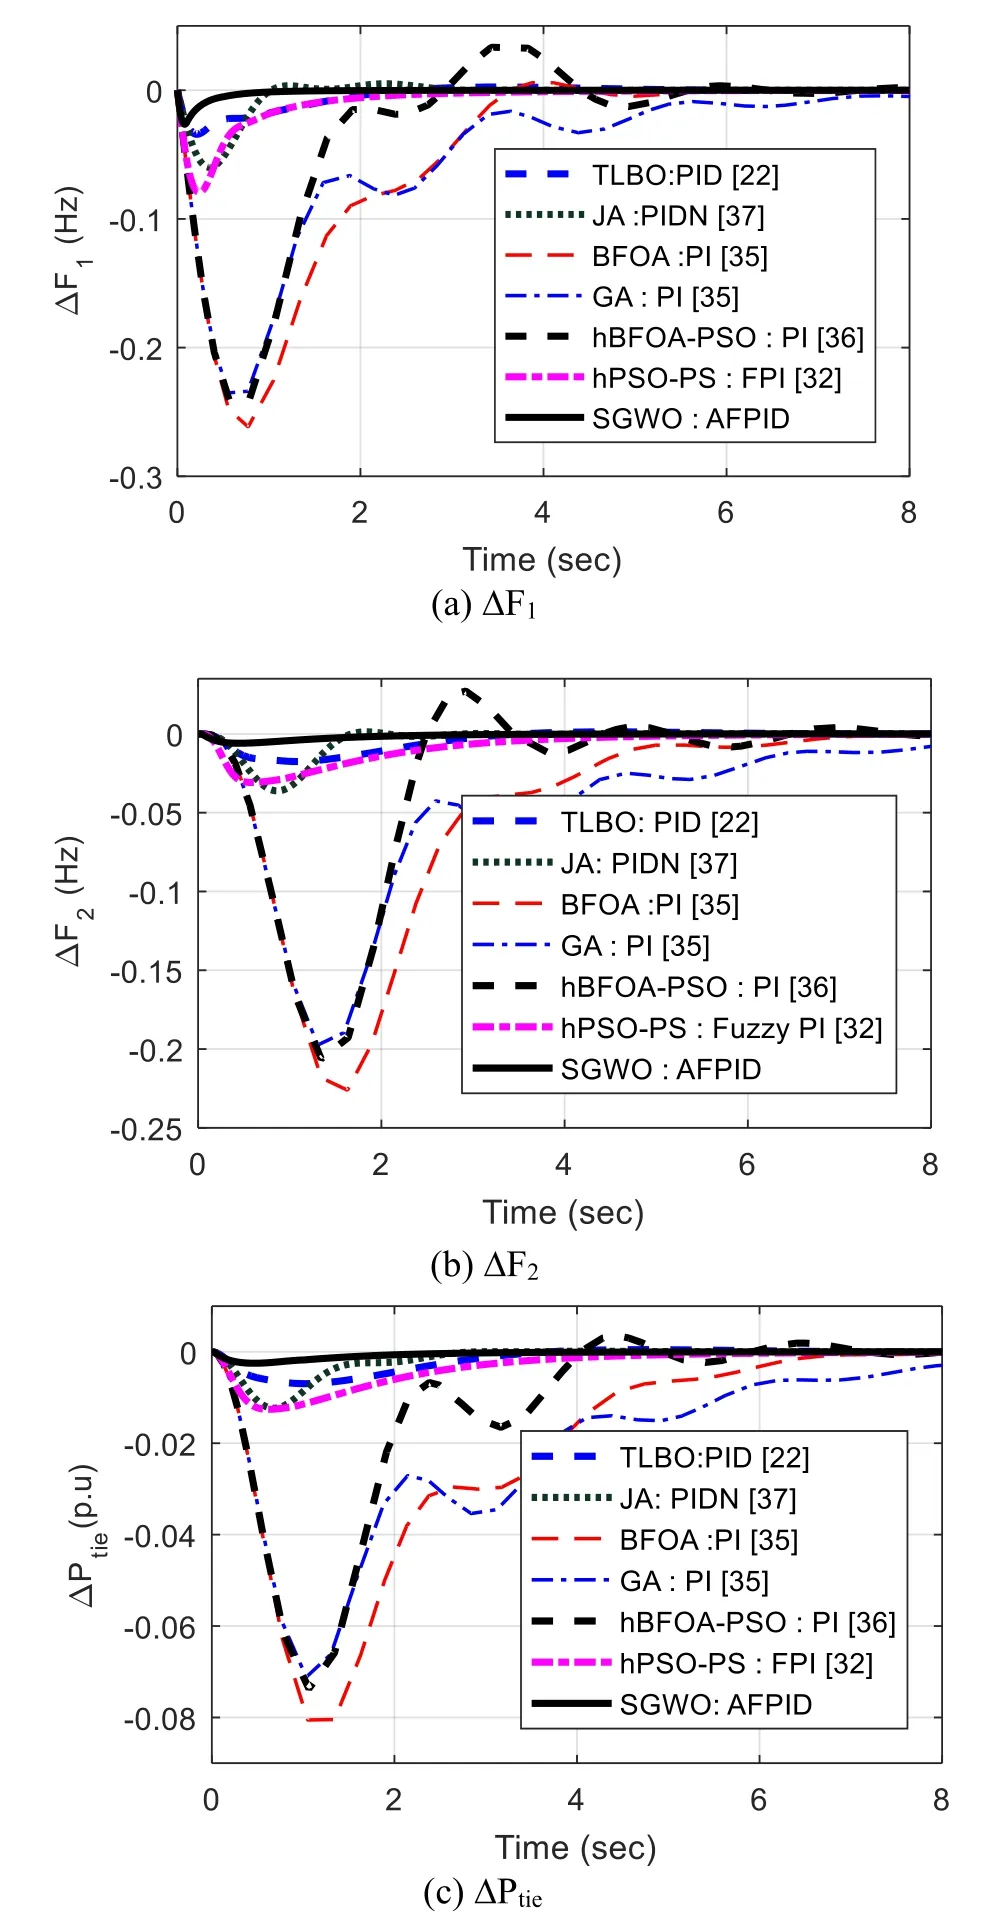
Fig.14 System frequency deviation response for two test system a ΔF1 b ΔF2 c ΔPtie
5 Conclusion
A Simplified Grey Wolf Optimization (SGWO) algorithm is adopted in this study for the adaptive fuzzy PID controller design for frequency control of a Distributed Power Generation System (DPGS).The proposed SGWO technique is first tested for various unimodal,multi-modal, and fixed dimension functions and values are compared with the original GWO as well as PSO,GSA, and SCA.It is noted that the SGWO method offers better results than the original GWO in almost all test functions with reduced computational time.
The proposed SGWO method is then used to optimize an AFPID controller for frequency control of the DPGS system.Different nonlinearities such as rate constraints and time delays are included in the system.It is noted that SGWO based AFPID is superior to the conventional PID for frequency regulation under various scenarios.A sensitivity study is also performed to observe the consequence of uncertainties in the system parameters and it is seen that the system performance is satisfactory.The SGWO algorithm is also applied to determine the parameters of the AFPID in a widely used two-area power system and the results obtained demonstrate that the SGWO algorithm-tuned AFPID controller offers a better response than some recently proposed approaches.
6 Nomenclature
DPGS: Distributed Power Generation System
PV: Solar Photovoltaic
WTG: Wind Turbine Generator
AE: Aqua Electrolyser
FC: Fuel Cell
DEG: Diesel Engine Generator
FESS: Flywheel Energy Storage System
BESS: Battery Energy Storage System
PEV: Plug in Electric Vehicle
PPV: Power output of PV
PWTG:Power output of WTG
PD: Load Demand
PFC: Power output of Fuel Cell
PDEG: Power output of DEG
PBESS: Power output of BESS
PFESS: Power output of FESS
GPV:Transfer Function of PV
KPV: Gain of photovoltaic
TPV: Time constant of Photovoltaic
η: Conversion Efficiency
φ:Solar Irradiation
GWTG: Transfer function of WTG
KWTG:Gain of WTG
TWTG:Time constant of WTG
GAE: Transfer Function of AE
KAE:Gain of AE
TAE:Time constant of AE
N: No of units
GFC: Transfer Function of Fuel cell
KFC: Gain of Fuel Cell
TFC: Time Constant of FC
e: Error input to FLC
GBESS: Transfer Function of BESS
KBESS: Gain of BESS
TBESS: Time constant of BESS
GFESS:Transfer function of FESS
KFESS: Gain of FESS
TFESS: Time Constant of FESS
Yα, YβYδ: Current position of α,β,and δ wolves
Sα,Sβ, Sδ:Updated position of α, β, and δ wolves
G(s): TF of dynamic power system
D: Damping Coefficient
M: Inertia Constant
LFC: Load frequency Control
ΔU: LFC signal
GWO: Grey Wolf Optimizer
SGWO:Simplified Grey Wolf Optimizer
ΔF: Frequency Deviation
ISE: Integral Square Error
FLC: Fuzzy logic Controller
NB, NS, Z: Negative Big, Negative small, Zero
PB, PS: Positive Big, Positive Small
de: Change of error input to the FLC
7 Appendix
Parameters of investigated system are [17–20].
AE: KAE=0.002, TAE=0.5 s, TFC=4.0 s, FC: KFC=0.01,PV: KPV=1.0, TPV=1.8 s, FESS: KFESS=-0.01, TFESS=0.1 s, Kn=0.6, WTG: KWTG=1.0, TWTG=1.0 s, DEG:KDEG=0.003, TDEG=2.0 s, BESS: KBESS=-0.003, TBESS=0.1 s
Acknowledgements
Authors would like to thank Veer Surendra Sai University of Technology(VSSUT) Burla for providing necessary research facilities.
Authors’ contributions
Sasmita Padhy has done the modeling of the system with different storage system and plug in electric vehicles and has analyzed their effect on the system with adaptive Fuzzy PID controller.The tuning is done by the Simplified Grey wolf optimization.The simplification is done by Prof.Sidhartha Panda and he has provided all the technical guidance to complete the paper.Both the Authors have read and approved the Final Manuscript.
Author’s information
Sasmita Padhy was born on 29th June 1980 at Ganjam Odisha, India.She obtained her B.Engg (Electrical& Electronics) from National Institute of Science and Technology (NIST)Berhampur Odisha in 2003 and M.Tech(Power System) from BPUT in 2011.Currently She is pursuing Ph.D in VSSUT,Burla and her research interest lies in Power system stability, control and computational intelligence.
Sidhartha Panda is working as a Professor in the Department of Electrical Engineering, Veer Surendrai Sai University of Technology (VSSUT), Burla,Sambalpur,Odisha, India.He received Ph.D.degree from Indian Institute of Technology (IIT), Roorkee, India, M.E.degree from Veer Surendrai Sai University of Technology (VSSUT).His areas of research include Flexible AC Transmission Systems (FACTS), Power System Stability, Soft computing,Model Order Reduction, Distributed Generation and Wind Energy.Dr.Panda is a Fellow of Institution of Engineers (India).
Funding
Not applicable.
Availability of data and materials
Data sharing not applicable to this article as no data were generated or analyzed during the study.
Competing interests
The authors declare that they have no competing interests.
杂志排行
Protection and Control of Modern Power Systems的其它文章
- A comprehensive review of DC fault protection methods in HVDC transmission systems
- A critical review of the integration of renewable energy sources with various technologies
- Operational optimization of a building-level integrated energy system considering additional potential benefits of energy storage
- An integrated multi-energy flow calculation method for electricity-gas-thermal integrated energy systems
- Sliding mode controller design for frequency regulation in an interconnected power system
- Impact of communication time delays on combined LFC and AVR of a multi-area hybrid system with IPFC-RFBs coordinated control strategy
