Joint Initiative on Backbone Enterprises in Chinese Copper Smelting Advancing High-quality Development
2021-08-13
Joint Initiative on Backbone Enterprises in Chinese Copper Smelting Advancing High-quality Development
For the purpose of deeply implementing important measures deployed in “Opinions from CPC Central Committee on The 14th Five-Year Plan of National Economic and Social Development and Vision for The Year of 2035”, actively coping with impacts and challenges imposed on China’s copper smelting industry by the variations in external development environment, improving development quality and international competitiveness of copper smelting enterprises and enhancing anti-risk capability for steady and long-term advancements, in late April, leaders or principal persons in charge from 15 backbone copper smelting enterprises (list attached as appendix) combined actual industrial operation and conducted sufficient analysis so that a consensus closely relating to driving high-quality development has been reached:
China’s copper smelting industry must make advancements centering on quality development. Copper smelting industry must unswervingly carry out new development philosophy and promote coordinated development of upstream and downstream industries sticking to the principal line of deepening supply-side structural reform.
China’s copper smelting industry is required to shape a new development pattern that is based on domestic general circulation and featured by dual circulation home and abroad supporting each other. Copper smelting industry is supposed to improve adaptability of supply system, eliminate clogging point in copper industry circulation, and upgrade integrity of supply chain so as to make domestic market the main source of supply to final demands, thus forming a dynamic balance of higher level that is featured by demands driving supplying and supplying promoting demands.
Participating enterprises will actively be devoted to reform of global copper industry governance system. They will promote the construction of a global copper industry cooperation system that is fairer and more rational, especially raw material inspection and arbitration justice, based on equal consultation and mutual benefits. A community of shared future is earnestly being established for copper industry worldwide.
In order to actively respond to the requirements of “dual carbon initiatives” proposed by the country, participating enterprises reached a consensus to accelerate the structural adjustment in copper smelting raw material, enhance the utility of blister copper and scrap copper and upgrade modernization of supply chain of copper industry.
Participating enterprises jointly call for that China’s copper smelting companies earnestly respond to Self-discipline Treaty of China’s Nonferrous Industry and this joint statement and make prompt adjustment in raw material structure.
Unit: metric ton

Name of province or cityProduction inMar. 2021Total outputJan.-Mar. 2021% Change2020-2021 Zhejiang------ Jiangxi76061559473.13 Hunan3622937380.69 Guangxi1311505-26.24 Yunnan89702600715.05 Total output China208445438937.05
Unit: metric ton

Name of provinceProduction inMar. 2021Total outputJan.-Mar. 2021% Change2020-2021 Shanxi9479285396.91 Henan2613679211.1 Shaanxi4880614689319.69 Ningxia------ Xingjiang------ Total output China7261021790017.12
Unit: metric ton
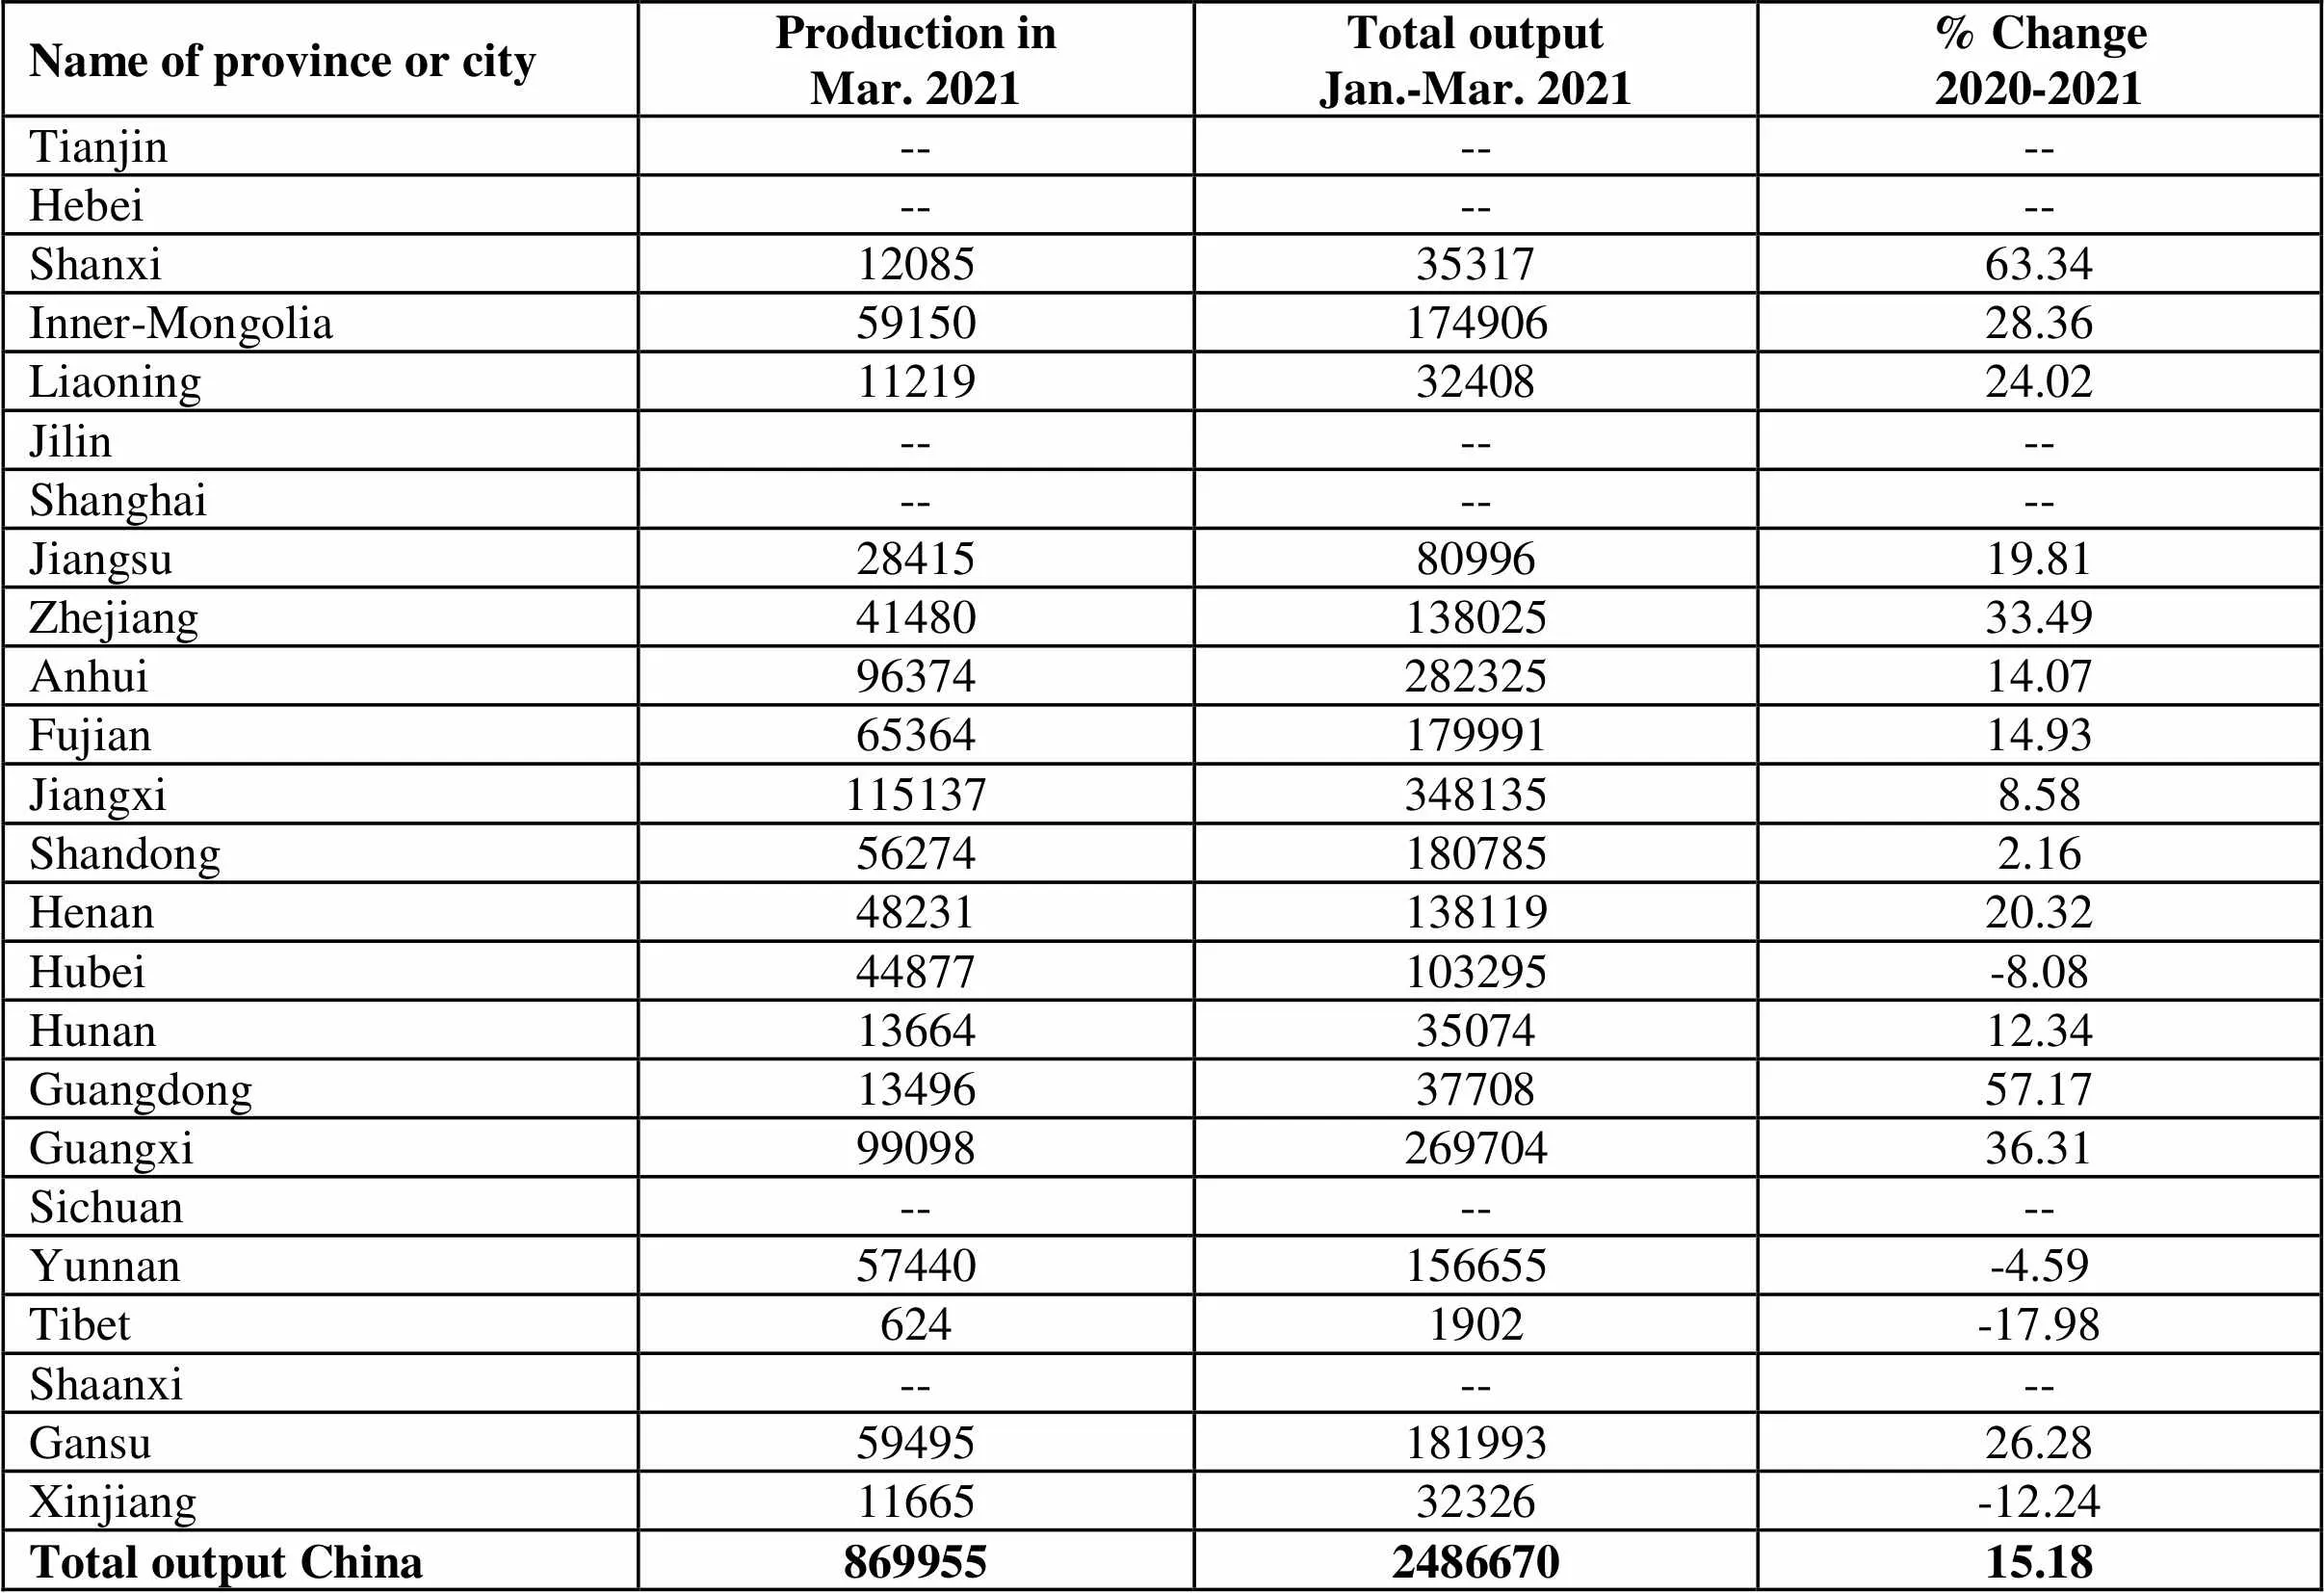
Name of province or cityProduction inMar. 2021Total outputJan.-Mar. 2021% Change2020-2021 Tianjin------ Hebei------ Shanxi120853531763.34 Inner-Mongolia5915017490628.36 Liaoning112193240824.02 Jilin------ Shanghai------ Jiangsu284158099619.81 Zhejiang4148013802533.49 Anhui9637428232514.07 Fujian6536417999114.93 Jiangxi1151373481358.58 Shandong562741807852.16 Henan4823113811920.32 Hubei44877103295-8.08 Hunan136643507412.34 Guangdong134963770857.17 Guangxi9909826970436.31 Sichuan------ Yunnan57440156655-4.59 Tibet6241902-17.98 Shaanxi------ Gansu5949518199326.28 Xinjiang1166532326-12.24 Total output China869955248667015.18
Unit: metric ton
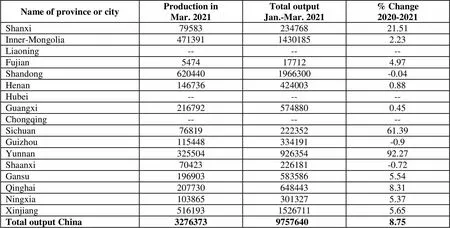
Name of province or cityProduction inMar. 2021Total outputJan.-Mar. 2021% Change2020-2021 Shanxi7958323476821.51 Inner-Mongolia47139114301852.23 Liaoning------ Fujian5474177124.97 Shandong6204401966300-0.04 Henan1467364240030.88 Hubei------ Guangxi2167925748800.45 Chongqing------ Sichuan7681922235261.39 Guizhou115448334191-0.9 Yunnan32550492635492.27 Shaanxi70423226181-0.72 Gansu1969035835865.54 Qinghai2077306484438.31 Ningxia1038653013275.37 Xinjiang51619315267115.65 Total output China327637397576408.75
Unit: metric ton

Name of province Production inMar. 2021Total outputJan.-Mar. 2021% Change2020-2021 Shanxi158384646615688.78 Inner-Mongolia------ Shandong228293870375287.55 Henan926185277176724.25 Guangxi990376268865729.44 Chongqing130565295032-6.78 Sichuan------ Guizhou444180126672919.96 Yunnan------ Total output China65366061922992513.71
Unit: metric ton

Name of province or cityProduction inMar. 2021Total outputJan.-Mar. 2021% Change2020-2021 Liaoning------ Jiangxi1201326374.67 Henan------ Hubei------ Guangdong------ Guangxi------ Shaanxi------ Gansu12187372183.29 Xinjiang1022307619.27 Total output China244076932721.1
Unit: metric ton

Name of metalProduction inMar. 2021Total outputJan.-Mar. 2021% Change2020-2021 Copper869955248667015.18 Aluminium327637397576408.75 Lead634510173974229.02 Zinc54963316280096.35 Nickel244076932721.1 Tin208445438937.05 Antimony210735524725.87 Mercury7261021790017.12 Magnesium131013788027.44 Titanium113314-35.75 Total China54826201604711811.69
Unit: metric ton
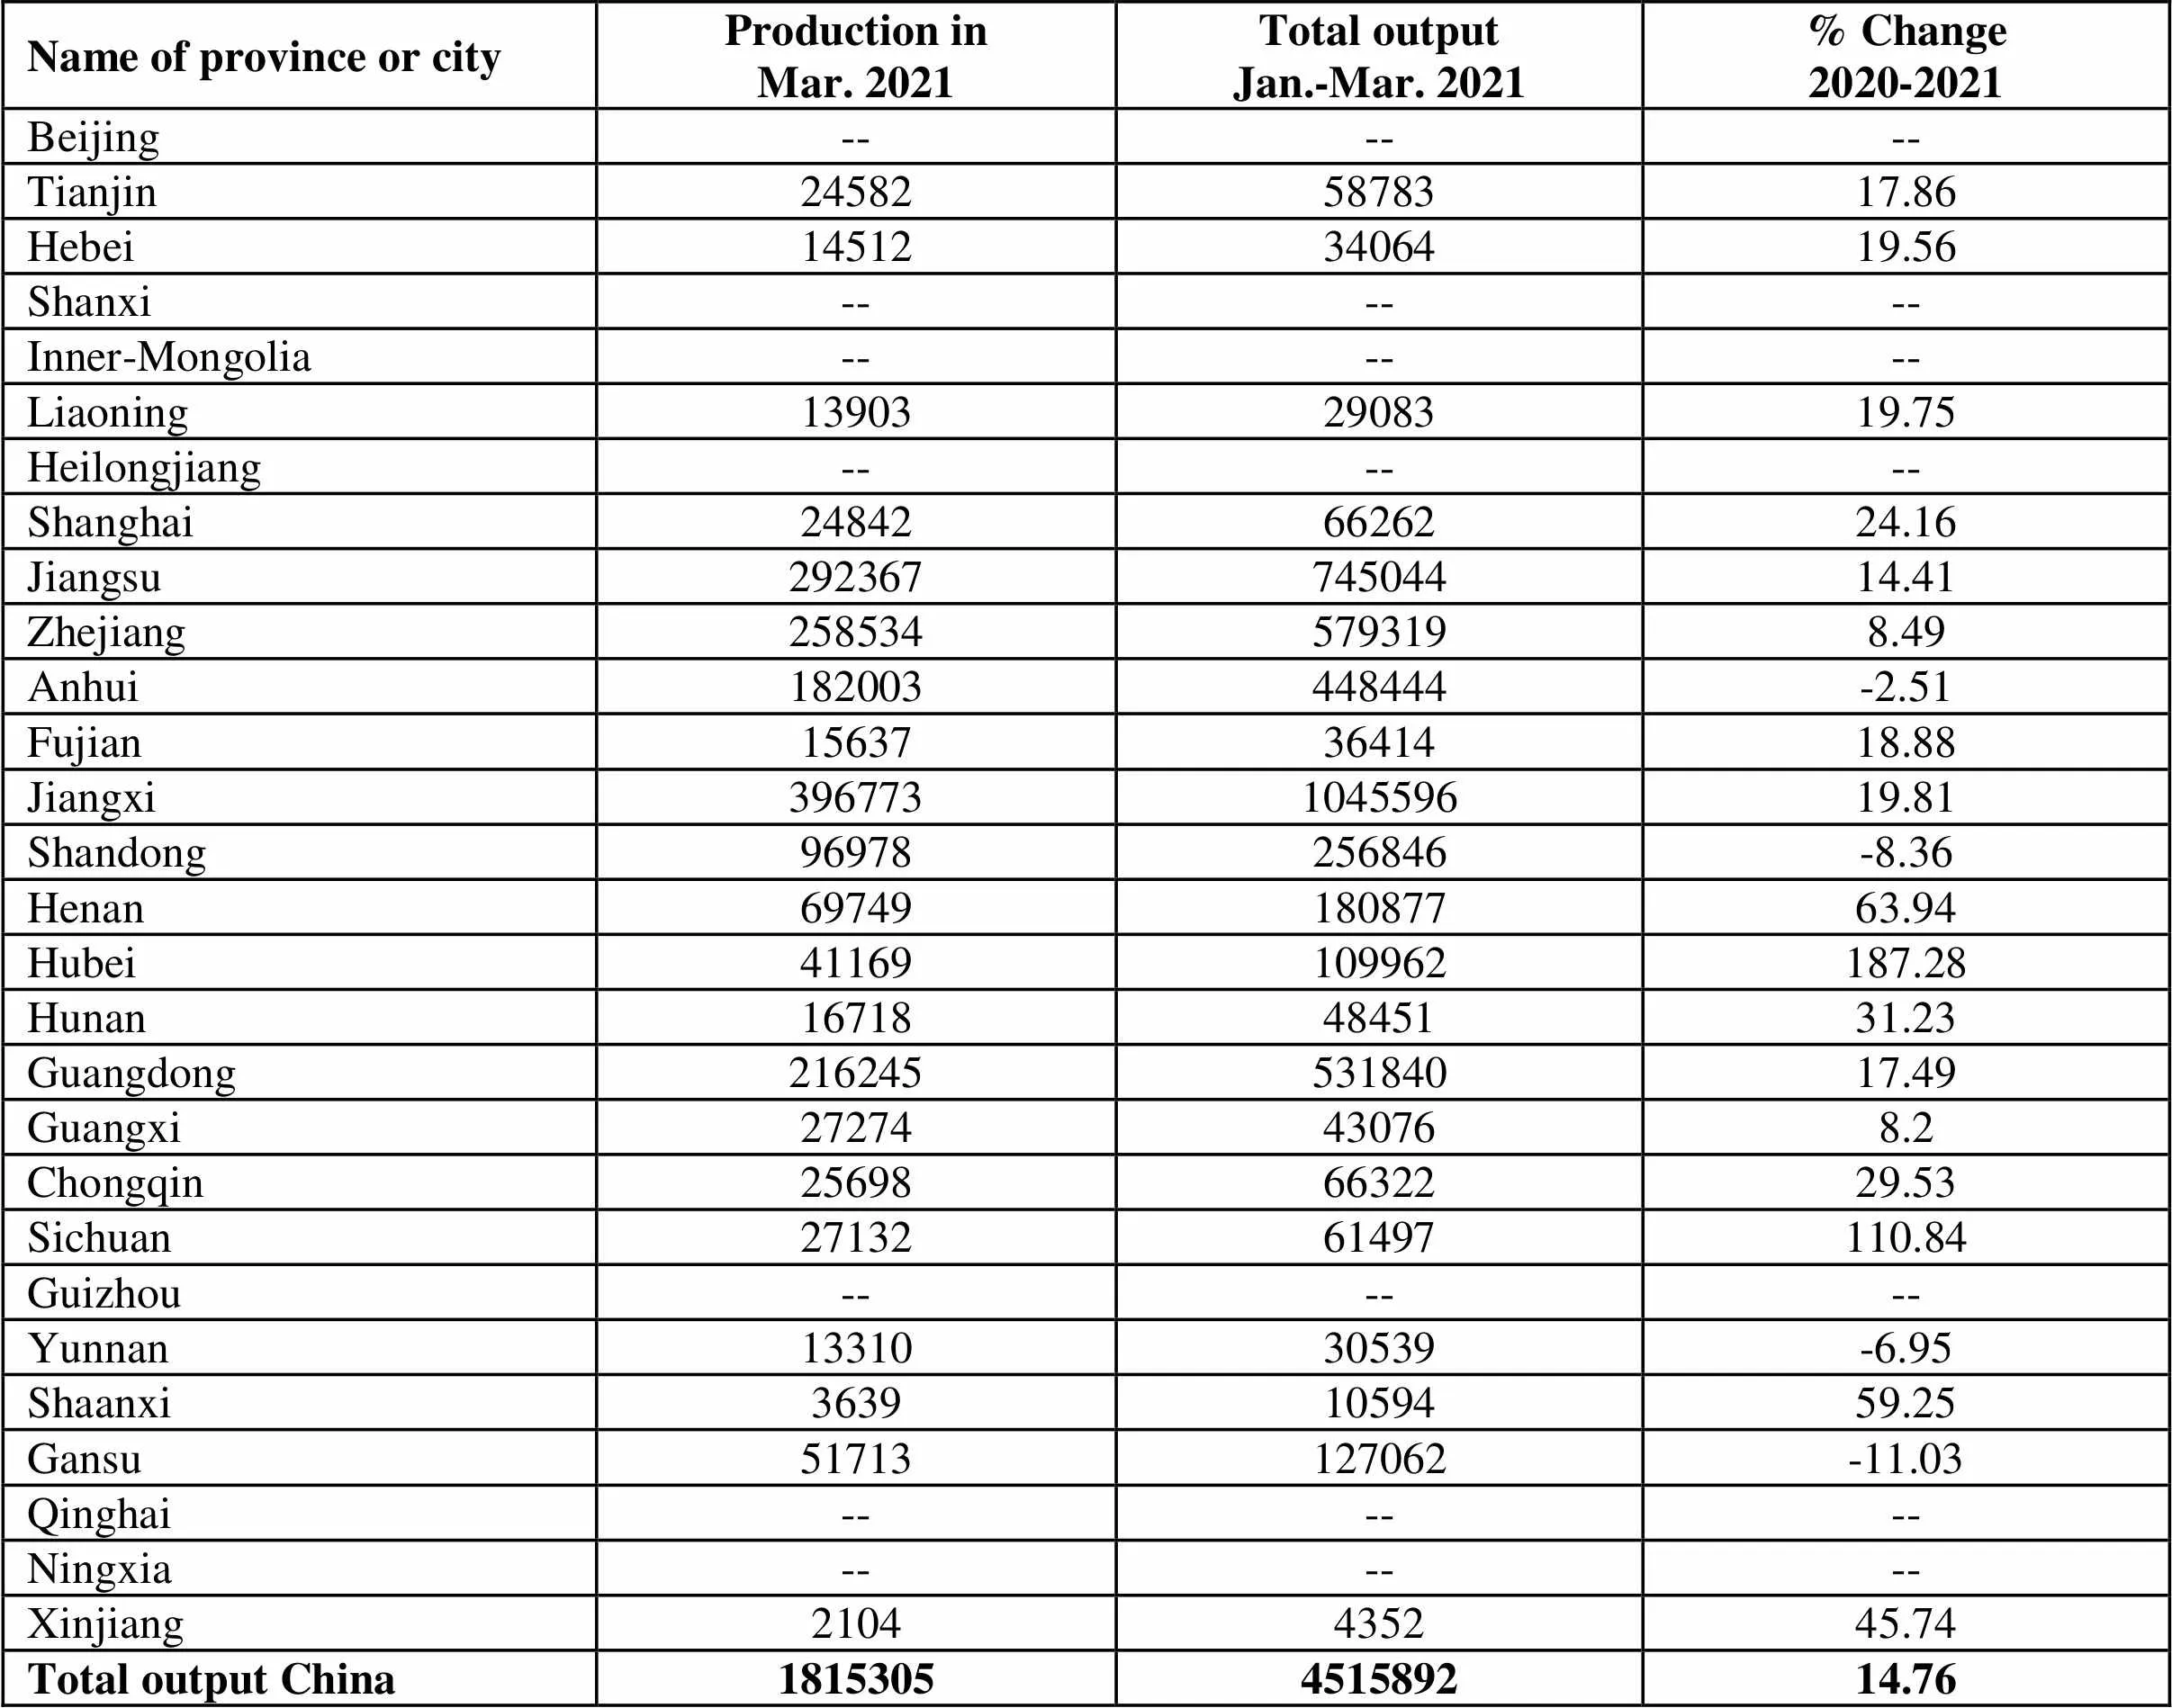
Name of province or cityProduction inMar. 2021Total outputJan.-Mar. 2021% Change2020-2021 Beijing------ Tianjin245825878317.86 Hebei145123406419.56 Shanxi------ Inner-Mongolia------ Liaoning139032908319.75 Heilongjiang------ Shanghai248426626224.16 Jiangsu29236774504414.41 Zhejiang2585345793198.49 Anhui182003448444-2.51 Fujian156373641418.88 Jiangxi396773104559619.81 Shandong96978256846-8.36 Henan6974918087763.94 Hubei41169109962187.28 Hunan167184845131.23 Guangdong21624553184017.49 Guangxi27274430768.2 Chongqin256986632229.53 Sichuan2713261497110.84 Guizhou------ Yunnan1331030539-6.95 Shaanxi36391059459.25 Gansu51713127062-11.03 Qinghai------ Ningxia------ Xinjiang2104435245.74 Total output China1815305451589214.76
Unit: metric ton
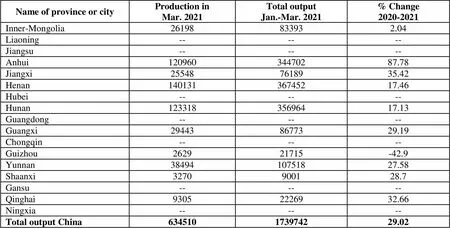
Name of province or cityProduction inMar. 2021Total outputJan.-Mar. 2021% Change2020-2021 Inner-Mongolia 26198833932.04 Liaoning------ Jiangsu------ Anhui12096034470287.78 Jiangxi255487618935.42 Henan14013136745217.46 Hubei------ Hunan12331835696417.13 Guangdong------ Guangxi294438677329.19 Chongqin------ Guizhou262921715-42.9 Yunnan3849410751827.58 Shaanxi3270900128.7 Gansu------ Qinghai93052226932.66 Ningxia------ Total output China634510173974229.02
Unit: metric ton(metal content)
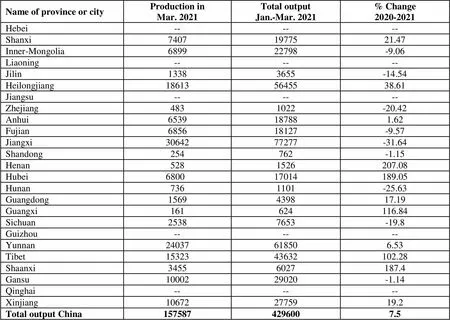
Name of province or cityProduction inMar. 2021Total outputJan.-Mar. 2021% Change2020-2021 Hebei------ Shanxi74071977521.47 Inner-Mongolia689922798-9.06 Liaoning------ Jilin13383655-14.54 Heilongjiang186135645538.61 Jiangsu------ Zhejiang4831022-20.42 Anhui6539187881.62 Fujian685618127-9.57 Jiangxi3064277277-31.64 Shandong254762-1.15 Henan5281526207.08 Hubei680017014189.05 Hunan7361101-25.63 Guangdong1569439817.19 Guangxi161624116.84 Sichuan25387653-19.8 Guizhou------ Yunnan24037618506.53 Tibet1532343632102.28 Shaanxi34556027187.4 Gansu1000229020-1.14 Qinghai------ Xinjiang106722775919.2 Total output China1575874296007.5
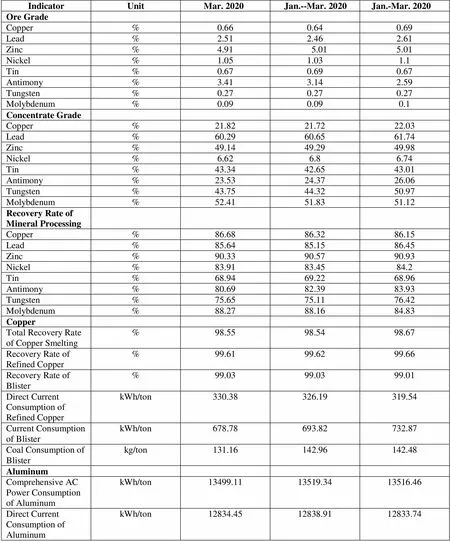
IndicatorUnitMar. 2020Jan.--Mar. 2020 Jan.-Mar. 2020 Ore Grade Copper%0.660.640.69 Lead%2.512.462.61 Zinc%4.915.015.01 Nickel%1.051.031.1 Tin%0.670.690.67 Antimony%3.413.142.59 Tungsten%0.270.270.27 Molybdenum%0.090.090.1 Concentrate Grade Copper%21.8221.7222.03 Lead%60.2960.6561.74 Zinc%49.1449.2949.98 Nickel%6.626.86.74 Tin%43.3442.6543.01 Antimony%23.5324.3726.06 Tungsten%43.7544.3250.97 Molybdenum%52.4151.8351.12 Recovery Rate of Mineral Processing Copper%86.6886.3286.15 Lead%85.6485.1586.45 Zinc%90.3390.5790.93 Nickel%83.9183.4584.2 Tin%68.9469.2268.96 Antimony%80.6982.3983.93 Tungsten%75.6575.1176.42 Molybdenum%88.2788.1684.83 Copper Total Recovery Rate of Copper Smelting%98.5598.5498.67 Recovery Rate of Refined Copper%99.6199.6299.66 Recovery Rate of Blister%99.0399.0399.01 Direct Current Consumption of Refined CopperkWh/ton330.38326.19319.54 Current Consumption of BlisterkWh/ton678.78693.82732.87 Coal Consumption of Blisterkg/ton131.16142.96142.48 Aluminum Comprehensive AC Power Consumption of AluminumkWh/ton13499.1113519.3413516.46 Direct Current Consumption of AluminumkWh/ton12834.4512838.9112833.74
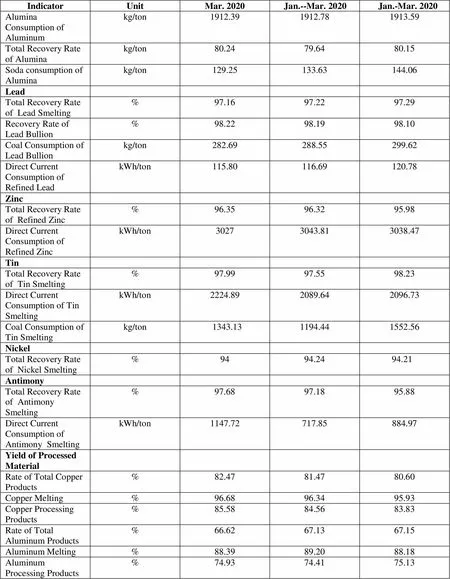
IndicatorUnitMar. 2020Jan.--Mar. 2020 Jan.-Mar. 2020 Alumina Consumption of Aluminumkg/ton1912.391912.781913.59 Total Recovery Rate of Aluminakg/ton80.2479.6480.15 Soda consumption of Aluminakg/ton129.25133.63144.06 Lead Total Recovery Rate of Lead Smelting%97.1697.2297.29 Recovery Rate of Lead Bullion%98.2298.1998.10 Coal Consumption of Lead Bullionkg/ton282.69288.55299.62 Direct Current Consumption of Refined LeadkWh/ton115.80116.69120.78 Zinc Total Recovery Rate of Refined Zinc%96.3596.3295.98 Direct Current Consumption of Refined ZinckWh/ton30273043.813038.47 Tin Total Recovery Rate of Tin Smelting%97.9997.5598.23 Direct Current Consumption of Tin SmeltingkWh/ton2224.892089.642096.73 Coal Consumption of Tin Smeltingkg/ton1343.131194.441552.56 Nickel Total Recovery Rate of Nickel Smelting%9494.2494.21 Antimony Total Recovery Rate of Antimony Smelting%97.6897.1895.88 Direct Current Consumption of Antimony SmeltingkWh/ton1147.72717.85884.97 Yield of Processed Material Rate of Total Copper Products%82.4781.4780.60 Copper Melting %96.6896.3495.93 Copper Processing Products%85.5884.5683.83 Rate of Total Aluminum Products%66.6267.1367.15 Aluminum Melting%88.3989.2088.18 Aluminum Processing Products%74.9374.4175.13
Unit: metric ton
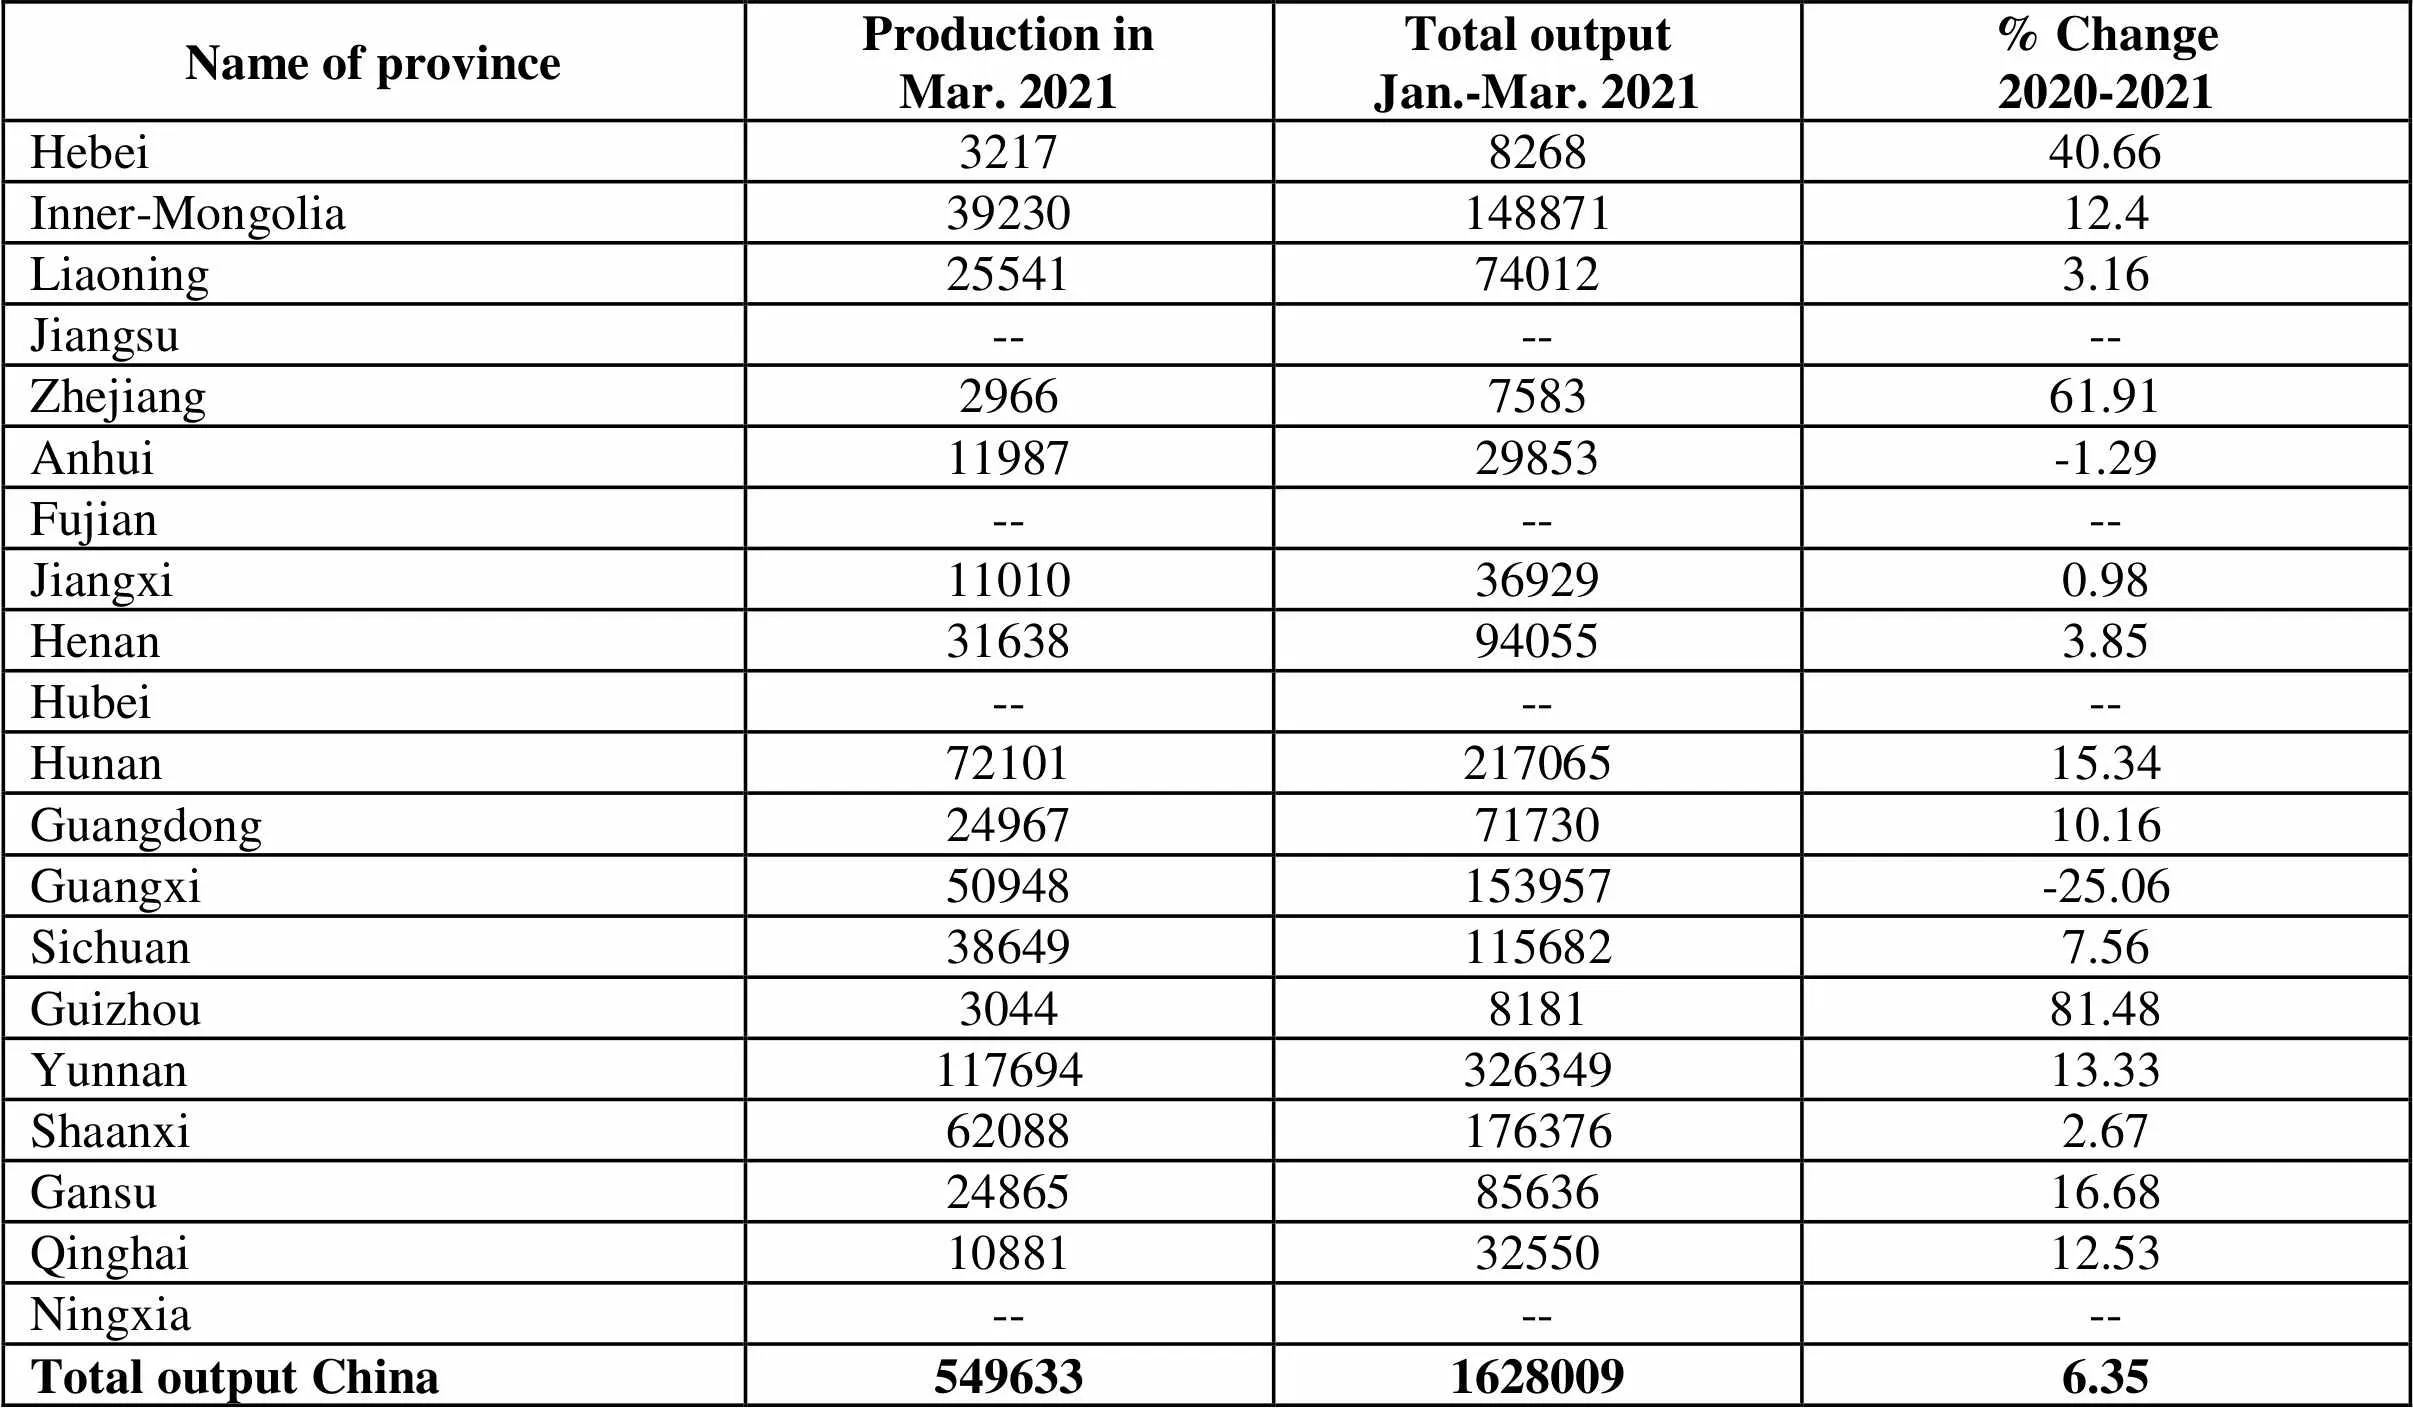
Name of provinceProduction inMar. 2021Total outputJan.-Mar. 2021% Change2020-2021 Hebei3217826840.66 Inner-Mongolia3923014887112.4 Liaoning25541740123.16 Jiangsu------ Zhejiang2966758361.91 Anhui1198729853-1.29 Fujian------ Jiangxi11010369290.98 Henan31638940553.85 Hubei------ Hunan7210121706515.34 Guangdong249677173010.16 Guangxi50948153957-25.06 Sichuan386491156827.56 Guizhou3044818181.48 Yunnan11769432634913.33 Shaanxi620881763762.67 Gansu248658563616.68 Qinghai108813255012.53 Ningxia------ Total output China54963316280096.35
