A strategy to improve the electrochemical performance of Ni-rich positive electrodes: Na/F-co-doped LiNi0.6Mn0.2Co0.2O2*
2021-07-30HuiWan万惠ZhixiaoLiu刘智骁GuangdongLiu刘广东ShuaiyuYi易帅玉FeiGao高飞HuiqiuDeng邓辉球DingwangYuan袁定旺andWangyuHu胡望宇
Hui Wan(万惠) Zhixiao Liu(刘智骁) Guangdong Liu(刘广东)Shuaiyu Yi(易帅玉)Fei Gao(高飞) Huiqiu Deng(邓辉球) Dingwang Yuan(袁定旺) and Wangyu Hu(胡望宇)
1College of Materials Science and Engineering,Hunan University,Changsha 410082,China
2School of Physics and Electronics,Hunan University,Changsha 410082,China
3Department of Nuclear Engineering and Radiological Sciences,University of Michigan,Ann Arbor,MI 48109,USA
Keywords: Li ion batteries,ion diffusion,Na/F-co-doping,first-principles calculations
1. Introduction
Rechargeable Li ion batteries(LIBs)are the most promising energy-storage devices for portable electronic products and can solve numerous energy and environmental issues.[1-3]Advanced electrochemical energy-storage technology largely depends on developing low-cost, highly efficient, and stable cathode materials.[4,5]In studies on cathode materials with long life cycles and high energy density, LiNixMnyCozO2(NMC,x+y+z=1)series have become alternative materials to commercially available LiCoO2.[6,7]Specifically,extremely low Co,Ni-rich layered cathodes with higher rate capabilities have attracted considerable attention to decrease the dependence on high-cost and toxic Co resources.[8,9]However,these cathodes have unstable structures when charged to high voltages,and cation mixing can easily form via Ni ions occupying the sites of Li ions by increasing the amount of Ni because of the similar ionic radius between Li+(0.76 ˚A) and Ni2+(0.69 ˚A).[10]These factors may cause structural degradation,capacity fading,and higher Li ion diffusion energy barriers.
To date,considerable researches have been devoted to addressing these issues by enhancing the contact area between electrodes and electrolytes,[11,12]coating stable materials,[13]and doping in host materials.[14,15]Among various modification methods, doping is an efficient technique that not only improves intrinsic electronic and structural stabilities,[16-18]but also effectively enhances ionic conductivities and capacity retention rates.[19,20]Many prior studies focused on metal(Mg,Zr,Na,and Zn)[21-24]and metalloid substitution(Si and F),[25,26]which improved the doped samples discharge capacity,life cycle performance,rate capability,and specific capacity. Many of these studies indicated that substituting O with F was a powerful method of improving electrochemical performance.
Previous studies demonstrated that F-doped LiNi0.8Co0.1Mn0.1O2and LiNi0.6Co0.2Mn0.2O2(NMC622)delivered higher rate capacity and capacity retention compared with pristine samples.[27,28]However, the initial discharge capacities are decreased after F substitute O atoms in LiNi0.5Co0.2Mn0.3O2-zFzmaterials.[29]Based on prior research, this undesirable result can be ameliorated by introducing lower amounts of Na in crystal structures.[30]Na is an abundant,low-cost,and eco-friendly element that is a promising dopant.[31]Na-doped Ni-rich LiNi0.5Co0.2Mn0.3O2cathode material can increase the Li slab space and suppress cation mixing because of Na’s relatively large radius. It also has a high tap density of 2.17 g/cm,which meets the commercial requirements of LIBs.[32]Na-ion doping Ni-rich layered oxides present lower potential polarization, higher initial Coulombic efficiency, and higher potential and capacity retention.[33,34]The electrochemical behavior can be modified using different doping strategies. In this study, we combine Na doping with F doping to more effectively enhance the cycling stability and rate performance, because our prior studies proved that co-doping is a suitable method of improving materials’properties.[35,36]
In this study, we use first-principles calculations to systematically investigate Na and/or F doping in Li1-αNi0.6Mn0.2Co0.2NaαO2-βFβ(whereα= 0 and 0.017 and/orβ=0 and 0.017) and present the effects on structural properties, ion diffusion, and cycling performances. To the best of our knowledge, this is the first study to investigate Na/F-co-doped NMC622,which may provide a synergistic effect to improve electrochemical performance.
2. Theoretical model and computational details
As a supplement to experimental work, theoretical simulation helps to narrow the gap between the current experiment and technology.[37]First-principles density-functional theory (DFT)[38]calculations with the projector augmented wave (PAW)[39]method were conducted using the Viennaab-initiosimulation package (VASP).[40]The Perdew-Burke-Ernzerhof (PBE) exchange-correlation function was used, which is a generalized gradient approximation (GGA)method.[39]To correct the strong d electrons of transition metals (TMs), we adopted the GGA+U[41]approach to structurally optimize the HubbardUparameters of Ni, Mn, and Co ions to be 5.96, 5.0, and 5.1 eV, respectively.[23]The kinetic energy cutoff for plane-wave expansion is 500 eV.Structural optimization is performed with full spatial relaxation until the change in the maximum residual force is lower than 0.02 eV/˚A.A total of 240 atoms(Li60Ni36Mn12Co12O120)are used in a 5×4×1 supercell with anR-3mspace group and 20 formula units of anα-Na/FeO2-type structure for all of the calculations. The calculations are performed using only gammak-point mesh(1×1×1)that are generated via the Monkhorst-Pack method.[42]Here,the higherk-point meshes are carefully tested, it shows that the energy differences between them are less than 6 meV, and the change of structure constant is less than 3.1%. Suggesting few calculation errors, while it takes more than twice time to calculate once improvek-point mesh.
The activation energy barrier of Li ion diffusion from one site to a neighboring site is assessed using the climbing imagenudged elastic band(CI-NEB)method.[43]The initial and final states are first relaxed to achieve the minimum energy configurations. To determine the transition states,five images are linearly generated between the fixed initial and final states,noteworthy,the highest point of the energy difference is the transition states. The energy difference between the initial state and saddle point is defined as the diffusion barrier.
3. Results and discussion
3.1. F doping position and structural stability


Fig.1. Atomic configurations for NMC622 structure: (a)side view,and(b)top view of the TM layers.
We firstly focus on predicting the preferred F doping site(the most stable site)and thus calculate the formation energies to determine the lowest energy configurations for further studies because there are three oxygen equivalents for doping.The formation energies(ΔEf)of substitution doping are defined as follows:

whereEdopeandEpristineare the total energies of the supercell with different dopants and the pristine structure, respectively.μrandμdare the atomic chemical potentials of replaced atoms and dopants,respectively. Here,Nis the impurity atoms number.
The calculated lattice parameters (aandc) and average bond length of Li-O (F) in NMC622 and preferred F-doped structures are compared with the experimental results in Table 1. The lattice parameters’theoretical values are all slightly higher than the experimental values, but the differences between these values are less than 3%, demonstrating our calculations’ accuracy. Compared to the un-doped structures,the lattice parameters (aandc) of the F-doped systems increase, but these changes are all less than 0.4%, suggesting that the F-doped structures are stable. Due to the stronger bonding strength of Li-F bonds(577 kJ/mol)than Li-O bonds(341 kJ/mol),[45]the Li-F bond length is slightly shorter than Li-O bonds(Table 1),which may have decreased the Li layer spacing, demonstrating the close relationship with the diffusion rate of Li ions.[46]In this study,the distances between the averageccoordinates of the two neighboring oxygen layers(O-TM-O and O-Li-O)are defined as the thicknesses of the TM and Li layers. We prove that F doping (2.64 ˚A) shorten the Li layer spacing compares to pristine NMC622(2.65 ˚A)at the beginning of charging.

Table 1. Geometric parameters of the pristine and F-doped NMC622,where a and c denote lattice parameters,and DLi-O(F)denotes the length of Li-O or Li-F bond.
The previous XRD patterns indicated that different F ions substitution neither alter the crystal structure of LiNi0.6Co0.2Mn0.2O2-zFznor produce unwanted secondary phases in the range ofz=0-0.06, while they observed that the declines ofI(0 0 3)/I(1 0 4) peaks from 1.31 (z= 0)to 1.14 (z=0.06) indicating that the degree of cation mixing increased.[26]Beginning with our research, we test the influence of F contents on structural stability, the results are shown in Table 1. We find that all the structures are stable after F-doping, however, the formation energies can be increased with the enhance of F-doping concentration,only the 1F-doped model is thermodynamically more stable. Different from the F-doping, Na doping (2.69 ˚A) expand the Li layer spacing. Huanget al. reported that the electrochemical performances were all improved after Nadoping in Li1-αNaαNi0.6Co0.2Mn0.2O2. When Na-doping withα=0.01 or 0.03, the discharge capacities higher than the perfect one (178 mAh·g-1), which were 183 mAh·g-1and 184 mAh·g-1, respectively. Noteworthy,α= 0.01(93.51%) delivers a higher capacity retention rate thanα=0.03 (91.67%) electrodes.[31]Therefore, we first propose an Na/F-co-doped NMC622 (2.67 ˚A) model to increase the Li layer spacing and improve the electrochemical performance.
Here, we discuss the structural stability after different doping through calculate the formation energies using Eq.(1).The formation energy of Na-doping is 4.66 eV,which indicates that it is difficult for Na-doping alone. The formation energy of F-doping is-1.5 eV, means that F ions are more easily doped than Na ions in thermodynamics. Turning to Na/F-codoping(-1.15 eV),it is obviously easier than Na-doping. We found that further doping Na ions into the system, which F ions already exist in oxygen layer, to form F-Na-co-doping(0.34 eV)can significantly reduce the difficulty of Na-doping.It shows that Na/F-co-doping is not formed by one step in experiments,but F ions doping into oxygen layer firstly,and then Na ions are introduced into Li layer.
The NMC622 cathode materials are composed of three ABC repeat units. Considering the symmetry of the structure,we calculate the formation energies of different concentrations of Naα/Fβ-co-doping (0.017≤α ≤0.067 and 0.008≤β ≤0.033,α=2β). Note that there are 60 Li atoms whenα=1 in our supercell structure. It is found that Na0.017/F0.008-codoping (-1.15 eV) and Na0.05/F0.025-co-doping (-1.76 eV)are stable systems. As for Na0.67/F0.033-co-doped one,the formation energy can increase to 10.05 eV, which indicates that this system is difficult to form thermodynamically.To summarize, the current studies mainly focus on the Na/F-co-doping model with a low doping concentration,that is,Na0.017F0.008-co-doping.
3.2. Structural constant during charging
3.2.1. Lattice parameters
To understand the effect of doping on NMC622,we simulate the charging process by removing Li ions,which significantly affect the structural properties. Minet al. adopted a method,namely the cluster expansion(CE)method,[47]to explore the delithiation process,and found a similar delithiation manner in all these Li1-xMO2(0≤x ≤1)(whereM=Ni,Co,and Mn) systems. They proposed that Li ions extracted one by one from each layer: as the first Li ion is delithiated from one specific layer, the other two Li ions should be extracted from the second and third layers,respectively. The procedure continues until complete the delithiation. The lattice constants largely depend on the Li extraction content.Therefore,we also employ this method in this study. During the delithiation process,the lattice constant of NMC622(Fig.2)shows a similar trend to the experiment,[47]which suggests that our calculation is reasonable. Takingx=0.75, for example, the lattice constants for theoretical and experimental are (a=2.855 ˚A,c= 15.05 ˚A, and volume = 105 ˚A3)versus(a= 2.825 ˚A,c=14 ˚A, and volume =97 ˚A3), respectively. Note that the former ones are slightly larger than the latter ones,and the previous theoretical value for parametercis 14.8 ˚A atx=0.75 in NMC622.[48]This is due to the overestimation of the lattice constant in first-principles calculations.[49]During the delithiation processes,lattice parameteradecreases(Fig.2(a)). After further delithiation to 50%, different dopants have different lattice variations. The greatest change(from 50%to 100%delithiation) occurs in the Na-doped structure (0.045 ˚A), followed by the Na/F-co-doped (0.036 ˚A), NMC622 (0.032 ˚A),and F-doped structures(0.029 ˚A).
Compared to lattice parametera, the overall change in lattice parametercis considered to be more critical during charging, because increasecaxis is beneficial for Li ion diffusion.[50]In different systems (Fig. 2(b)), lattice parametercbegins to increase at approximately 75% delithiation and then decreases during further charging, which may due to the reduction in Li-O bonds and the exclusion of positive valence after Li removal. Thecincreases during charging up to 75%in the Na/F-co-doped structure,which may have positively influence on the Li ion diffusion. With further charging,the Na-doped structure differs from the others and it seems to suppress the changes in lattice parametercas the ionic radius of the Na+(1.02 ˚A) is larger than that of the Li+(0.76 ˚A).The introduction of Na ions does not change structure’s lattice parameterc, similar to finding in layered sodium chromium sulfide.[51]
We also explore the variations in the volume associate with the changes in lattice parametersaandc(Fig.2(c))during delithiation.Based on the simulations,the variations in the volumes increase and then decrease, and all of the systems’volumes changed relatively slightly. After extracting 75% of the Li, the volumes start to rapidly decrease, which is caused by the decrease in the lattice parameterc. In this study, the volume difference ΔVand change rate of the volumeφare defined using the following equations:

whereVdelitandVinitare the volumes of the full delithiation and full lithium structures, respectively. Of the four structures, the Na-doped structure most effectively limit the volume changes during delithiation and exhibits the smallest total volume decrease (-0.213 ˚A3, 0.1%), followed by the F-doped (-4.262 ˚A3, 2.02%) and Na/F-co-doped structures(-4.831 ˚A3, 2.23%). The pristine structure has the largest changes in both the volume and lattice parameter(-7.793 ˚A3,3.7%). To summarize, doping with heteroatoms increase the structural stability and the volume expansion enlarge the diffusion channel of the Li ion. The lattice parameters of the Na/F-co-doped structure are between Na-and F-doped structures,indicating that co-doping can lead to synergistic effects,and the dopants offset the changes in the local structure,which could retain the advantages of Na-or F-doping.

Fig.2. The variation in the lattice parameters:(a)a,(b)c,and(c)the volume during delithiation for the pristine, F-doped, Na-doped, and Na/F-co-doped systems.
3.2.2. Interlayer spacing
To further understand the origin of the increase and decrease in lattice parametercand the volume, the thickness of Li andTMlayers during charging are calculated. The results are shown in Fig. 3. The Li layer’s thicknesses first increase and then decrease because the Li-O bonds play a leading role during the initial charging stage,while the Li-O bonds became weaker and Li layer increases due to the reduce of Li content.The Li layer starts to collapse due to less Li in the Li layer and the Li-O bonds no longer play a major role. However,theTMlayer thickness continues to decrease, because of the increase in oxidation between theTMs and O during delithiation process,which decreases the ionic radius and shorten the bond length ofTM-O.[48]Therefore, the change trend in lattice parametercand the volume is mainly caused by the Li layer spacing.

Fig.3.The variation in the thickness of Li-and TM-layers during delithiation for the pristine and doped NMC622.
3.3. Influence of doping on electrochemical performance
3.3.1. Open-circuit voltage
Extracting more Li ions from the cathodes for higher capacity is desirable for batteries. The amount of Li ions is the primary property of LIB cathode materials,which can be utilized under a certain voltage and average intercalation voltage.In this study,using the system’s total energy,we simulate the open-circuit voltage(OCV),andV(x1≤x ≤x2)is calculated using the following equation:

whereE[Lix1MO2]andE[Lix2MO2]are the system’s total energies at Li concentrations ofx1andx2,respectively,andμ[Li]is the chemical potential of Li metal.The calculated results are shown in Fig.4 and it presents that the potentials decrease with the increase of Li concentration. When the same amount of Li ions is extracted, the voltage values depend on the dopants.The average voltage values in this study are 3.69, 3.75, 3.78,and 3.72 V in the pristine, F-doped, Na-doped, and Na/F-codoped NMC622 samples, respectively. The calculated voltages of the doped systems are all slightly higher than that of the pristine material. At present, the average voltage of commercial nickel manganese cobalt electrode is 3.7 V,[52]and the doping models calculated by us are all higher than 3.7 V. It should be noted that the voltage from simulations for the case of LNO is approximately 0.7 V lower than that obtained from experiments, which is attributed to usage of GGA.[53]Therefore,from the perspective of application,the materials that we design can improve the output voltage at a certain extent.

Fig.4. Calculated open circuit voltage profiles at different delithiation levels for pristine and doped NMC622.
3.3.2. Li ion diffusion behavior
Rapid Li ion diffusion is important for delivering a larger specific capacity in LIB cathode materials,[54]while slow Li ion diffusion kinetics lower the power density, often leading to undesire phase transitions.[55]For F doping in full lithium systems, reducing the Li slab space may decrease the Li ion diffusion coefficient, which is considered a key factor in the rate capability of cathode materials.[56]In this study,to understand the doping effect on Li ion diffusion,we investigate the Li ion hopping mechanism from one octahedral site to another vacant Li octahedral site through an intermediate tetrahedral site with a transition metal(TSH).This is based on the previous conclusion that TSH is an energy favorable diffusion path compares to other paths.[57]A chain of five images is linearly interpolated between the initial and final states. In the diffusion energy barrier profile, each point represents the energy difference at the initial state.
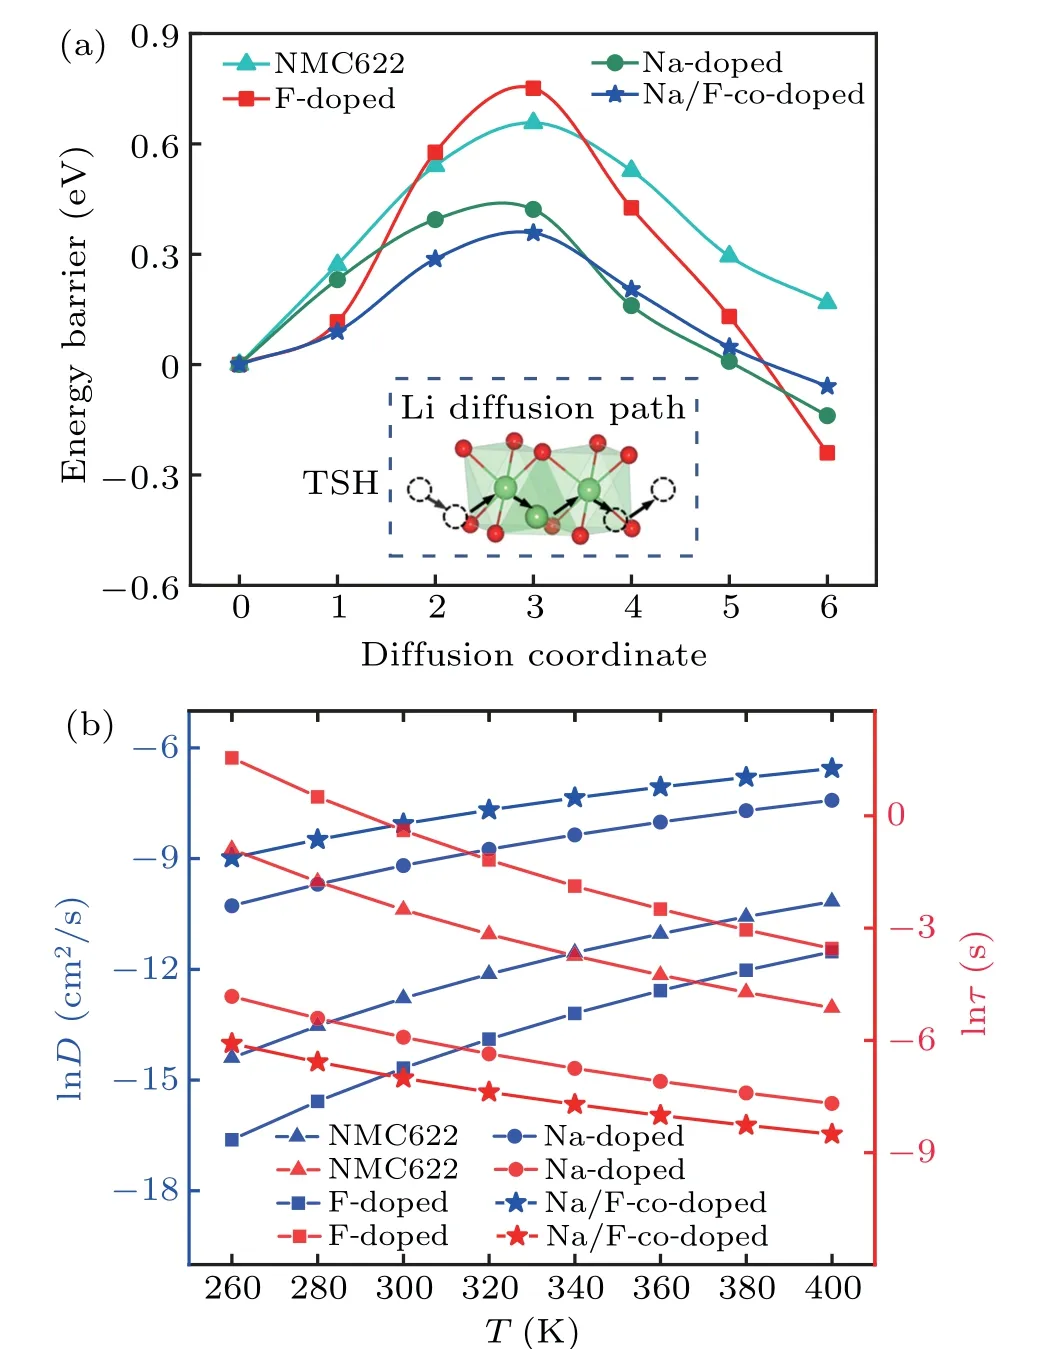
Fig. 5. The influence of doping in Li ion diffusion: (a) The energy barrier profile along with the Li-layer for pristine and doped NMC622(TSH means that Li ion hopping from one octahedral site to another vacant Li octahedral site through an intermediate tetrahedral site with a transition metal). (b)The natural logarithm(ln)of diffusivity and diffusion time of Li ions as a function of temperature(T).
The calculated Li ion diffusion energy barriers at full lithium are shown in Fig.5(a). These results demonstrate that the interlayer spacing has a significant influence on Li ion diffusion. For NMC622,the activation energy is 0.63 eV,while F doping inhibites Li ion diffusion(Fig.5(a))because it reduces the Li layer spacing and narrows the diffusion channel. During the F-doping charging process,the Li layer became larger than the pristine structure and thus the view that F-doping inhibits Li ion diffusion is not comprehensive because this only occurs in low Li and full lithium regions. The Li layer increases significantly at approximately 75%Li after Na-doping and Na/F-co-doping, and Na-doping especially increases the overall Li layer process,which might be the reason for experimental observations that Na-doped systems increase Li ion diffusion coefficients.[22]The activation energy (0.36 eV) of the Na/F-co-doped NMC622 (Fig. 5(a)) is the lowest among all of the systems considered and approximately 42.8%lower than in the pristine NMC622,but the Li layer spacing is almost between the Na-and F-doped structures,so there is a synergistic effect between Na and F.The Li layer spacing in the Na/Fco-doped NMC622 system is even larger than in the Na-doped structure at approximately 75%, which indicates that Li ion diffusion significantly increased,so the Na/F-co-doped system may be an optimal model to improve cathode materials’power density and rate performance.
According to the transition state theory,the energy barrier(Eb)of Li ion diffusion can determine the diffusion constant.For further understanding the diffusion behavior of Li ion,we calculate the diffusion coefficient (D) using Arrhenius equation. The mean diffusion time of the Li ions(τ)as a function of the temperature(T)is taken into account using the following formulas:[58]

HereLis the hopping distance of Li ion,v0is the vibration frequency of approximately 1013s-1,Eais the diffusion barrier,andKBis the Boltzmann constant.
The diffusion properties can be significantly affected by temperature. Following Eqs. (5) and (6), the Arrhenius relation is plotted in Fig. 5(b) as natural logarithm (ln) scale.The Arrhenius relation describes diffusion coefficients as a function of temperature from 260 K to 400 K. The diffusion coefficients of the Li ions gradually enhanced with the increase of temperature, while the Li ions’ diffusion time decrease(Fig.5(b)). From a structural design perspective,Eais a key indicator of dynamic performance. Because the trend in the diffusion coefficients has a positive correlation with the energy diffusion barrier, that is, the diffusion coefficients of Na/F-co-doped NMC622 is the highest while its energy barrier is the lowest.
3.3.3. Cation interlayer mixing and diffusion
In Ni-rich layered oxides, Ni/Li disordering is a common defect due to the similar ionic radius between Ni2+and Li+.[59]This can trigger the formation of rock salt or spinellike structures during the cycling process, which may block Li ion diffusion channels and lead to capacity loss and voltage decay.[60]To understand the effect of doping on cation mixing,we interchange the sites between Ni and Li to simulate Ni/Li disordering as shown in Fig.6.We adopt the energy difference(ΔE)equation ΔE=ENi/Li-Eperfect,whereENi/LiandEperfectare the total system energy with and without Ni/Li disordering,respectively. The degree of Ni/Li is considerably increases by doping F (0.34 eV) compares to NMC622 (0.73 eV), while Na-doping(0.82 eV)hinders the Ni/Li mixing, similar to experimental observations.[32]It was previously reported that Na ions behave similar to pillars in Li slabs, which prevented Li slabs from collapsing to reduce the irreversible capacity loss,and small Ni/Li disorders can exhibit better electrochemical performance,[61]so a minimum degree of cation disordering is usually desired.[62]In this study,the Na/F-co-doped structure largely hinders the disordering of Ni/Li because of the greater energy difference(1.34 eV)among the four systems,which is superior for irreversible capacity decay. The reduced cation mixing effectively decrease the activation energy barrier in the Li ions,which is another reason why the Li ions diffuse fastest in the Na/F-co-doped structure.

Fig.6. (a)Crystal model of the NMC622 structure. (b)Different dopants sites and the initial site of Ni and Li ions. (c)The exchange of Ni and Li ions to simulate cation mixing. Note that the cation mixing is near the dopants.
During charging/discharging,the sequential migration of Ni, Co, and Mn is present in layered cathode materials,[63]which means that it is easier for Ni to migrate to Li slabs,and increasing the TMs in the Li layer would cause lattice disordering. In this study, we use the transition state theory to determine the role of dopants in Ni migration to the Li layer(path B).The results are shown in Fig.7. The energy barriers for Ni ions diffusion are 1.795 eV,1.053 eV,and 1.892 eV in the NMC622,F-doped,and Na-doped structures,respectively,which have the same doping patterns after cation mixing. Furthermore, the Na/F-co-doped structure has the highest Ni ion diffusion energy barrier(2.24 eV),thus significantly hindering the migration of Ni and stabilizing the structure.In conclusion,the Na/F-co-doped structure is the best system for improving the electrochemical performance.

Fig.7. The Ni ion diffusion energy barriers profile along with the c axis for the pristine and doped NMC622. Note that at the end of paths is a Li vacancy site.
4. Conclusions
In this study, we performed first-principles calculations to simulate the influence of doping on the geometric structure and electrochemical performance. The change trend in parametercand the volume largely depends on the changing Li layer spacing. In single ion doping, F doping can inhibit Li ion diffusion due to the shrinkage of Li layer spacing at the beginning and end of charging,and Na doping can effectively enhance the rate capability. In contrast, the Na/F-co-doping demonstrates the anticipated synergistic effect. This decreases Li mobility,as caused by F-doping,thus stabilizing the structure. In addition, the rate performance of Na/F-co-doping is better than that of Na- or F-doping, and also there is only a small amount of Ni/Li mixing occurred, thus reducing the irreversible capacity. Moreover, Na/F-co-doping significantly increases the energy barrier of Ni-ion diffusion to the Li layer,which effectively improves the Li-ion diffusion rate, because once Ni ions enter the Li layer, the Li-ion diffusion channel is hindered. These results indicate that substituting Na and F ions is an effective strategy to improve the electrochemical performance of NMC622.
猜你喜欢
杂志排行

Chinese Physics B的其它文章
- Numerical simulations of partial elements excitation for hemispherical high-intensity focused ultrasound phased transducer*
- Magnetic-resonance image segmentation based on improved variable weight multi-resolution Markov random field in undecimated complex wavelet domain*
- Structure-based simulations complemented by conventional all-atom simulations to provide new insights into the folding dynamics of human telomeric G-quadruplex*
- Dual-wavelength ultraviolet photodetector based on vertical(Al,Ga)N nanowires and graphene*
- Phase-and spin-dependent manipulation of leakage of Majorana mode into double quantum dot*
- Deep-ultraviolet and visible dual-band photodetectors by integrating Chlorin e6 with Ga2O3