Morphological characteristics and genetic diff erentiation of Lutraria maxima in coast waters off southeast China*
2021-07-29KangCHENWeifengWANGWeilinZHUXiuliCHENHuanlingWANG
Kang CHEN , Weifeng WANG , Weilin ZHU , Xiuli CHEN ,**, Huanling WANG ,**
1 Key Lab of Freshwater Animal Breeding, Key Laboratory of Agricultural Animal Genetics, Breeding and Reproduction, Ministry of Education, College of Fishery, Huazhong Agricultural University, Wuhan 430070, China
2 Guangxi Key Laboratory of Aquatic Genetic Breeding and Healthy Aquaculture, Guangxi Academy of Fishery Sciences, Nanning 530021, China
Abstract To explore genetic diversity and estimate the genetic diff erences among populations of Lutraria maxima in the coastal waters off south to southeast China, the morphology of the species of five diff erent geographical populations (Beihai, Weizhou Island, Zhanjiang, Xiamen, and Fuzhou) in Guangxi,Guangdong, and Fujian provinces was studied statistically in combination with the microsatellite markers.As revealed by morphological principal component analysis (PCA), the cumulative contribution rate of the first three principal components was 72.596%. The discrimination accuracy ranged from 47.5% to 80.0%,and the scatter plots of principal component and discriminant analysis were consistent in overall, showing that the Xiamen and Fuzhou populations were overlapped obviously. For microsatellite markers, 10 pairs of polymorphic primers were obtained by high-throughput transcriptome sequencing, and used for genetic diversity analysis. It was showed that the average number of alleles and eff ective alleles observed in each population ranged from 8.100 to 10.900, and from 3.497 to 4.228, respectively. The average observed heterozygosity ( H o) and expected heterozygosity ( H e) in the five populations ranged from 0.541 to 0.615,and from 0.642 to 0.733, respectively. The genetic distance (DA) ranged from 0.078 to 0.523, and the population genetic diff erentiation index ( F ST) ranged from 0.027 to 0.139. The unweighted pair-population method with arithmetic means (UPGMA) and structure analysis showed that the five populations could be divided into two main clusters, the Beibu Gulf group (Beihai and Weizhou Island) and the Southeast China Sea group (Zhanjiang, Xiamen, and Fuzhou), suggesting that L. maxima has been separated geographically by the barrier of the Leizhou Peninsula into two groups in evolution, which provided us with a scientific clue to better protect the bioresource and establish an appropriate fishery management stocks for L. maxima populations in south China.
Keyword: Lutraria maxima; morphological diff erence; microsatellite markers; genetic diversity; genetic diff erentiation; transcriptome
1 INTRODUCTION
The clamLutrariamaximais a benthic bivalve with shell in faint yellow, and found in sandy habitats from the lower intertidal zone to 10-m depths. It is widely distributed in the coastal waters off the southern to southeastern China, and especially abundant in Beibu Gulf (Li et al., 2004). In recent years, this species has developed into one of the main varieties of shallow sea aquaculture especially in Guangxi and Guangdong provinces by natural seedling captivity (Pan and Su, 2007).
Morphological metric, also called the biological measurement method, is the most traditional and simple method for analyzing genetic variation. The variation of morphological traits among populations can be clarified by measuring the external morphological characteristics of the phenotypic traits.Multivariate analysis such as principal componentand discriminant analysis can easily and intuitively represent the morphological diff erences among diff erent populations, and clearly indicate the diff erentiation patterns of population structure(Frédérich et al., 2012). These methods have widely been used to distinguish diff erent populations in some aquatic animals. Ruiz-Campos et al. (2003) study the morphological diff erences among diff erent populations of wild trout (Salmonidae) in Mexico.Silva (2003) found the morphological diff erences between populations of sardines (Sardinapilchardus)from the northeast Atlantic Ocean and the western Mediterranean. As a kind of genetic markers,morphological markers are easily identified, simple and intuitive, but there are problems such as less number of markers, poor polymorphism, and subjective judgment of researchers. Additionally, they are often influenced by both environment and genetic factors (Murat and Aykut, 2015).

Table 1 Sample information of L. maxima
Microsatellites, also known as simple sequence repeats (SSR), or short tandem repeats (STR), refer to tandem repeat DNA sequences with 1-6 bases as a repeat core, and are distributed throughout the whole genome of an organism (Chistiakov et al., 2006).Due to high polymorphisms and convenient detection,microsatellite markers are relatively appropriate to estimate diff erentiation within and among populations, especially within narrow geographical range (Wolfus et al., 1997; Chareontawee et al.,2007). At present, microsatellite markers have been successfully applied to analyze genetic variation and population structure of mollusk. Genetic structure of sixSepiaoffi cinalispopulations in Iberian Peninsula from the Atlantic to the Mediterranean was analyzed,and a higher degree of genetic variation in these populations was found with seven microsatellite markers (Pérez-Losada et al., 2002). It has been reported that 21Mizuhopectenyessoensispopulations from Japan (Hokkaido and Honshu) and Russia show high genetic diversity with 0.701 1-0.762 2 of average expected heterozygosity (Sato et al., 2005).Kelly and Rhymer (2005) analyzed the population genetic structure ofLampsiliscariosain North America based on microsatellite markers, and pointed out that the biological and biogeographic history of the host fish had a potential impact on the population genetic structure ofL.cariosa.
Previous researches aboutL.maximafocused mainly on nutrition (Pan et al., 2007), reproductive characteristics (Li et al., 2004), and artificial breeding(Su et al., 2009). However, there are few reports on the evaluation ofL.maximagermplasm resources.Only a single study compared the genetic diff erences among three populations ofL.siebaldiiand one population ofL.maximausing morphological features and random amplified polymorphic DNA (RAPD)techniques (Li et al., 2011a). Therefore, to identify microsatellite markers with high polymorphism based on transcriptome data, and analyze the genetic diversity and genetic variation of five populations ofL.maxima, combined with morphological features.
2 MATERIAL AND METHOD
2.1 Sample collection
Lutrariamaxima(Table 1) were sampled from five diff erent populations along the east and south China coast, namely, Fuzhou (FZ,n=40) and Xiamen (XM,n=40) in Fujian Province, Zhanjiang (ZJ,n=40) in Guangdong Province, Weizhou Island (WZI,n=40)and Beihai (BH,n=40) in Guangxi Autonomous Region in summer 2018, and all samples were obtained from fishermen on local fishing wharfs(Fig.1). Muscle tissues of each individual were preserved in 95% ethanol and stored at -80 °C for DNA extraction.
This study was approved by the Institutional Animal Care and Use Committee (IACUC) of Huazhong Agricultural University, Wuhan, China,and conducted in accordance with the ethical standards and according to the regarding national and international guidelines.
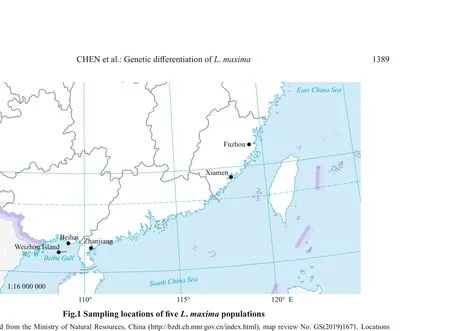
Fig.1 Sampling locations of five L. maxima populations
2.2 Morphometric analysis
Eleven shell characters were measured with Vernier calipers for each individual as previously described(Li et al., 2011a). To eliminate the influence of diff erent shellfish sizes on the morphological metics,a previous method (Gardner and Thompson, 1999)was referred prior to analysis, and the values of 10 morphometric (SH,SW,DUA,HAR,WAR,HPR,WPR,WT,DTL, andDPM) indices except for shell length (SL) were log10-transformed before being divided by log10-transformed total shell length to correct for size dependent variation. Ten morphological proportion traits were analyzed using SPSS19.0 for discriminant analysis, principal component analysis (PCA), and cluster analysis. The principal components were extracted according to the variance-covariance matrix and determined as the principal components whose eigenvalues are >1, and finally the dispersion point graph was drawn according to the load values of PCA1 and PCA2. The Euclidean distance coeffi cient was constructed by using the clustering method ofintergroup connection (Yang et al., 2019).
2.3 Genetic diversity analysis based on microsatellite markers
2.3.1 Transcriptome sequencing
Muscle tissues from fiveL.maxima(from BH population) were mixed in a pool, and frequently frozen in liquid nitrogen. Total RNAs were extracted from muscle tissues using the TRIzol regent according to the manufacturer’s instructions. RNA-seq transcriptome library was constructed and sequenced with 150-bp paired-end reads using Illumina HiSeq 2500. Transcriptome assembly was performed with Trinity software (Grabherr et al., 2011).
2.3.2 Identification of microsatellite markers
Microsatellite markers were identified in the transcriptome data using the MISA version 1.0 (http://pgrc.ipk-gatersleben.de/misa/misa.html) with the search criteria of repeat unit, single nucleotide repeat times ≥10, dinucleotide repeat times ≥6, three, four,five, six nucleotide repeat times ≥5, compound microsatellite marker site base interval ≤100 bp.Primer pairs for each microsatellite marker were designed using Primer 3 software (Untergasser et al., 2012).
2.3.3 DNA extraction and microsatellite marker genotyping
Genomic DNA was extracted from muscle tissues of all 200 fresh specimens as per the protocol described by Li et al. (2006). A total of 50 primer pairs were designed and amplified in 10 randomly selected individuals to obtain the appropriate microsatellite primers. PCR was performed in a 10-μL reaction mixture that included 0.3 μmol/L each primer, 0.15 mmol/L each dNTP, 1-μL 1×PCR buff er, 0.15-μLTaqDNA polymerase, 0.5-μL template DNA (100 ng/μL).Thermal cycling conditions for each locus were as follows: 3 min at 94°C, followed by 32 cycles of 94 °C for 30 s, annealing temperature (Table 2) for 30 s, and 72 °C for 25 s, and a final extension of 72 °C for 10 min. The PCR products were examined by electrophoresis on 8% non-denaturing polyacrylamide gelelectrophoresis (PAGE) gels and silver stained as previously described (Zhang et al., 2013).
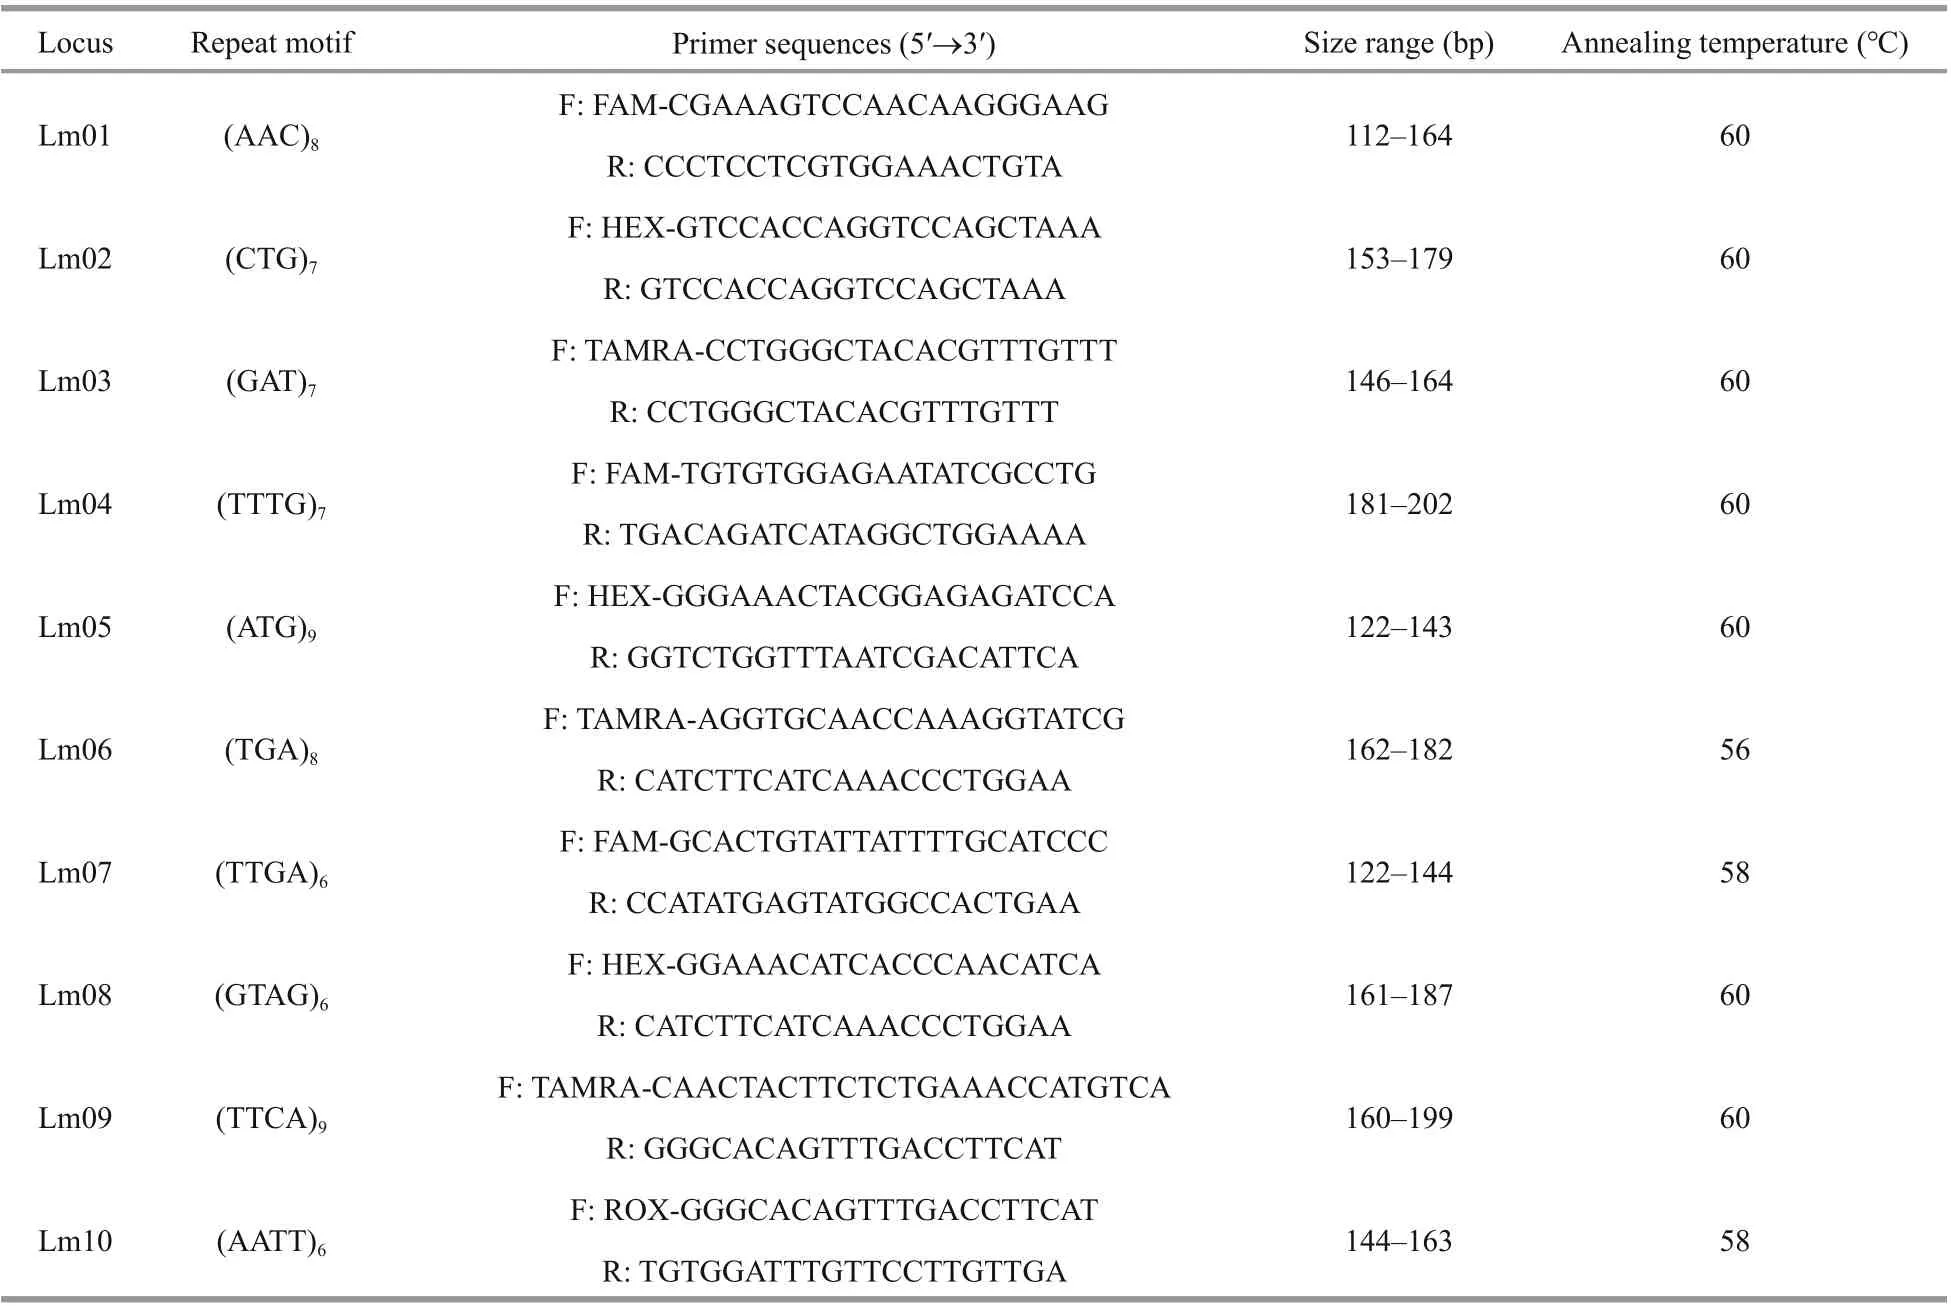
Table 2 Information for ten microsatellite loci and primers
Finally, 10 highly polymorphic microsatellite marker primers (Table 2) were obtained and labeled in fluorescence. PCR amplification was performed in the five populations ofL.maxima. The PCR products were detected by capillary electrophoresis using an ABI3730 sequencer (Applied Biosystems, USA), and genotypes were analyzed by Genemarker v1.91 software (Georgia Institute of Technology, Atlanta,Georgia, USA).
2.3.4 Statistical analysis
To analyze the genetic diversity, software Cervus v3.0 (Kalinowski et al., 2007) was used to estimate the number of alleles (Na) and eff ective alleles (Ne),expected (He) and observed (Ho) heterozygosity,Wright’sFstatistics (FIS) and polymorphism information content (PIC). GenAlEx 6.5 (Peakall and Smouse, 2012) was employed to calculate Nei’s genetic distance (DA), and analysis of molecular variance (AMOVA). Gene flow was calculated through theFSTbetween the two populations, and the calculation formula was as follows: g ene flow(NM)=(1-FST)/(4FST) (Wright, 1965). The presence of null alleles was detected by MICRO-CHECKER (van Oosterhout et al., 2004), and frequency of the null alleles was estimated using Brookfield (1996)equation,r=(He-Ho)/(1+He). Software Structure 2.3.4(Falush et al., 2003) was used for population genetic structure analysis, of which the parameter “Length of Burnin Period” was set to 10 000, “Number of MCMC Reps after Burnin” was set to 50 000,Kwas 1-7 and run 20 times for each value. Combined with the online tool, Structure Harvester (http://taylor0.biology.ucla.edu/structureHarvester/), the bestKvalue was determined (Evanno et al., 2005). CLUMPP 1.1.2(Jakobsson and Rosenberg, 2007) was used to repeatedly sample and analyze the structure Harvester’s results. Distruct 1.1 (Rosenberg, 2004)was finally used to draw the structure graph of Structure. Using MEGA 7.0 (Kumar et al., 2016), the unrooted unweighted pair-population method with arithmetic means (UPGMA) dendrogram was used to further verify the genetic grouping in Structure based on the DA. Arlequin v3.0 (Excoffi er et al., 2005) was employed to calculate pairwiseFSTvalues, and their significance by bootstrapping analysis (1 000 replicates) was tested for evaluating genetic diff erentiation among populations. Deviation from Hardy-Weinberg equilibrium (HWE) for each locuspopulation combination was assessed.
3 RESULT
3.1 Geometric morphometrics
3.1.1 Principal component analysis
To determine the principal component factors aff ecting the morphological diff erences ofL.maximain diff erent geographical populations, principal component analysis of 10 morphological proportion traits was carried out, and 3 principal components(PC1-PC3) were obtained (Table 3). The first three principal components accounted for 49.546%,12.980%, and 10.071% of the total variation,respectively, and the cumulative contribution rate was 72.596%. In the first principal component, the contribution rate ofSH/SLandSW/SLwas the largest,mainly reflecting diff erences of shell height and width. PC2 mainly showed the indicators ofDUA/SLandHPR/SL, which mainly reflected the characteristics of the distance between umbo and anterior end of shell, and height of posterior adductor muscle scar.PC3 mainly reflected the width of cardinal tooth(WT/SL) and distance between pallial line and ventral shell margin (DPM/SL). The scatter diagram of the principal component PC1 and PC2 of the five populations showed that there were more interlaced overlapping regions between the FZ and XM populations, suggesting that the genetic relationship of the two populations was the closest (Fig.2a).
3.1.2 Discriminant analysis
The results show that the comprehensive discrimination rate of the five populations was 64.0%(Table 4). Discriminant analysis of diff erent populations showed that BH and ZJ populations were generally located on the left side of the scatter plot,and the other three populations were mostly distributed on the right side of the scatter plot. In addition, the XM and FZ populations clearly occupied a significant overlapping region (Fig.2b). Geographically, the distance between the two populations was the closest,although some individuals were confused.
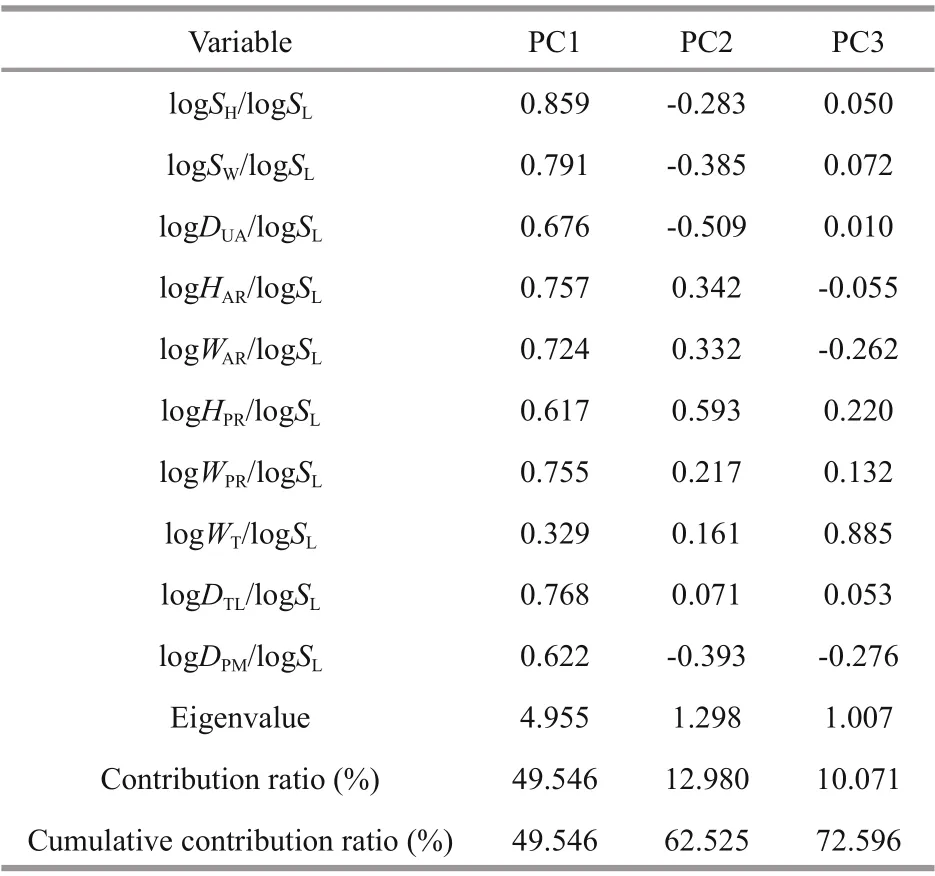
Table 3 Principal component analysis (PCA) in diff erent geographical populations of L. maxima
3.1.3 Cluster analysis
The Euclidean distance tree was obtained by the method ofintergroup connection based on mean values of the 10 morphological proportion traits, and showed that these five populations ofL.maximawere divided into two major branches (Fig.3). The BH and ZJ populations were clustered first, and the XM, FZ and WZI populations were clustered into another one.
3.2 Transcriptome-derived microsatellite marker mining
To explore polymorphism in transcriptome-derived microsatellite makers and further understand the genetic diversity and structure of diff erent populations,RNA-seq from muscle tissues was performed. In total, 63 047 transcripts were assembled using MISA software, and 2 561 microsatellite markers were found. Among these microsatellite markers, the most abundant motifs were mononucleotide (47.87%)repeats, followed by trinucleotide (26.63%), and dinucleotide (18.04%) repeat types. The tetranucleotide,pentanucleotide, and complex nucleotide repeat types were all less than 5%. A total of 50 primer pairs were designed, but only 10 pairs of primers were well amplified and highly polymorphic (Table 2).
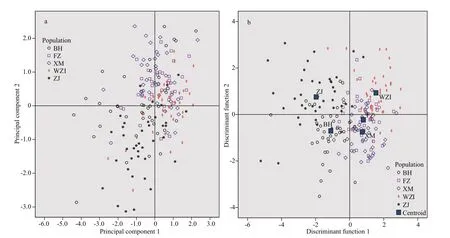
Fig.2 Distribution of PC1 and PC2 (a) and discriminant function analysis (b) for five populations of L. maxima based on morphological indicators
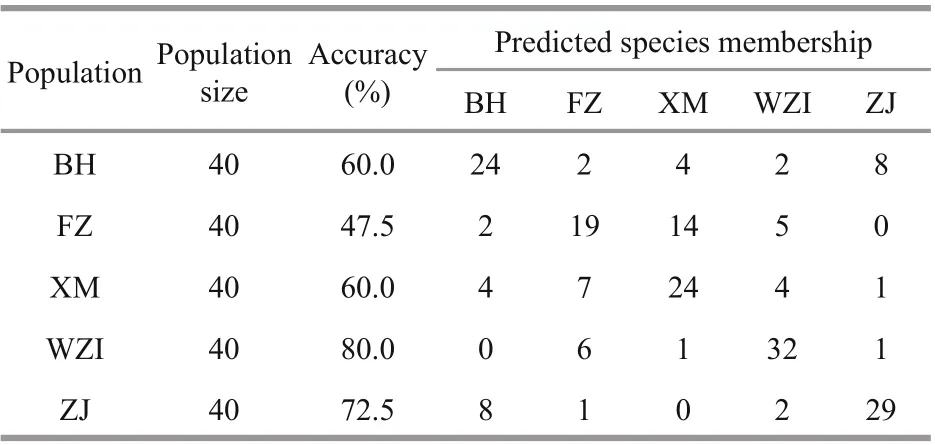
Table 4 Discriminant results in diff erent geographical populations of L. maxima
3.3 Genetic diversity and structure analysis
3.3.1 Polymorphisms of microsatellite loci
The average number of alleles in 10 microsatellite loci with polymorphism per locus was 9.041 (ranging from 6.000 to 12.800), PIC values were more than 0.5 at all loci (mean of 0.702). The expected heterozygosity(He) ranged from 0.549 to 0.857, and the mean observed heterozygosity (Ho) ranged from 0.428 to 0.725, indicating that these microsatellite loci had high polymorphism (Table 5). Hardy-Weinberg equilibrium (HWE) tests were performed and showed 35 tests with significant deviation from HWE in all five populations. The existence of null alleles was the main reason for deviation from HWE. Microchecker analysis showed that there were 8 microsatellite loci with null alleles (Table 5). The value ofFISwas greater than 0 except that the Lm05 locus was negative,indicating that there was a loss of heterozygotes at these loci, which may also be another important reason for the deviation from HWE.
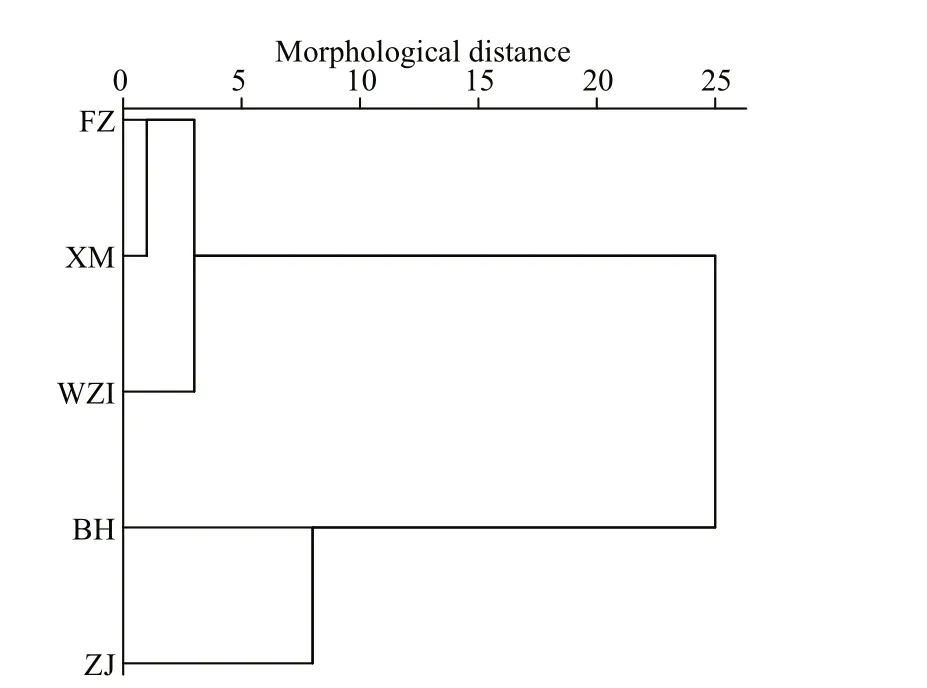
Fig.3 Cluster analysis of five populations of L. maxima in the Euclidean distance based on morphological indicators
3.3.2 Genetic diversity among populations
Fluorescent labeled microsatellite markers were synthesized and used to assess the genetic diversity of five geographical populations ofL.maxima. Data for all parameters of genetic diversity for 200 individuals from the five populations are shown in Table 5. The average number of alleles (Na) per locus varied from 8.100 to 10.900, and the average number of eff ective alleles (Ne) per locus varied from 3.497 to 4.228. The five populations examined here exhibited high levels of heterozygosity. The expected heterozygosity (He)ranged from 0.642 to 0.733, which the highest meanHeoccurred in the WZI population, and the lowest meanHewas in the XM population. The lowest mean observed heterozygosity (Ho) was in the XM population (0.541), whereas the highest in the BH population (0.615). At the species level ofL.maxima,the averageNa,Ne,Ho, andHeat per locus were 9.041,3.808, 0.574, and 0.681, respectively. In general, the diversity level ofL. maximapopulation in China was relatively high.
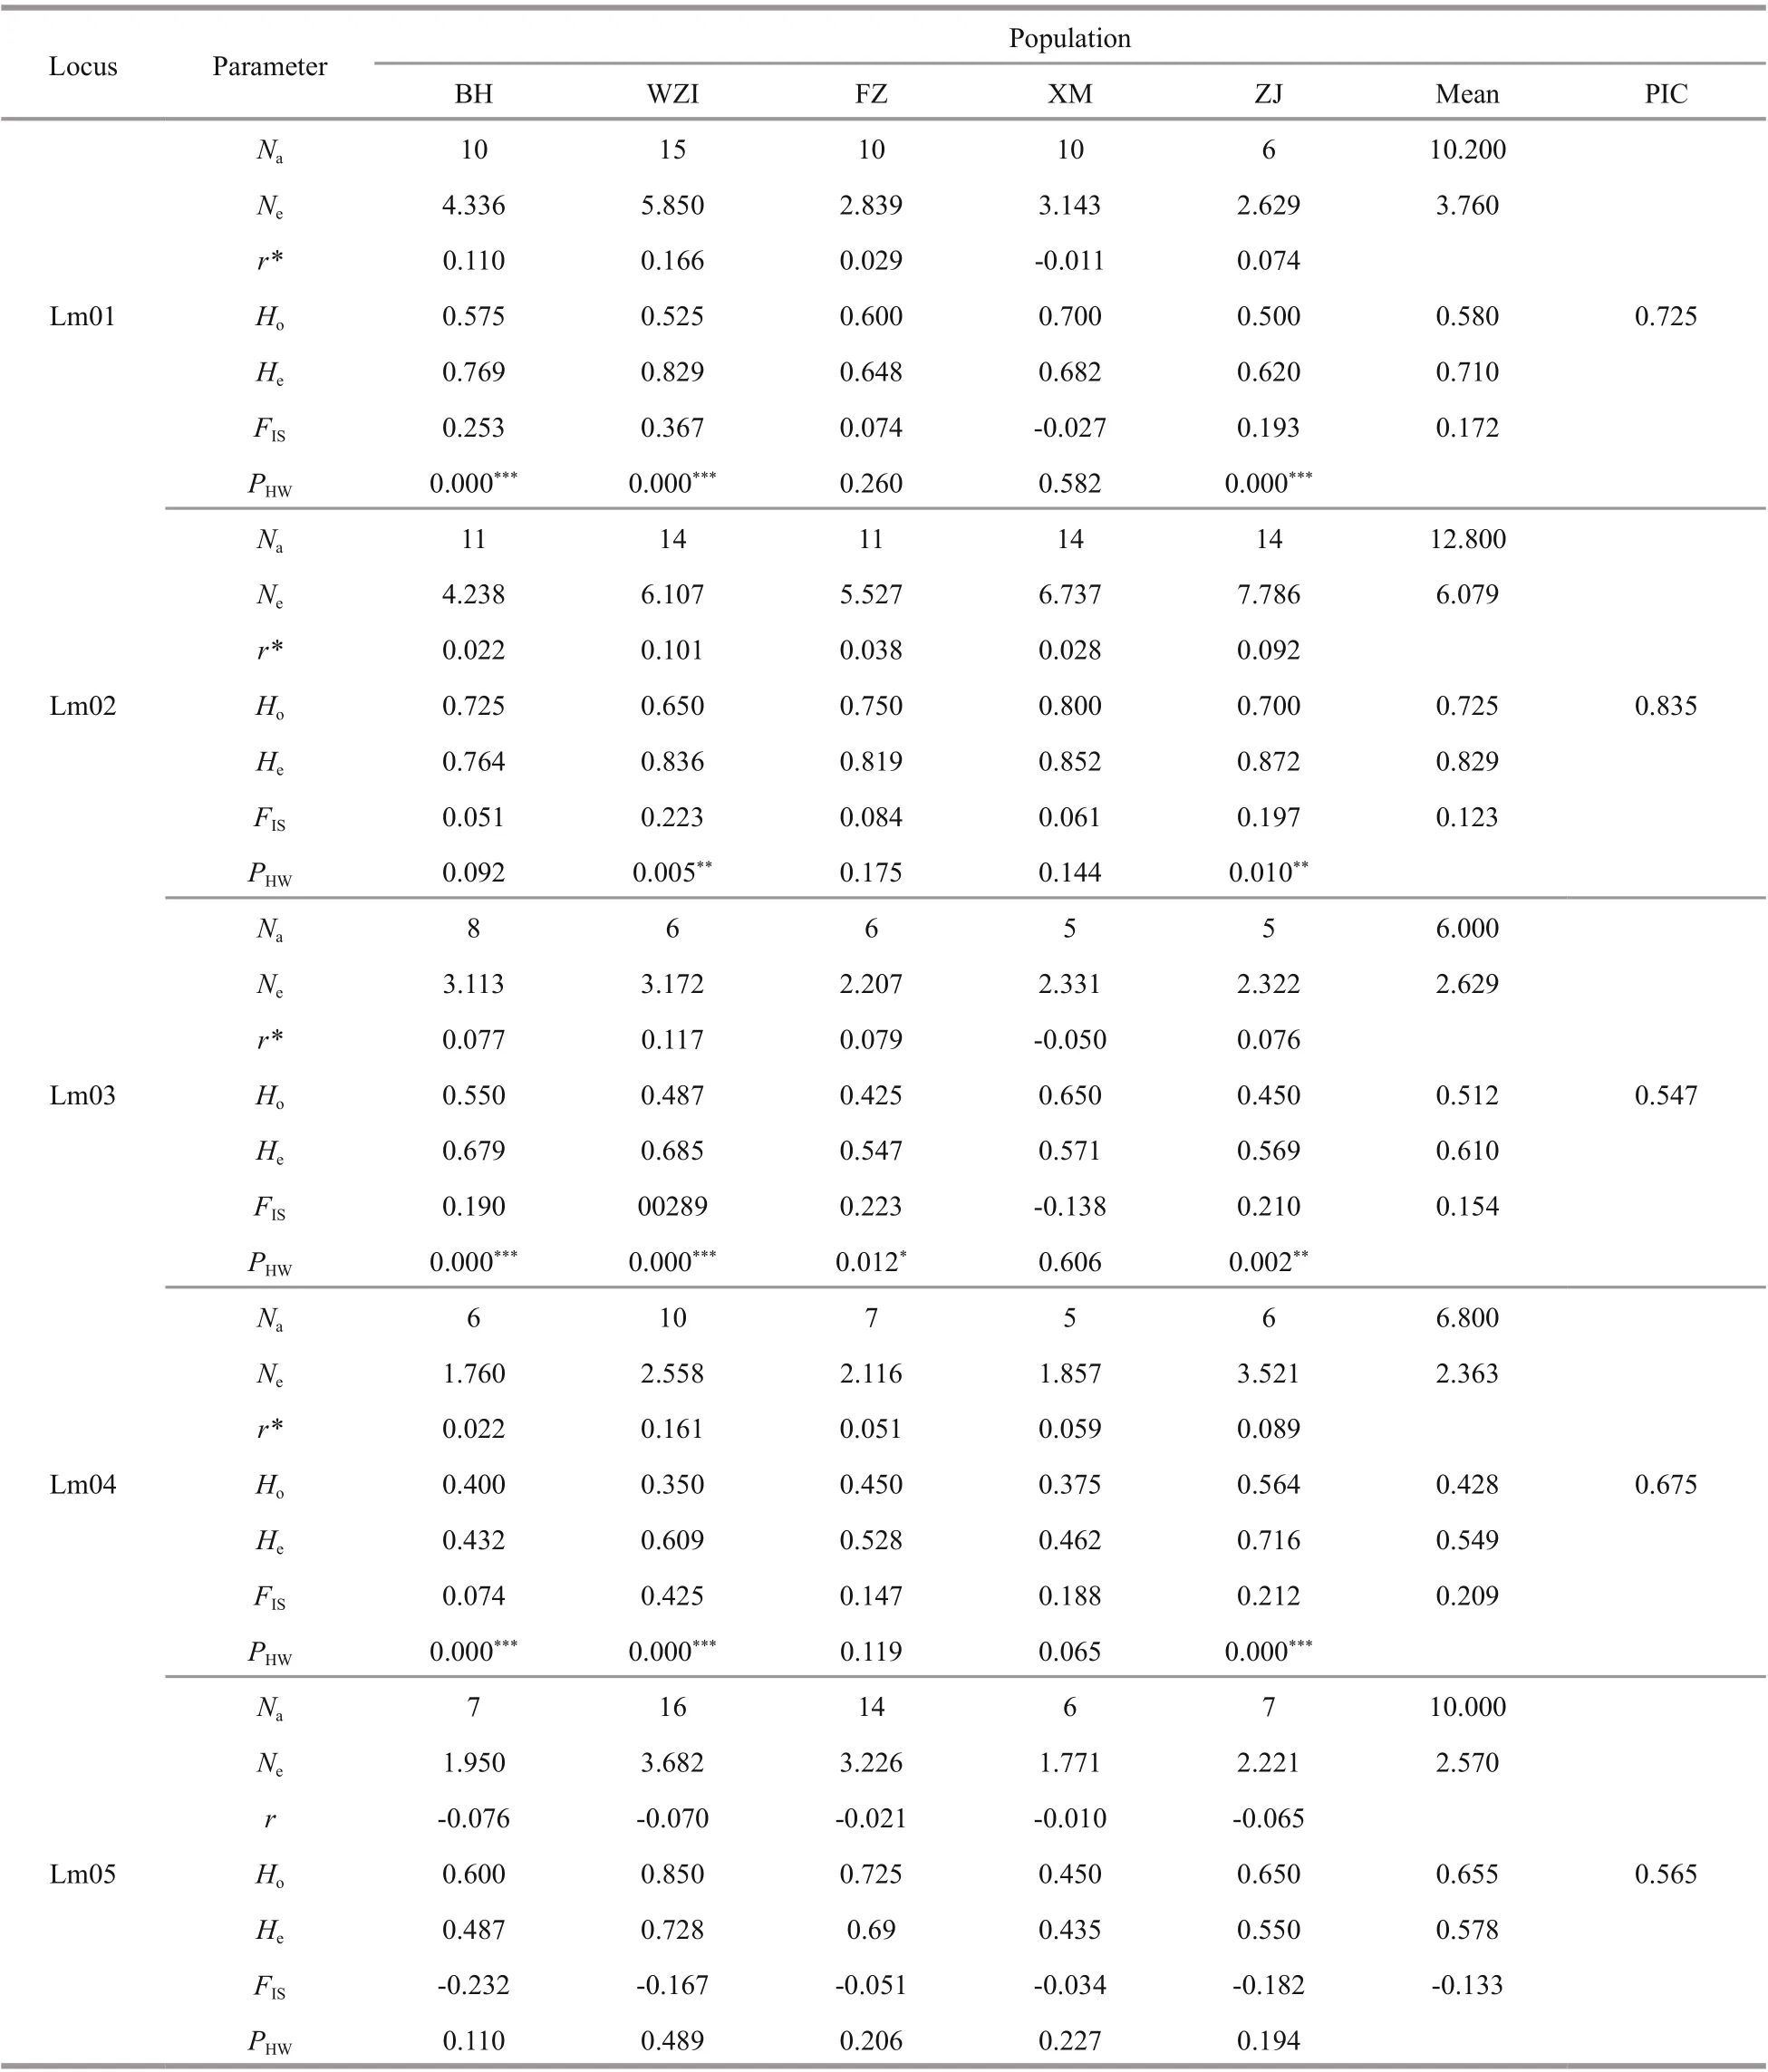
Table 5 Genetic variability of ten microsatellite loci in five populations of L. maxima
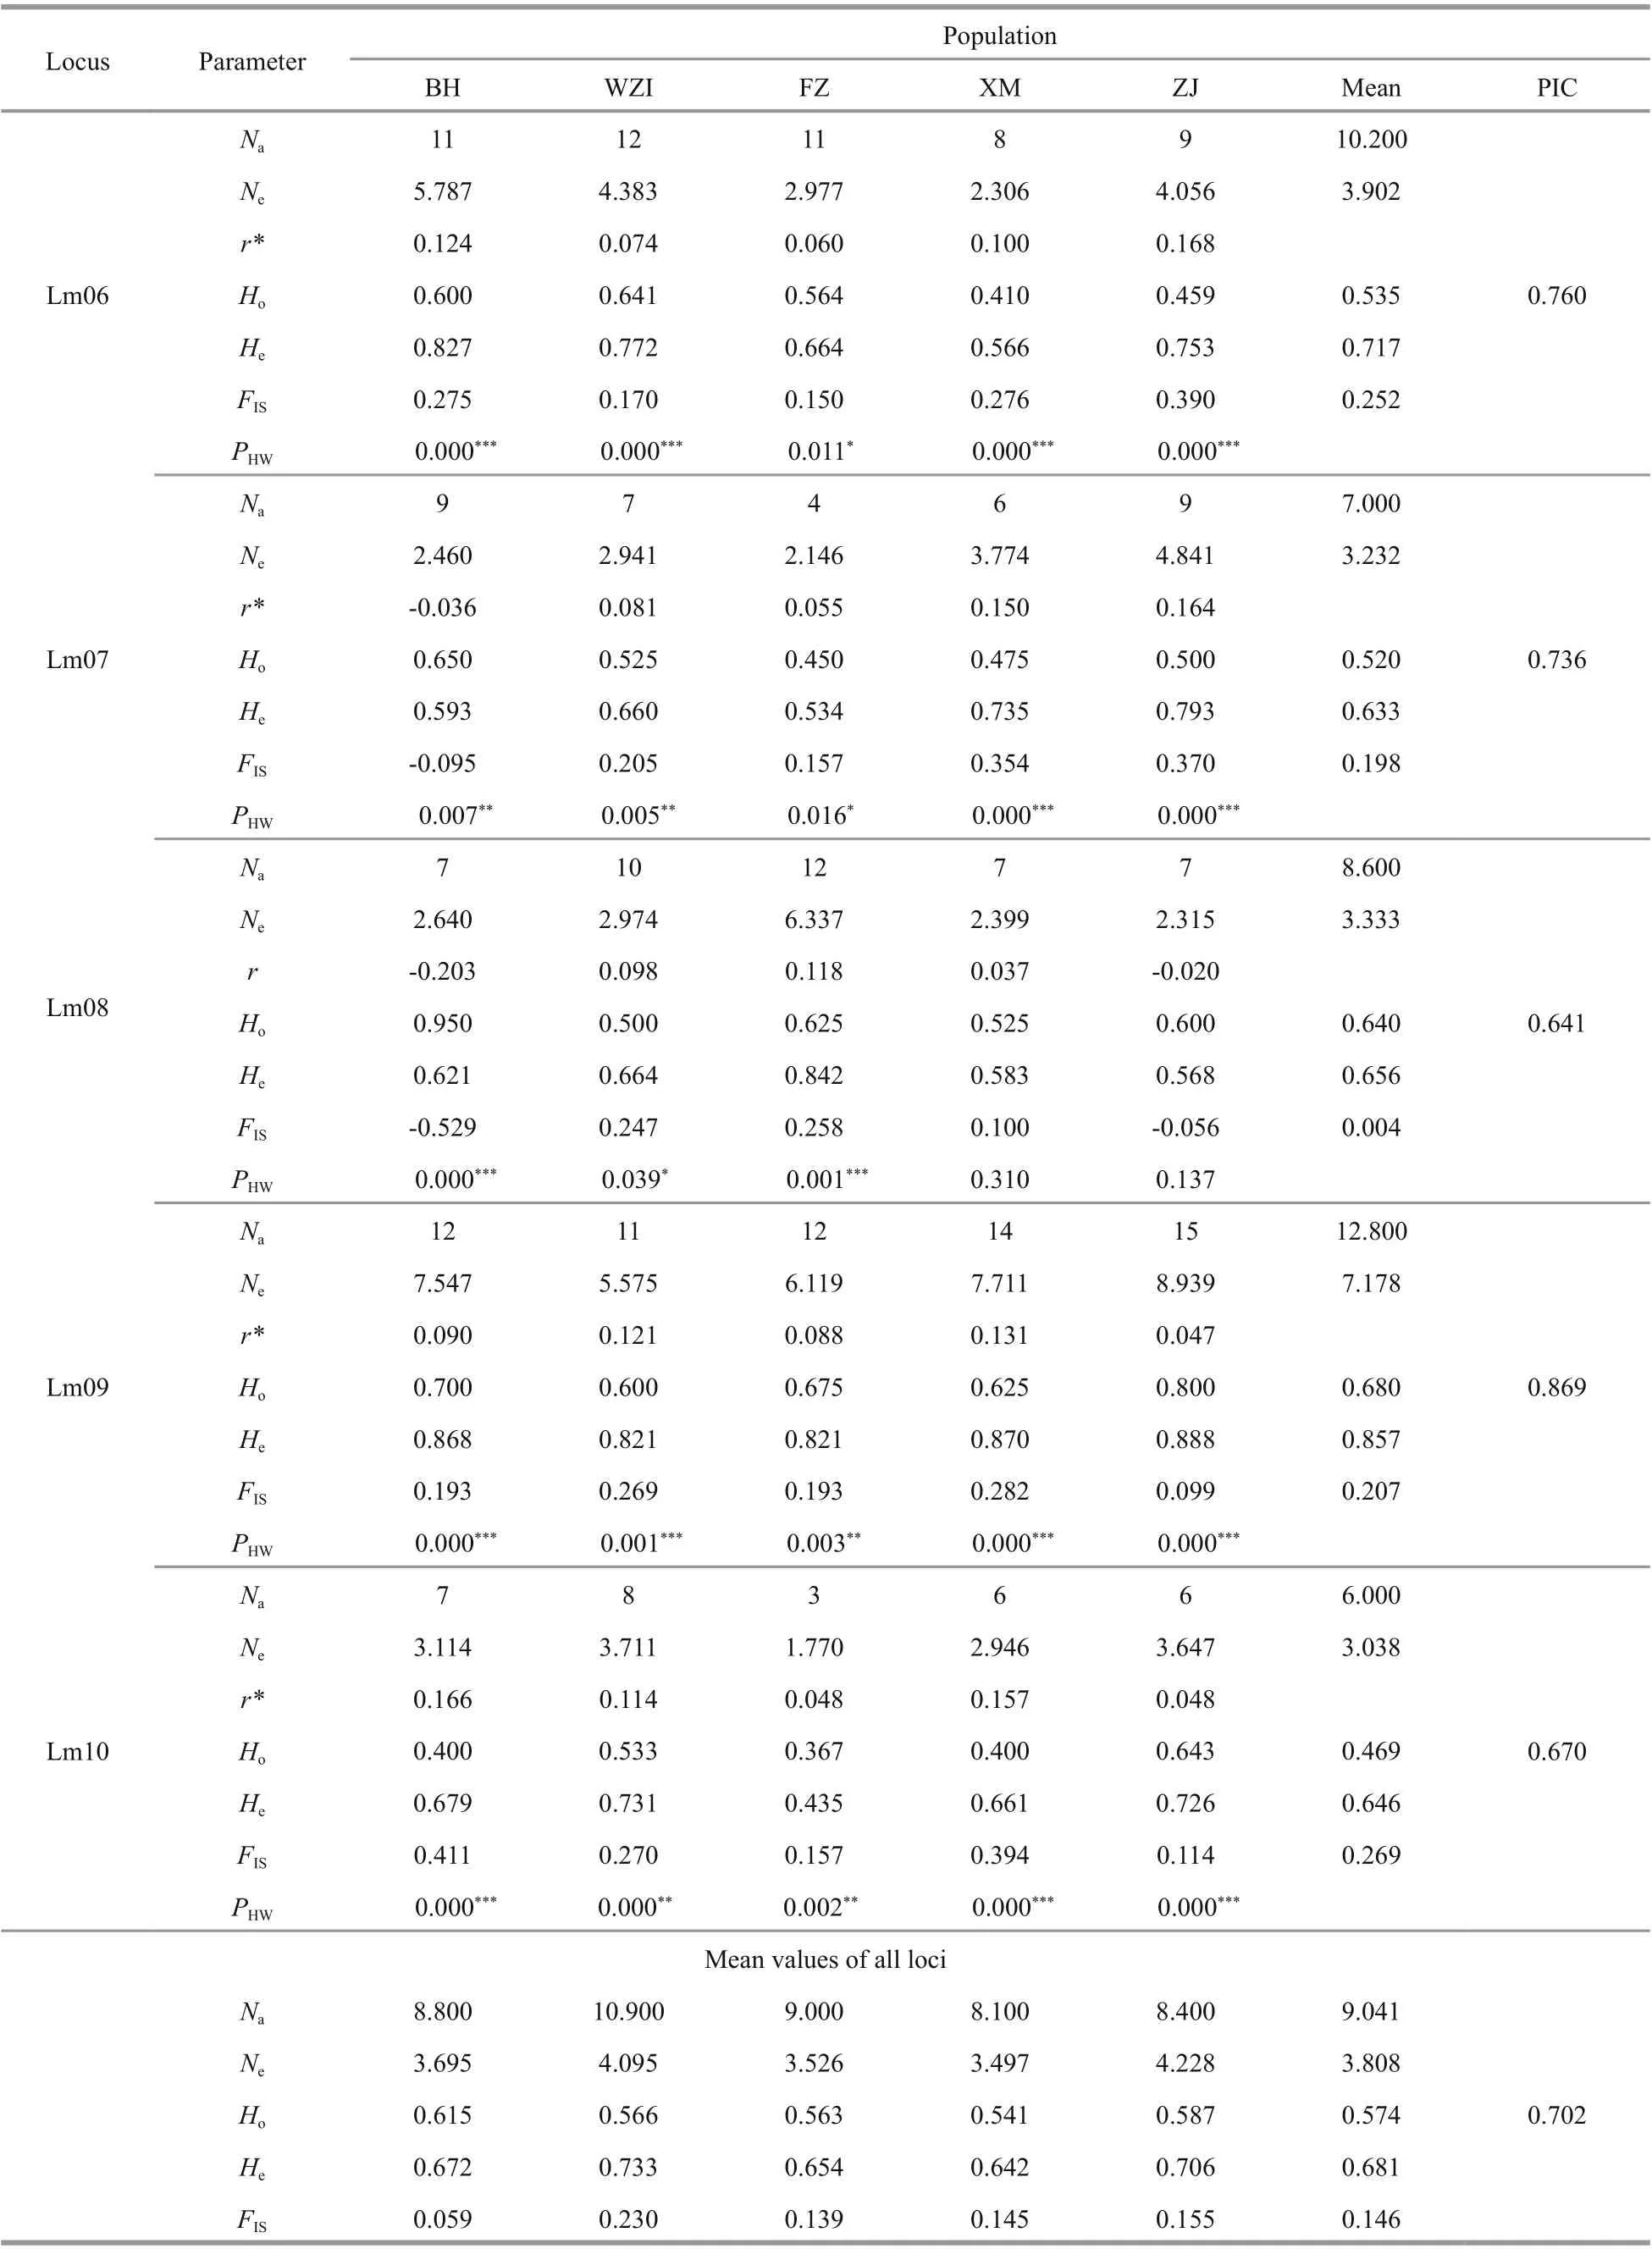
Table 5 Continued

Table 6 Pairwise F ST values and gene flow ( N M, in parentheses) (above diagonal), and Nei’s genetic distance (DA, below diagonal) among L. maxima populations based on analysis of 10 microsatellite markers
3.3.3 Genetic divergence and structure
Analysis of all pairwiseFSTstatistics showed significant diff erences (P<0.001) among the five populations. The highest divergence was between the BH and FZ populations (FST=0.139), while the lowest divergence was between the XM and ZJ populations(FST=0.027). The gene flow of five populations varied between 1.549 and 9.009 (Table 6). The analysis of molecular variance (AMOVA) showed that the genetic variation among and within populations was 12% and 88%, respectively (Table 7), indicating that genetic variation mainly came from within populations, but diff erent populations still had significant genetic diff erentiation.
Structure 2.3.4 was used to execute the hypotheticalKvalue of 1-7. The results were uploaded to Structure Harvester to determine the bestKvalue, andKand ΔKline chart andKand LnP(D) scatter plot were showed (Fig.4a & b). According to the trend analysis ofKvalue, whenK=2, ΔKhad a maximum value, and followed byK=3. Based on the value ofK=2, the population structure analysis showed that the five populations could be divided into two clusters,BH+WZI and FZ+XM+ZJ, at a certain degree of gene exchange between each population (Fig.4c). WhenK=3, individuals from BH and WZI populations were significantly diff erent from each other, and the other three populations were similar to some extents, in which XM and ZJ was the more similar (Fig.4d).
Based on the genetic distance (DA), two major branches were showed in the UPGMA tree (Fig.5),which was consistent with the result of the Structure analysis. The two populations (BH, WZI) from Beibu Gulf were clustered into one branch, the other three populations (FZ, XM, and ZJ) from the southeasterncoastal zones of China region were clustered in the middle of the tree, and among them, the XM and ZJ populations were the first to be gathered together.

Table 7 AMOVA analysis among diff erent populations of L. maxima based on analysis of ten microsatellite markers
4 DISCUSSION
Long-term geographical isolation and adaptability to diff erent environments result in certain reproductive isolation among diff erent geographical populations of the same species due to lack of genetic exchange, thus forming certain diff erences in their morphology,physiology, and genetics (Li et al., 2011b). To determine the management unit of a natural population, it is important to evaluate the diversity and structure of the population. Therefore, in the present study,L.maximafrom five populations were collected and used to analyze the population structure and diversity based on both morphology and microsatellite makers.
4.1 Microsatellite screening strategy
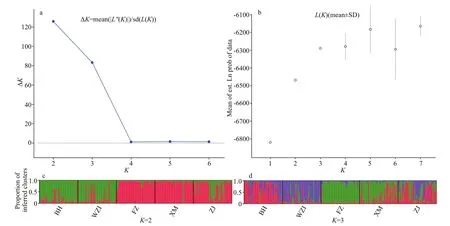
Fig.4 Genetic structure results of five populations of L. maxima based on ten microsatellite loci
Since Tautz and Renz (1984) reported microsatellite sequences obtained from various organisms,microsatellite markers have become one of the widely used genetic markers (Zhao et al., 2019). We used high-throughput sequencing to screen transcriptomederived microsatellite makers, which features fast,high effi ciency, strong transferability, correlation with potential genes, and large amount of data, thus accelerating the effi ciency of microsatellite maker development (Ma et al., 2014; Ueno et al., 2015).With the rapid development of sequencing technology and bioinformatics, more and more transcriptomederived microsatellite makers have been developed for aquatic animals, such asIctaluruspunctatus(Serapion et al., 2004),Carassiusauratusgibelio(Yue et al., 2004), andArgopectenirradians(Zhan et al., 2005), etc. In this study, 50 primers were designed and synthesized, and verified and analyzed in the individual genomic DNA ofL.maxima. Among them,28 pairs had amplification products and 10 microsatellite markers with high polymorphism were obtained, accounting for 35.7% of the total.Microsatellite marker polymorphisms are important to evaluate genetic diversity. Compared with the genome derived microsatellite markers, the transcriptome-derived microsatellite markers have low polymorphism due to stricter evolutionary restrictions (Ellis and Burke, 2007), but some studies show diff erent results (Yue et al., 2004). Polymorphic information content (PIC) is an important indicator of genetic diversity level (Botstein et al., 1980), and all loci in five populations were highly polymorphic due to PIC>0.5, suggesting higher polymorphisms and strong allelic variation inL.maximabased on transcriptome-derived microsatellite markers.Therefore, the 10 pairs of microsatellite primers obtained can be suitable for evaluating the genetic diversity and variation among populations.
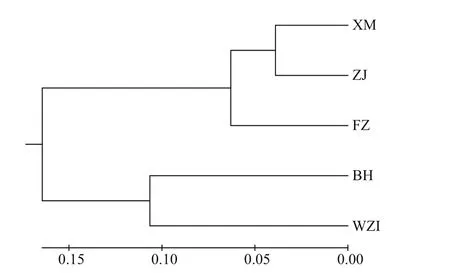
Fig.5 UPMGA dendrogram of L. maxima by Nei’s genetic distance based on ten microsatellite loci
4.2 Genetic diversity within population
Heterozygosity, also known as gene diversity, is generally considered the optimal parameter for assessing population variation at the genetic level(Nei et al., 1975). If the average heterozygosity of one population is higher than 0.5, it indicates that the population is not selected by high intensity and has rich genetic diversity, and vice versa (Li et al., 2010).Therefore, higher heterozygosity contributes to the richer genetic diversity of the species and the stronger adaptability to environments (Qin et al., 2013). In this study, the meanHeandHovalues in fiveL.maximapopulations range from 0.642 to 0.733 and 0.541 to 0.615, and the averageHe(0.681) was higher thanHo(0.574), indicating the loss of heterozygotes. The average eff ective allele number of five populations was high, suggesting thatL.maximahas a high genetic variation, which is conducive to the protection of germplasm resources, whereas populations with a low degree of genetic diff erentiation should be paid attention to strengthen protection measures (Qin et al., 2013). The meanNevalue in the fiveL.maximapopulations ranged from 3.497 to 4.228, further confirming the high genetic diversity of this species.High genetic diversity seems to be a common feature of marine bivalves, such asPinctadamaxima(Smith et al., 2003),Scapharcabroughtonii(An and Park,2005) andMizuhopectenyessoensis(Sato et al.,2005).
Moreover, in all populations,FISwas positive,suggesting the presence of null alleles (Pemberton et al., 1995). Microchecker software detected eight out of 10 loci with null alleles. This phenomenon has been reported on other shellfish, such asCrassostreagigasshowing null alleles in 51.9% (41/79) of microsatellite loci (Li et al., 2003a). In addition, null alleles lead to the loss of heterozygotes (Wanna et al.,2004), our results also showed that the five geographical populations deviated significantly from HWE at most of the detected loci. Selkoe and Toonen(2006) believe that loci with deviation from HWE would not have a significant impact on the subsequent analysis and should not be discarded. Some studies reveal that the loss of heterozygotes in aquatic animals is one factor to result in deviation from HWE (Evans et al., 2004). Therefore, it is speculated that there may be serious heterozygote deficiencies inL.maximapopulations, and the mating between individuals is probably not random. There may be several possible explanations for the deviation from HWE expectations.Firstly, human activities, such as overfishing, the introgression of cultured stocks and other reasons will lead to genetic balance deviation of wild population,eventually, loss of diversity and population viability(So et al., 2006). Secondly, in recent years, the rapid development of coastal areas along the southeast of China has led to the degradation of habitats and the reduction of eff ective populations, which may lead to certain inbreeding among individuals. Thirdly, it has been found that marine bivalves with longer larval stages have the higher dispersibility (Arnaud et al.,2000), and the migration and diff usion of the larvae will probably promote the gene exchange among geographical populations, and thus the migration of animals will promote the gene exchange among diff erent geographical populations. In addition,studies have shown that inbreeding, intra-population structure (Wahlund eff ect), and sampling bias are the causes of heterozygote deficiencies (Borsa et al.,1991; Gallardo et al., 1998; Wang et al., 2007; Cannas et al., 2012).
4.3 Genetic divergence and cluster among populations
Principal component analysis is an eff ective multivariate analysis method (Gibson et al., 1984;Voss et al., 1990). This study showed that the cumulative contribution rate of the first three principal components was 72.596%, which was lower than 85% (Eisenhour, 1999), indicating that diff erent populations ofL.maximacould not be completely correctly distinguished by morphological diff erences with several selected parameters, combined with discriminant analysis with 64% of the overall discriminant accuracy rate. The XM and FZ populations occupied the same overlap based on the geographic principal component analysis and the discriminant analysis, which indicated that the morphological characteristics between the two populations are hardly distinguishable.
Based on the morphological indicators, the Euclidean distance tree was constructed, showing that the BH and ZJ populations were first clustered together, and the XM, FZ, and WZI populations were clustered into one, which does not match the geographical locations of populations. BH and ZJ are separated by the Leizhou Peninsula and the Qiongzhou Strait, and WZI and BH are apart by a narrow sea, so there should be more genetic exchange between the WZI and BH populations. In fact, morphological diff erences are determined by both genetic and environmental factors, and sometimes environmental factors may be the dominant factors. Laudien et al.(2003) concluded that the morphological diff erences ofDonaxserraare determined by the characteristics of the geographical environment. Therefore, this study further explored relationships within populations and among populations based on microsatellite markers.
UPGMA analysis showed that the five populations were divided into two main clusters, Beibu Gulf group (Beihai and Weizhou Island) and the Southeast China Sea group (Zhanjiang, Xiamen, and Fuzhou),the reason may be that the current in Qiongzhou Strait mainly flows from east to west in all seasons, which definitely prevent theL.maximafrom expanding eastwards. However, the ZJ population is geographically the closest to the BH and WZI populations, but the ZJ population is the first to cluster with the XM and FZ populations. Because theL.maximahas a planktonic larval stage (Li et al.,2003b), we speculate that in summer, China Coastal Current flows northward, and has been flowing from the South China Sea to the East China Sea (Ni et al.,2014), thus strengthening the connection between the seas. The Structure results show that whenK=2, the ΔKvalue was the largest, which further corroborated the UPGMA dendrogram results. At the same time,we found that the two clusters had a low degree of mixing, and the diff erent clusters were relatively concentrated in Bayesian clustering In general, the genetic structure ofL.maximawas related to the geographical locations sampled, which the same water area promotes frequent gene exchanges,resulting in similar genetic structures.
Based on the pairwiseFSTvalues and the Nei’s genetic distance, it was found that there was significant moderate genetic diff erentiation between the BH and WZI populations located in Beibu Gulf, and the FZ and XM populations located in East China Sea(FST=0.097-0.139). During the Quaternary glacial period, the sea level in the East China Sea fell,promoting the formation of a land bridge between the mainland and Taiwan of China, and separating the East China Sea from the South China Sea and the Pacific Ocean (Ni et al., 2014). And Beibu Gulfis a semi-closed bay, which probably promotesL.maximapopulation to form independent refuges in the two seas, and blocks the genetic exchange of species between Beibu Gulf group (BH and WZI) and Southeast China Sea group (FZ and XM). Additionally,a low level of genetic diff erentiation (FST=0.027-0.048) was found among the FZ, XM, and ZJ populations located along the southeast coast of China with the distance of about 260-1 254 km. Guillemaud et al. (2003) believe that the diff erence of genetic diff erentiation is not obvious when the geographical distance is less than 60 km, but it is obvious when the geographical distance is 150-200 km, indicating that geographical distance may not be the main influencing factor. In the later period of the glacier, the global temperature rises, all marginal sea creatures recontact(Huang et al., 2015), thus the gene exchange results in the genetic diff erentiation of the species due to geographic isolation eliminated (Coope, 1979; Liu et al., 2011). This may be one reason for the formation of a cluster in the Southeast China Sea group (FZ,XM, and ZJ) and low genetic diff erentiation. Similarly,low levels of genetic diff erentiation are also detected in other marine bivalves, such asCrassostrearhizophorae(Ignacio et al., 2000),Cerastodermaglaucum(Mariani et al., 2002) andPectenjacobaeus(Ríos et al., 2002). Additionally, it has been reported that genetic variation ofChlamysfarreriis closely related to currents (Zhan et al., 2009). The eff ect of ocean currents on the diff usion ability of plankton larvae is also significant due to the large geographic distance span of the East China Sea and the extremely weak movement ability of plankton species (Lee and Boulding, 2009). Therefore, genetic diff erentiation among the FZ, XM, and ZJ populations was probably aff ected by the warm sea current in southeast China(Lambeck et al., 2002) since the larvae ofL.maximaare dispersed in a relatively large area during the planktonic life stage of about 12 days (Li et al.,2003b). Of course, the eff ect of human activities should be also considered.
AMOVA revealed that the genetic variation among populations was 12%, indicating that each population had significant genetic diff erentiation. Studies have shown that geographic diff erences may lead to diff erences in genetic structure and genetic diversity of marine shellfish populations (Kong et al., 2007).Some studies have also shown that environmental stress has a large impact on the population genetic structure of shellfish (Geist and Kuehn, 2005).Environmental diff erences in water temperature and salinity, etc. between Beibu Gulf group and Southeast China Sea group might also be one of the causes of genetic diff erentiation.
5 CONCLUSION
This study was the first attempt to elucidate the genetic characteristics ofL.maximapopulations in China. Ten polymorphic transcriptome-derived microsatellite markers combined with morphology were used to assess the genetic diversity and genetic diff erentiation among wildL.maximapopulations in China. The genetic diversity level of theL.maximapopulations in the southeastern coast of China remained relatively high, and moderate genetic diff erentiation has occurred. The fiveL.maximapopulations exhibited high genetic diversity as indicated by the highNe,He, andHo, indicating the germplasm resources were in good condition.Moderate levels of genetic diff erentiation were detected between BH and WZI populations located in the Beibu Gulf, and FZ, XM, and ZJ populations located in the East China Sea, which gain support also by UPGMA tree and the Structure analysis. However,with the continuous development and utilization of fishery resources, the scope of fishing is gradually expanding, and the fishery resources of wild species show a trend of gradual decline. Therefore, it is necessary to protect them against further decline in genetic diversity. Our results suggested that populations from the two regions ofL.maximashould be considered as separate units in fishery management,which will provide certain references for establishment of protection strategy ofL.maxima.
6 DATA AVAILABILITY STATEMENT
Data are available on request from the authors.
7 CONFLICT OF INTEREST
The authors declare no conflict ofinterest to each other.
杂志排行
Journal of Oceanology and Limnology的其它文章
- Numerical study of the seasonal salinity budget of the upper ocean in the Bay of Bengal in 2014*
- Study on evaluation standard of uncertainty of design wave height calculation model*
- A fast, edge-preserving, distance-regularized model with bilateral filtering for oil spill segmentation of SAR images*
- A Gaussian process regression-based sea surface temperature interpolation algorithm*
- Climatology and seasonal variability of satellite-derived chlorophyll a around the Shandong Peninsula*
- Sources of sediment in tidal flats off Zhejiang coast, southeast China*
