Species-specific detection and quantification of scyphomedusae in Jiaozhou Bay, China, using a quantitative real-time PCR assay*
2021-07-29JianyanWANGTiezhuMIZhigangYUGuoshanWANGQinshengWEIJingYANGYuZHEN
Jianyan WANG , , Tiezhu MI ,4, Zhigang YU , Guoshan WANG, Qinsheng WEI,Jing YANG , Yu ZHEN ,4,**
1 Department of Science Research, Beijing Museum of Natural History, Beijing 100050, China
2 Laboratory for Marine Ecology and Environmental Science, Pilot National Laboratory for Marine Science and Technology(Qingdao), Qingdao 266237, China
3 Key Laboratory of Marine Environment and Ecology, Ministry of Education, Ocean University of China, Qingdao 266100, China
4 College of Environmental Science and Engineering, Ocean University of China, Qingdao 266100, China
5 Key Laboratory of Marine Chemistry Theory and Technology, Ministry of Education/Institute for Advanced Ocean Study, Ocean University of China, Qingdao 266100, China
6 National Marine Hazard Mitigation Service, Ministry of Natural Resources, Beijing 100194, China
7 First Institute of Oceanography, Ministry of Natural Resources, Qingdao 266061, China
Abstract Over the past decades, jellyfish occurred increasingly and abundantly in coastal areas worldwide.Usually, biomass of jellyfish, especially when they bloom, can be determined by visual counting. However,tiny individuals of jellyfish (e.g., planulae, polyps, and ephyrae) are diffi cult to detect in the field. In this study,species-specific quantitative real-time PCR assays (qPCR) (SYBR Green I) targeting the mitochondrial 16S rDNA (mt-16S rDNA) of jellyfish were developed and were used to estimate the distribution and seasonal fluctuations of four jellyfish species ( Nemopilema nomurai, Cyanea nozakii, Rhopilema esculentum, and Aurelia coerulea) in Jiaozhou Bay (JZB), China in 2013. The mt-16S rDNA of A. coerulea and N. nomurai was detected in most of the survey months and it peaked in July (1.03×10⁴ copies/L) and September(1.08×10⁶ copies/L), respectively. The mt-16S rDNA of C. nozakii occurred from August to October only with monthly mean values of 7.18-46.17 copies/L and was mainly located from the middle part to the outer part of the bay. The mt-16S rDNA of R. esculentum was the least abundant among the four species and was detected in only one sample (B2 station in March), with a value of 88.49 copies/L. The Spearman correlation test revealed that phytoplankton biomass was significantly and positively correlated with the mt-16S rDNA abundance of A. coerulea ( R= 0.37, P <0.01) and negatively with the mt-16S rDNA of N. nomurai ( R=-0.36,P <0.01). The qPCR assay will enable the identification and quantification of jellyfish species in their whole life history and can be used as an approach in combination of the traditional jellyfish survey.
Keyword: jellyfish bloom; Aurelia coerulea; Nemopilema nomurai; Cyanea nozakii; Rhopilema esculentum;mitochondrial 16S rDNA
1 INTRODUCTION
Recently, jellyfish blooms have attracted great attention due to their negative eff ects on social and environmental safety (Mills, 2001; Purcell, 2005;Purcell et al., 2007; Richardson et al., 2009). Jellyfish blooms are abnormal phenomena in marine ecosystems occurring in response to environmental changes, such as eutrophication, climate change,overfishing and anthropogenic disturbance (Dong et al., 2010; Condon et al., 2013). When blooming,abundant jellyfish clog the intakes of power plants,split fishing nets, kill fish in aquaculture pens, and even sting swimmers and tourists (Purcell et al.,2007). Jellyfish blooms also greatly aff ect marine ecosystems by preying on zooplankton and indirectly causing phytoplankton blooms (Møller and Riisgård,2007).
Jellyfish blooms can be predicted if tiny individuals in the early stage oflife history (e.g., planulae, polyps,and ephyrae) are identifiable in plankton samples(Holst, 2012); however, data on tiny individuals have been largely absent. The main reason underlying the lack of those data is the challenge of species identification, as identification of the tiny individuals to the species level in the field is nearly impossible.Though some studies have described the morphology of ephyrae of jellyfish (Russell, 1970; Straehler-Pohl and Jarms, 2010; Holst, 2012), such identification remains diffi cult for non-specialists. As medusae are asexually reproduced by polyps, if the polyps can be detected in situ, the monitoring of medusa population dynamics will be much easier (Gröndahl, 1988;Miyake et al., 1997; Di Camillo et al., 2010); however,polyps are small-sized (ca. 200 μm) and benthic organisms, and they are diffi cult to find within substrates.
With the development of DNA barcoding, the mitochondrial cytochrome c oxidase (mt-COI) gene,mitochondrial 16S rRNA gene (mt-16S rDNA) and nuclear DNA have been commonly used for species identification, as well as for Cnidarian species (Bayha and Graham, 2009; Ki et al., 2010; Armani et al.,2014; Liu et al, 2016; Lamb et al., 2017; Gong et al.,2018). Quantitative real-time PCR (qPCR) has also been attempted to detect and qualify jellyfish by tracing environmental DNA (eDNA) (Bayha and Graham, 2009; Marques et al., 2019). The spatial and temporal distributions of sea nettle jellyfishChrysaora pacificawere surveyed in Omura Bay, Kyushu, Japan by detecting eDNA using a qPCR method (Taqman probe) (Minamoto et al., 2017; Takasu et al., 2019).
We previously developed a qPCR assay (SYBR Green I) to identify and quantifyAureliacoeruleain field samples from Jiaozhou Bay (JZB), and the results revealed that the values of mt-16S rDNA were nicely consistent with the abundance of medusa(Wang et al., 2015). In the present study, we constructed another three qPCR assays (SYBR Green I), which were species-specific forNemopilema nomurai,Cyanea nozakii, andRhopilema esculentum.We had three primary objectives: (1) to analyze the spatial and temporal distributions of giant jellyfish in JZB using qPCR methods, (2) to analyze relationships between environmental factors and jellyfish abundance, and (3) to yield a better understanding of jellyfish origin or habitat preference in JZB.
2 MATERIAL AND METHOD
2.1 Determination of species-specific qPCR assay(SYBR Green I)
Medusae ofN.nomuraiandC.nozakiiwere captured in JZB in July 2011. Specimens were placed in a bucket filled with the ambient seawater and transported to the laboratory. Medusae ofR.esculentumwere donated by the Laboratory of Mariculture Ecology and Carrying Capacity of the Yellow Sea Fisheries Research Institute (Qingdao,China). Genomic DNA was extracted, stored,amplified, cloned, and sequenced as described in Wang et al. (2015). The mt-16S rDNA fragments(650 bp) of the three jellyfish species were amplified using the 16Sf and 16Sr primers (16Sf:5′-TCGACTGTTTACCAAAAACATAGC-3′ and 16Sr: 5′-ACGGAAT-GAACTCAAATCATGTAAG-3′)(Bridge et al., 1992). Recombinant plasmids carrying the target fragments were extracted and confirmed by the sequencing results. The mt-16S rDNA fragments ofR.esculentum,N.nomurai, andC.nozakiiwere submitted to GenBank under accession numbers JX845342, JX845343, and JX845345.
Mt-16S rDNA sequences of the three scyphomedusae species were aligned with other closely related jellyfish species downloaded from GenBank, using ClustalX 1.81. Primers were then designed by Primer Premier 6.0 software based on the alignment results, and the specificity of designed primers was checked by Primer-BLAST in silico. The specificity of primers was then validated by gel electrophoresis of the conventional PCR product by using DNA of six common scyphomedusae species in China (A.coerulea,N.nomurai,C.nozakii,R.esculentum,Acromitussp., andPhacellophorasp.). The protocol used for conventional PCR cycling is as follows: 95 °C for 3 min, followed by 35 cycles of 95 °C for 30 s, 55-61 °C for 30 min, and 72 °C for 1 min and a final step of 72 °C for 7 min.
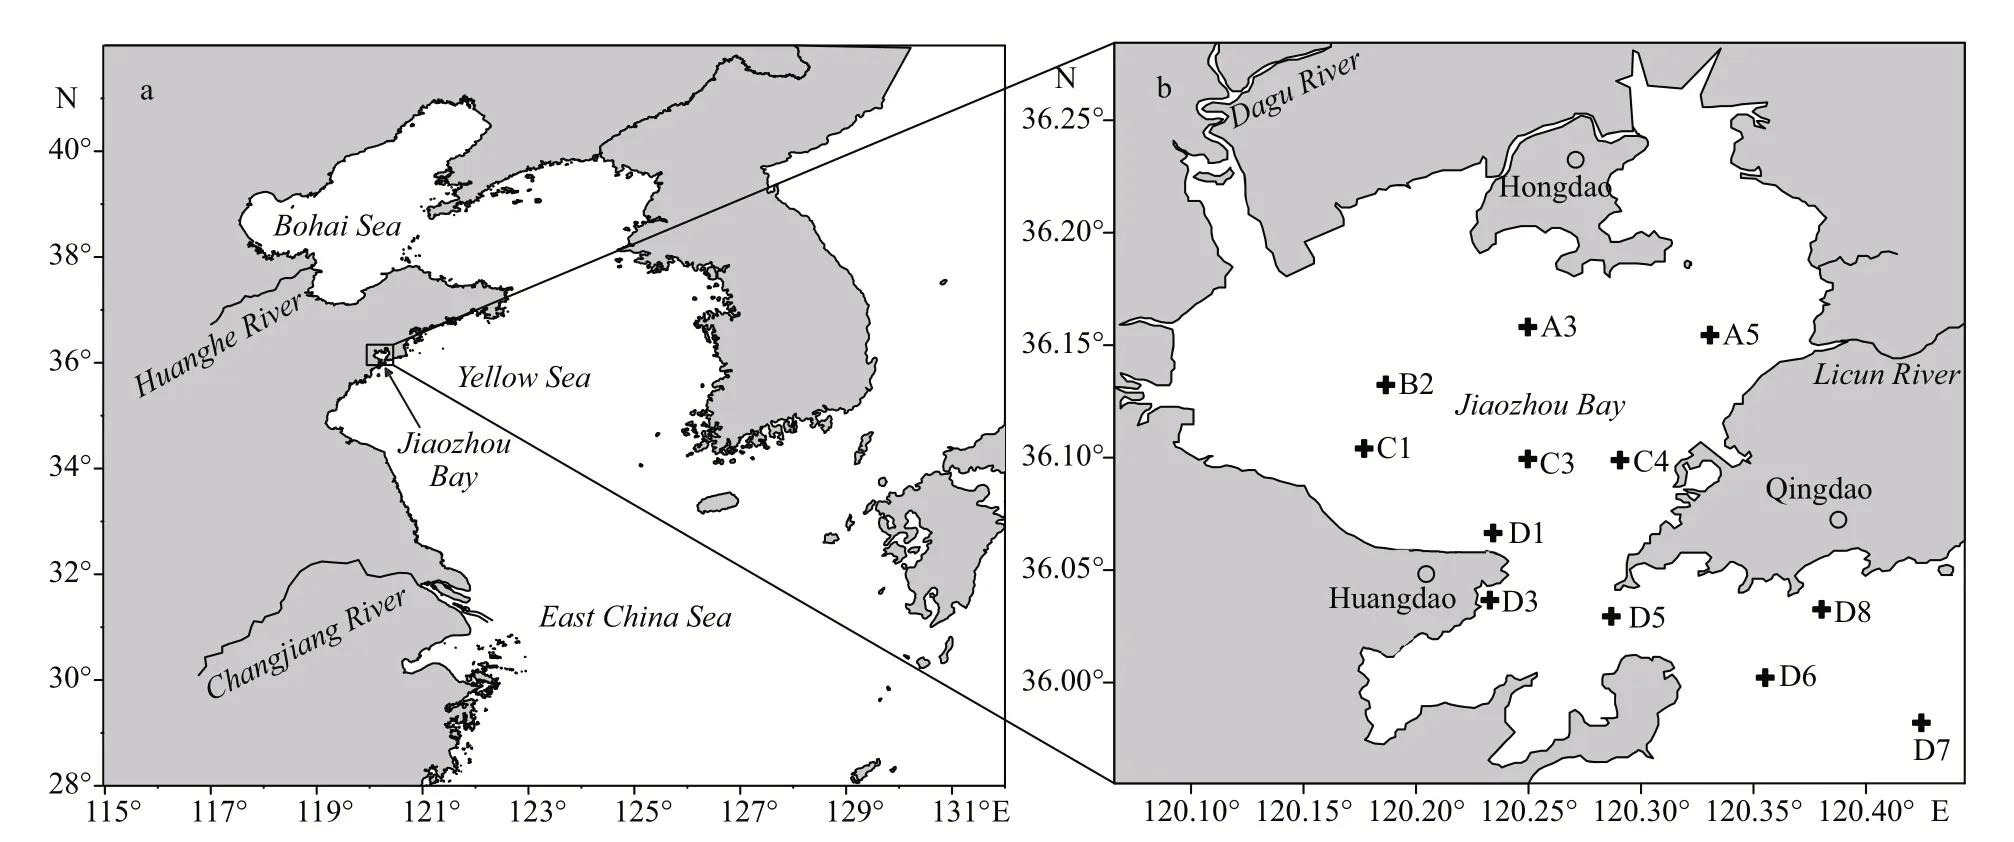
Fig.1 Maps showing the location (a) and the sampling stations in Jiaozhou Bay (b)
Species-specific primers with good performance,e.g., amplification of only the target DNA, high amplification effi ciency and no primer dimers were chosen, and their specificities were further verified by a qPCR assay using recombinant plasmids in the same concentration (106copies/L) for the six jellyfish species mentioned above. The optimized qPCR assay was conducted in a final volume of 30 μL containing 15 μL of 1× FastStart Universal SYBR Green Master (ROX)(Roche Life Science Ltd., Mannheim, Germany),0.9 μL of primers (at a final concentration of 0.3 μmol/L), 10.2 μL ddH2O, and 3 μL of template DNA on an Applied Biosystems®7500 real-time PCR System (Applied Biosystems, California, USA). The following qPCR cycling protocol was used: 95 °C for 10 min, followed by 40 cycles of 95 °C for 15 s and 60 °C for 1 min. The specificity was validated by amplification and melting profiles of the qPCR reaction.
2.2 Construction of calibrators and qPCR assay performance
Recombinant plasmids carrying the target mt-16S rDNA were used as quantification calibrators.Concentration of the plasmid DNA was measured by a Picodrop microliter spectrophotometer (Picodrop,Essex, UK). Dilutions of the plasmid solution were carried to obtain a series of standard samples ranged from 10 to 108copies. The qPCR assay was performed in triplicate. The no-template controls (NTCs) were added in each run to detect PCR contamination.
The calibration curve was established with the threshold cycle (Ct) values against the denary logarithms of the recombinant plasmid copy numbers(lgNplasmid). The qPCR amplification effi ciency was calculated based on the slopes from the calibration curve according to the equationE=10(-1/slope)-1.
2.3 Analysis of field samples
Plankton samples were collected monthly from March to November in 2013 at the monitoring stations in JZB. The sampling stations were shown in Fig.1.Five liters of surface seawater were filtered through a 76-μm mesh net. The filtered net was stored at -70 °C to be used for DNA extraction and qPCR analysis.Total DNA from the plankton samples was extracted with the same method described in Wang et al. (2015).A 100-fold dilution of the sample DNA combined with a final concentration of 0.2 μg/μL bovine serum albumin (BSA) in the qPCR reaction mixture was used to remove inhibitors from the field sample, as we have optimized in Wang et al. (2015).
Mt-16S rDNA copy number was obtained by plotting the averageCtvalues of each sample (run in triplicate) versus calibration curves through qPCR analysis. Additionally, positive results were further approved by sequencing the qPCR products. In addition toN.nomurai,C.nozakii, andR.esculentum,A.coerulea, another scyphomedusae that commonly exists in JZB, was also quantified in the present study using the qPCR assay developed in Wang et al. (2015).
2.4 Determination of environmental factors
Environmental factors such as temperature (Tem),salinity (Sal), nutrients, chlorophylla(Chla), and phytoplankton and zooplankton abundance were determined and used for bio-environmental analysis in this study. Water column profiles of temperature and salinity were measured with an AAQ1183-1Fconductivity, temperature, and depth (CTD) meter(Alec Electronics Co., Japan). Other chemical parameters were analyzed in the laboratory. The Chlaconcentrations were measured with a Turner Designs Model 7200 fluorometer. Dissolved inorganic nutrients, i.e., soluble reactive phosphorus (SRP),soluble reactive silicate (SRSi), and total nitrogen(TN) were determined using a QuAAtro-SFA analyzer(Bran-Lubbe Co., Germany). The phytoplankton and zooplankton samples were collected by vertical tows of plankton nets with mesh sizes of 70 and 500 μm,respectively, from near the bottom to the surface.

Table 1 Primers designed in this study

Table 2 Standard curves used in this study
2.5 Statistical analysis
The relationships between the environmental parameters and jellyfish mt-16S rDNA abundance were determined by redundancy analysis (RDA) and Spearman correlation analysis. Parameters entered into the RDA were normalized through a logarithmic transformation. RDA and Spearman analysis were performed using R software (version 3.4.3) (R Core Team, 2008).
3 RESULT
3.1 Determination of the species-specific qPCR assay
Species-specific primers for the three jellyfishN.nomurai,C.nozakii, andR.esculentumwere determined by Primer-BLAST in silico, and melting and amplification profiles of qPCR reaction(Supplementary Figs.S1-S2). Details of the designed primers were listed in Table 1.
Standard curves were constructed using 10-fold serial dilutions of recombinant plasmids containing the mt-16S rDNA fragments ofN.nomurai,C.nozakii, andR.esculentum, respectively. A strong linear relationship betweenCtand the denary logarithm of plasmid copy number was demonstrated(R2>0.99) for all standard curves (Table 2). The amplification effi ciency of the real-time PCR ranged from 89.54% to 98.64%.
3.2 Temporal and spatial dynamics of scyphomedusae mt-16S rDNA in Jiaozhou Bay
Temporally, mt-16S rDNA ofN.nomuraiwas detected in every month throughout the survey period, with monthly average abundances ranging from 46.63 to 1.08×10⁶copies/L. The monthly abundance was low in spring (ranging from 46.63 to 6.61×10²copies/L, with the lowest value of 46.63 copies/L in March), increased in summer,peaked in autumn (in September, with a value of 1.08×10⁶copies/L), decreased in October, and then returned to hundreds of copies per liter in November(Fig.2a). Mt-16S rDNA ofA.coeruleawas detected in six of the total eight months throughout the survey period; the abundance was low in spring (zero to several copies per liter), high in summer (max.1.03×104copies/L), and reduced to several copies per liter again in autumn (Fig.2b). The abundance ofC.nozakiimt-16S rDNA was low during the surveyperiod and was detected only during three months(August to October), with monthly mean values of
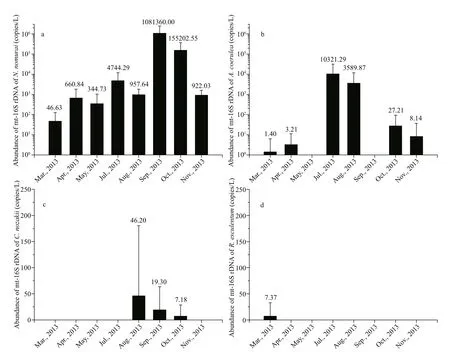
Fig.2 Temporal variation in the mt-16S rDNA of N. nomurai(a), A. coerulea(b), C. nozakii(c), and R. esculentum(d) in the surface water of Jiaozhou Bay sampled from March to November 2013
46.17, 19.29, and 7.18 copies/L, respectively(Fig.2c). The mt-16S rDNA ofR.esculentumwas the least abundant among the four species and was detected in only one sample (B2 in March), with a value of 88.49 copies/L (Fig.2d).
Spatially, mt-16S rDNA ofN.nomurairevealed an inconsistent distribution in JZB, and higher abundances were detected mostly in the outer bay.N.nomuraiwas first detected in March 2013 at four stations (C1, C4, D5, and D7) with an abundance ranging from 43.91 to 2.16×10²copies/L (Fig.3a).N.nomuraiwidely distributed in April with the highest abundances located at D8 (4.13×10³copies/L)(Fig.3b). In May,N.nomuraimainly occurred at the inner and the mouth of the bay with the highest value at the D3 station (Fig.3c). In July, mt-16S rDNA ofN.nomuraiwas detected in all stations, occurring abundantly (104copies/L) in the outer and the mouth of the bay and was less abundant (102copies/L) in the inner bay (Fig.3d).N.nomuraiwas distributed evenly in JZB in August with concentrations of 102-103copies/L (Fig.3e). Abundance of mt-16S rDNA ofN.nomuraiincreased abruptly in September in JZB,and peak values with a concentration of 106copies/L mostly occurred at the outer bay (D6, D7, and D8)and two inner stations (A3 and C3) (Fig.3f). Mt-16S rDNA ofN.nomuraishowed an even distribution in October and November, and the abundance decreased gradually from September to November (Fig.3g-h).
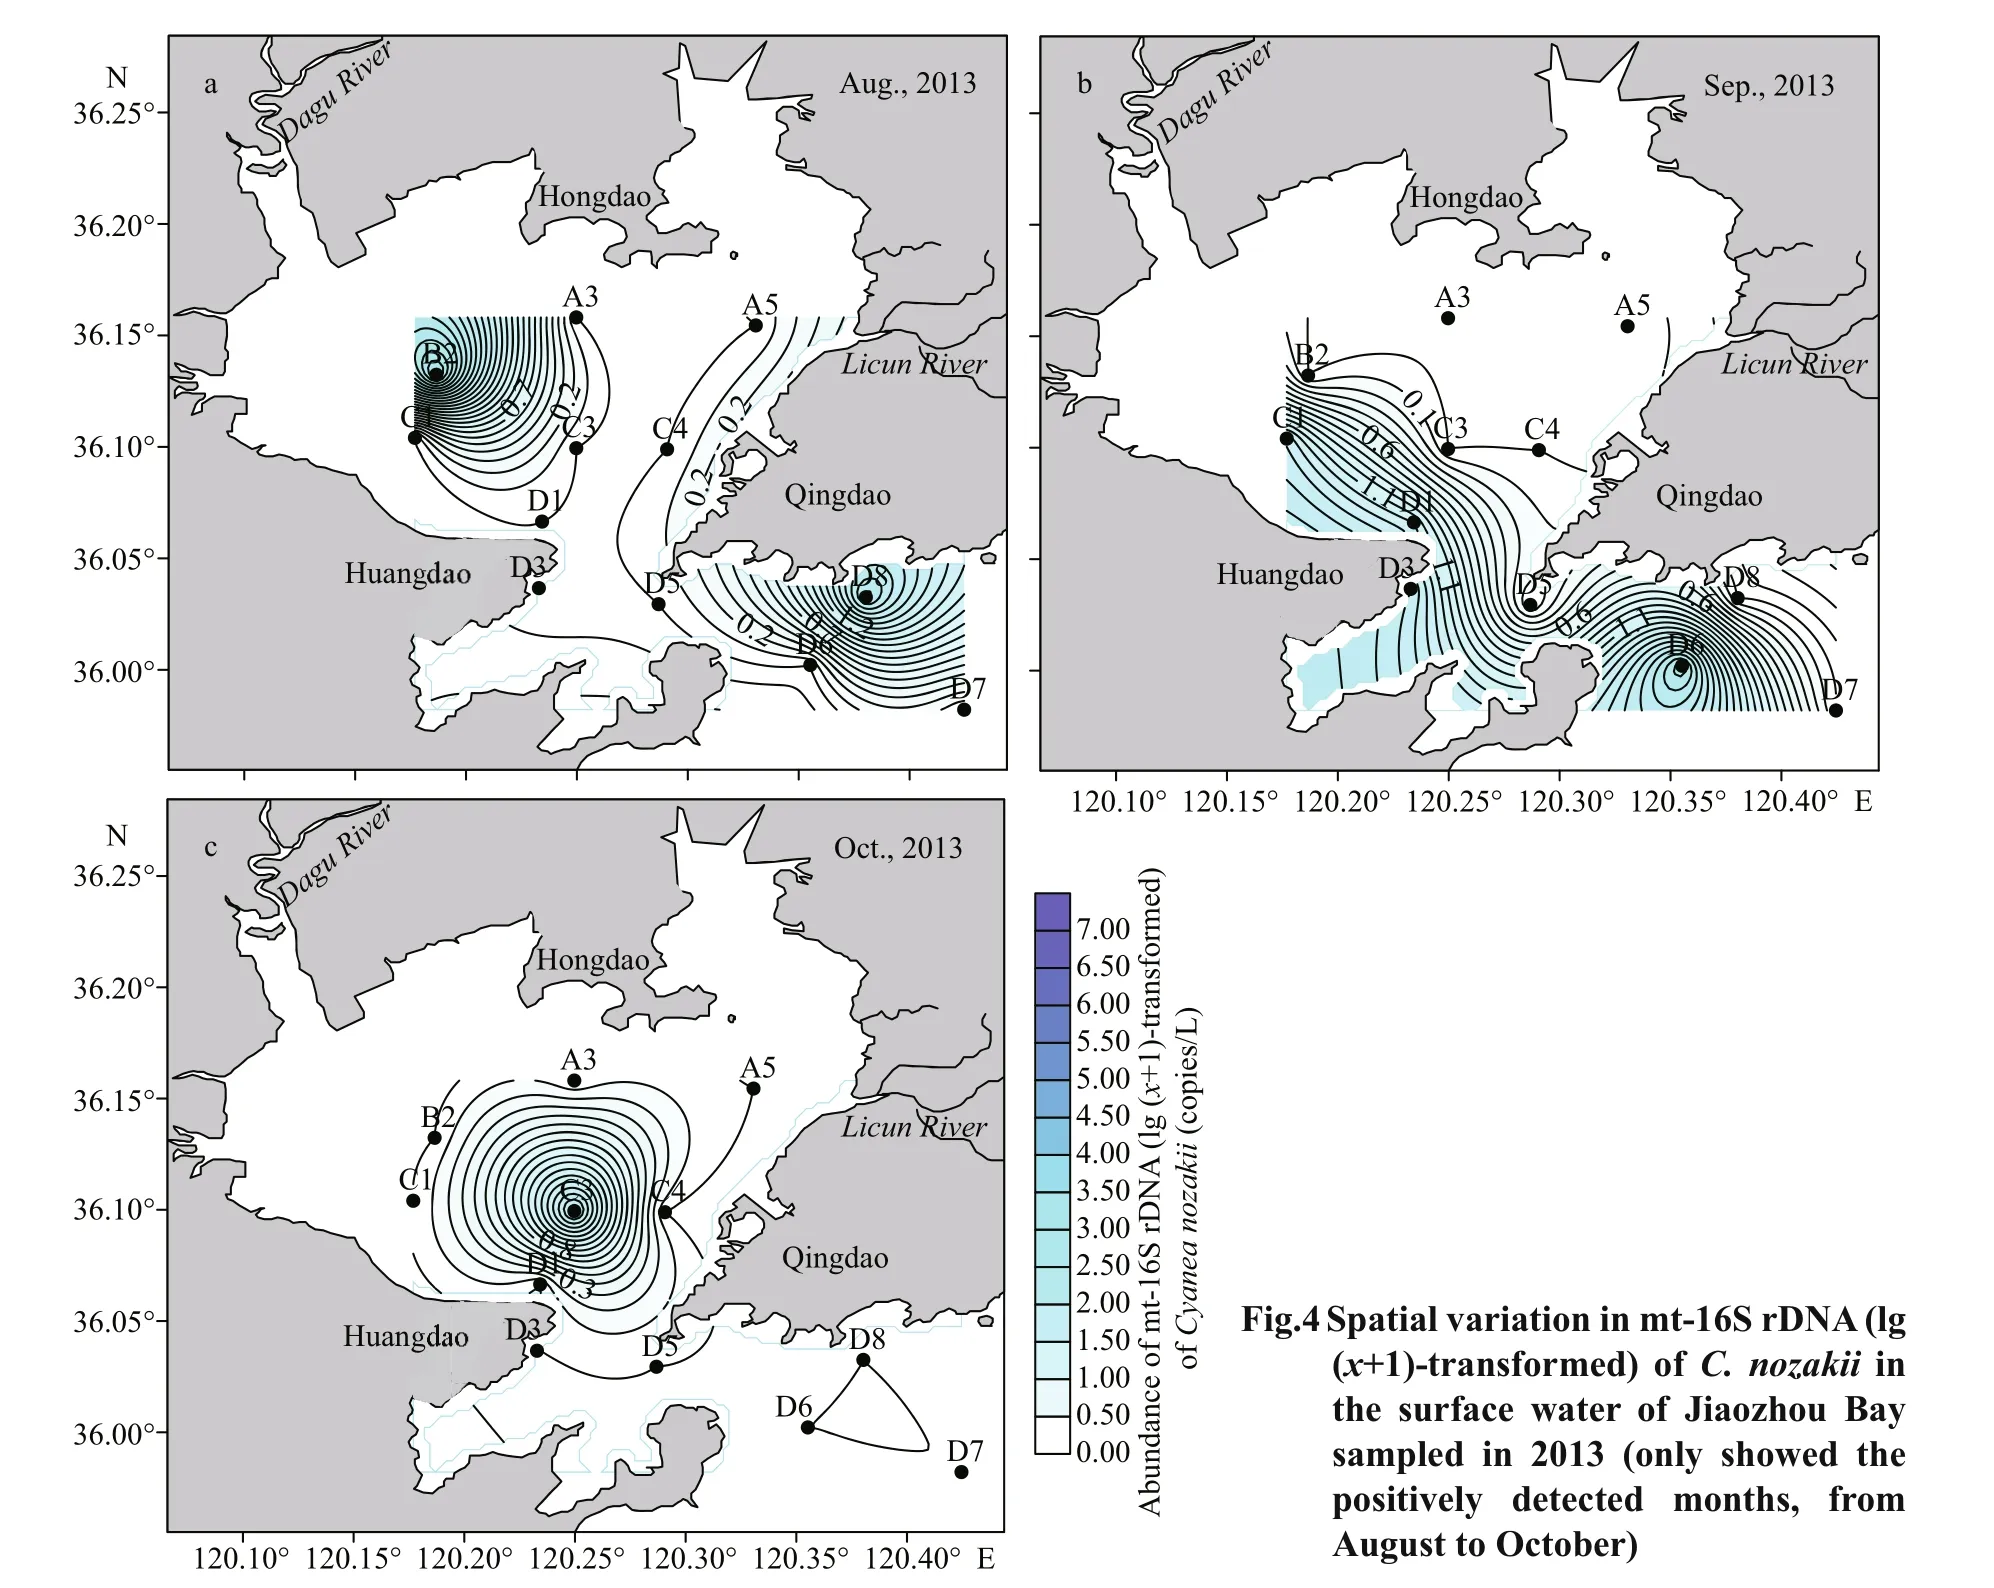
Mt-16S rDNA ofC.nozakiioccurred in only seven samples in JZB in 2013, with an uneven spatial distribution and low abundance. Mt-16S rDNA ofC.nozakiiwas positively detected at B2 and D8 stations in August (Fig.4a), at C1, D1, D3, and D6 stations in September (Fig.4b), and at C3 in October(Fig.4c). The stations where mt-16S rDNA ofC.nozakiiwas positively detected were mainly located from the middle part to the outer part of the bay and rarely in the inner part of the bay.
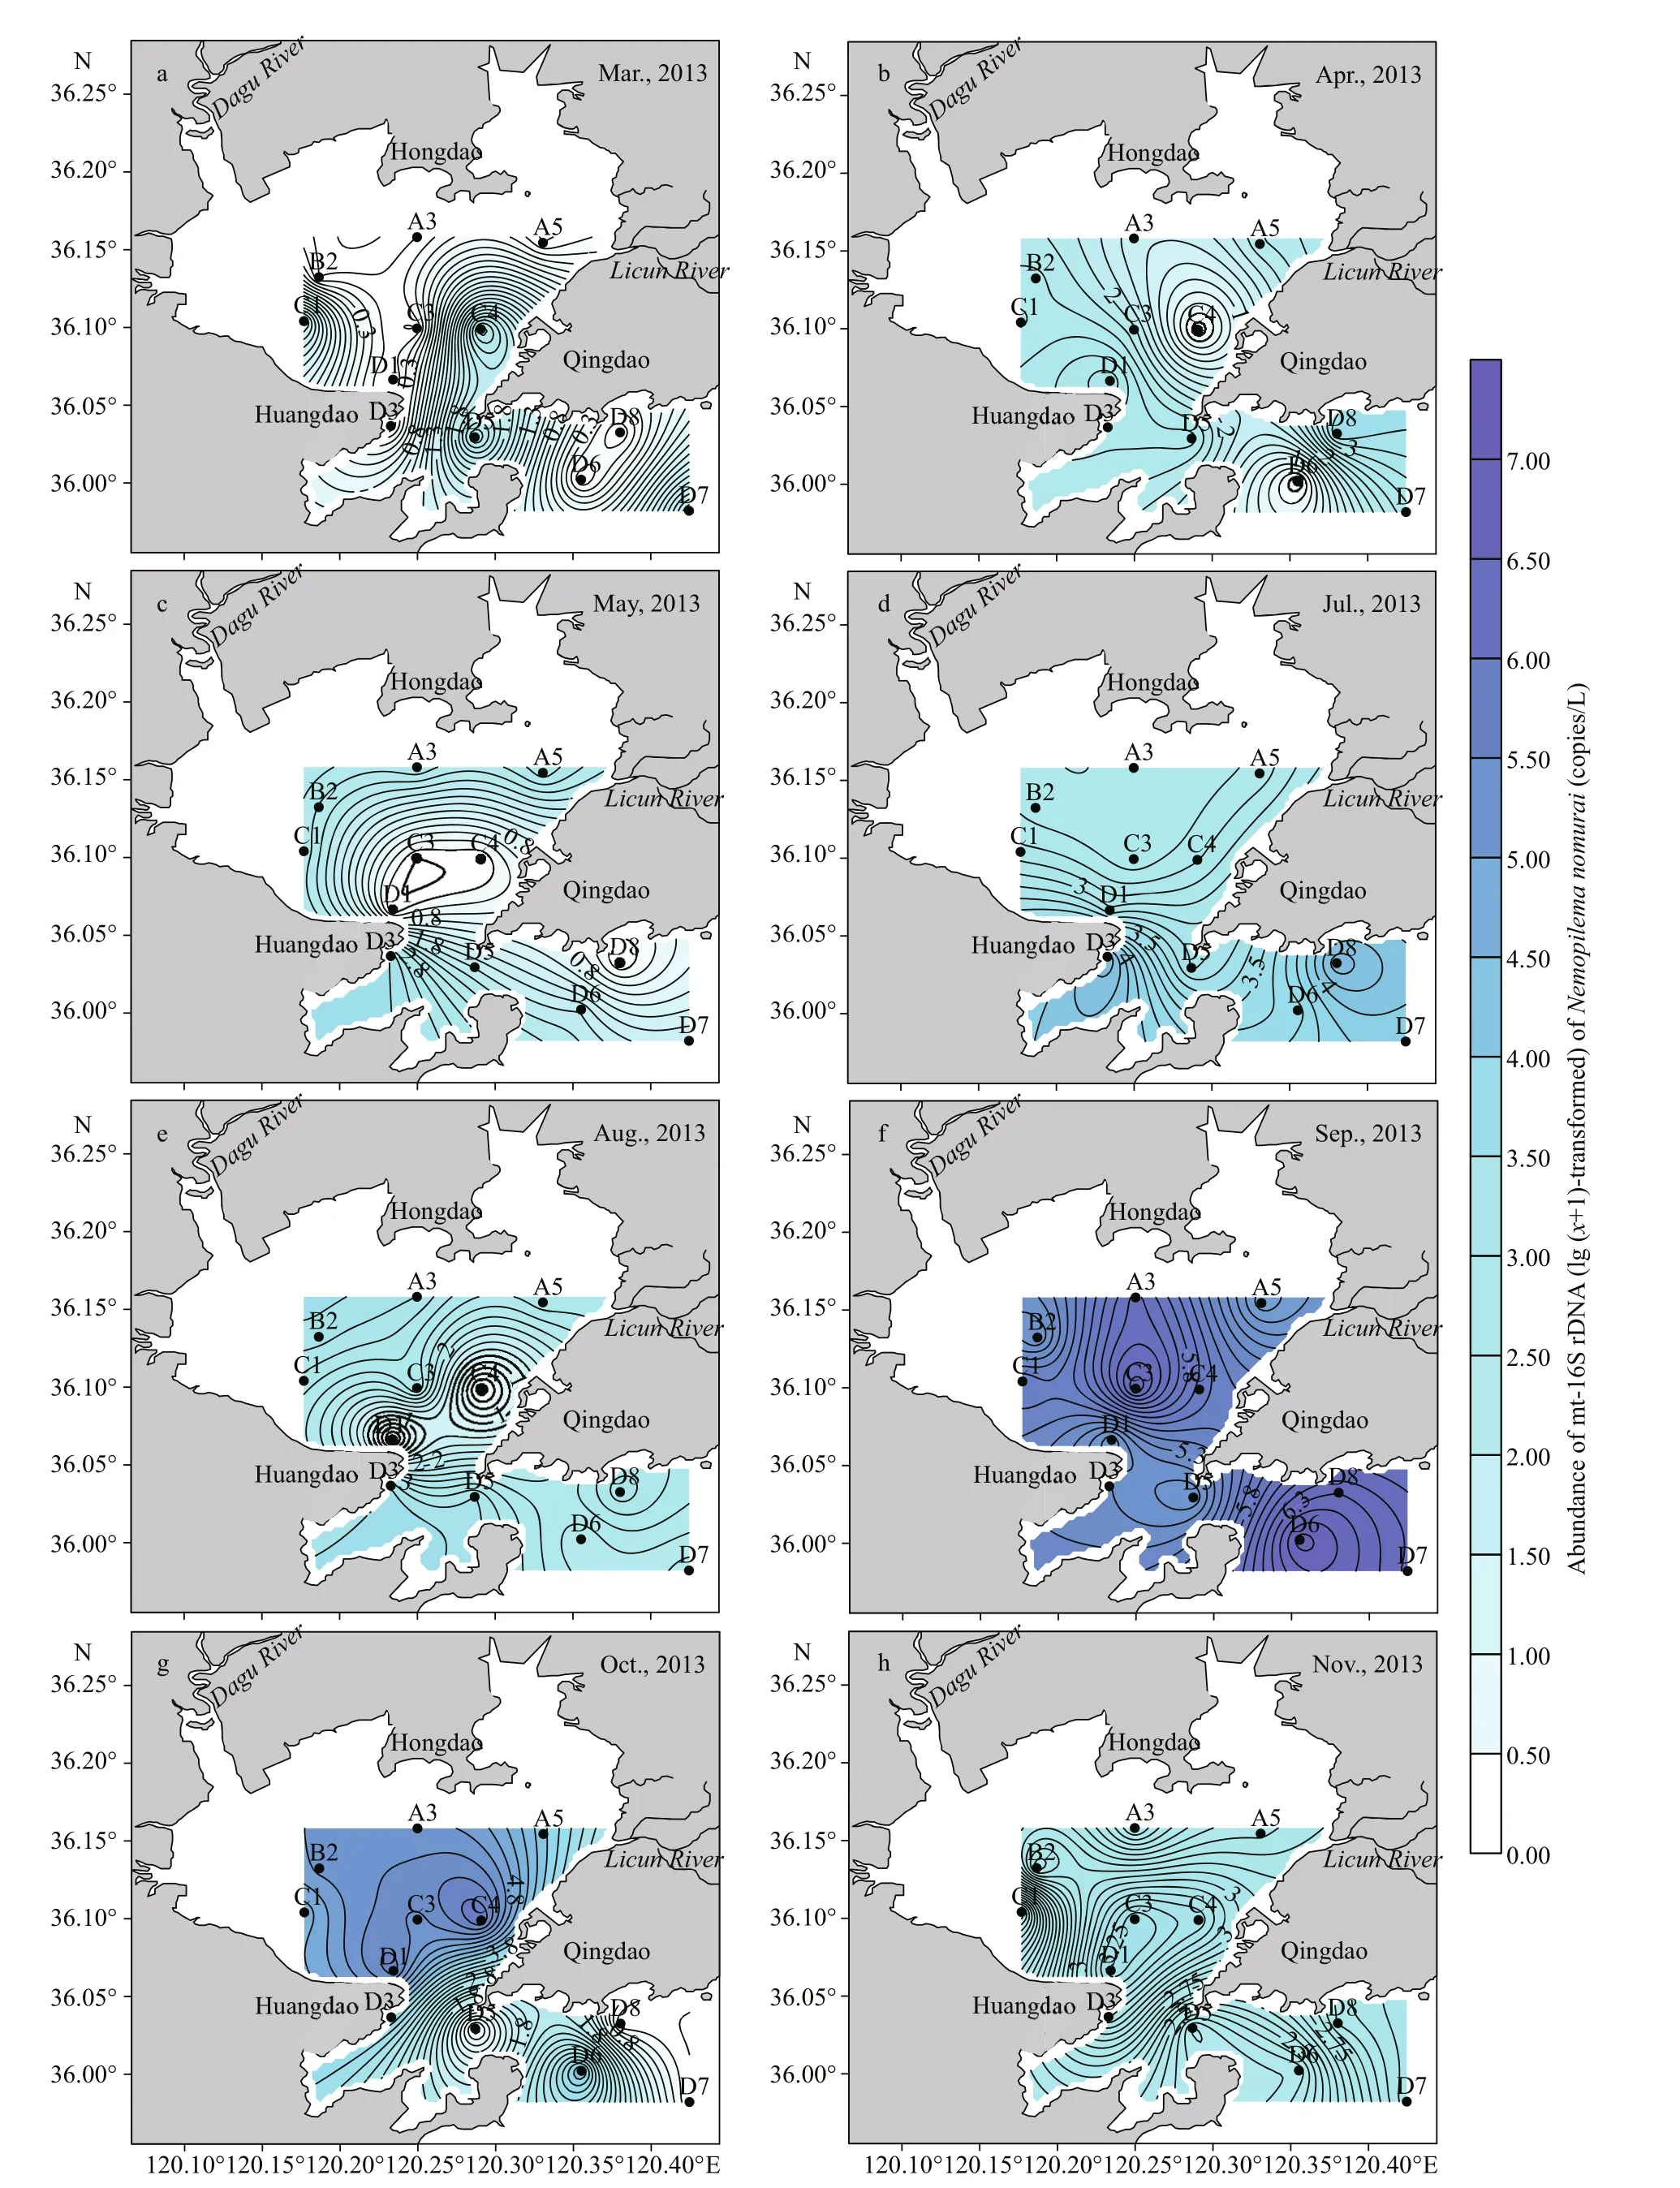
Fig.3 Spatial variation in mt-16S rDNA (lg ( x+1)-transformed) of N. nomurai in the surface water of Jiaozhou Bay sampled in 2013
The spatial distribution of mt-16S rDNA ofA.coeruleawas uneven, especially in the months with high abundance. In 2013, mt-16S rDNA ofA.coeruleawas first detected outside of the bay (D6 station) in March (Fig.5a) and then detected at A5 and C3 in April (Fig.5b).A.coeruleawas widely and abundantly detected in July, with peak abundance observed at the inner (A5 and A3) and outer part of the bay (D5, D6, and D7) (Fig.5c). In August,A.coeruleaoccurred at only four stations (A5, C3,C4, and D8) and was still abundant at the A5 station(Fig.5d).A.coeruleanearly disappeared from JZB in autumn, and occurred at only two stations (C3 and D6) with a low abundance (Fig.5e). Mt-16S rDNA ofA.coeruleawas still detected in the late autumn in JZB, though only at one station (C1) with a low abundance (97.63 copies/L) in November (Fig.5f).Generally,A.coeruleaabundantly occurred in summer in JZB and was highly distributed at the inner (A3 and A5) and outside of the bay (D5, D6,D7, and D8).
3.3 Correlations between mt-16S rDNA abundance and environmental variables
The environmental variables and biomass collected in JZB during the sampling period were listed in Supplementary Table S1. According to the detrended correspondence analysis (DCA) results,redundancy (RDA) analysis was chosen to analyze the correlations between the mt-16S rDNA abundance of the four jellyfish and the eight factors.The first two RDA axes explained 21.54% and 4.87% of the cumulative variance in the 16S rDNA abundance-environment relationship, respectively(Fig.6). The first axis was positively correlated with phytoplankton abundance (R=0.80) and negatively correlated with SRSi (R=0.44). The second axis was negatively related to temperature (R=-0.88)and positively related to salinity (R=0.59).A.coeruleawas positively related to the first axis(R=0.47) and most closely related to phytoplankton abundance, whileN.nomuraiwas negatively correlated with the first axis (R=-0.91). Based on the RDA,A.coeruleawas highly abundant in samples collected in summer, whileN.nomuraiwas highly abundant in autumn. The Spearman correlation test between the mt-16S rDNA abundance and the variables revealed that only phytoplankton biomass was significantly positively correlated with the mt-16S rDNA abundance ofA.coerulea(R=0.37,P<0.01) and negatively with mt-16S rDNA ofN.nomurai(R=-0.36,P<0.01)(Supplementary Table S2).
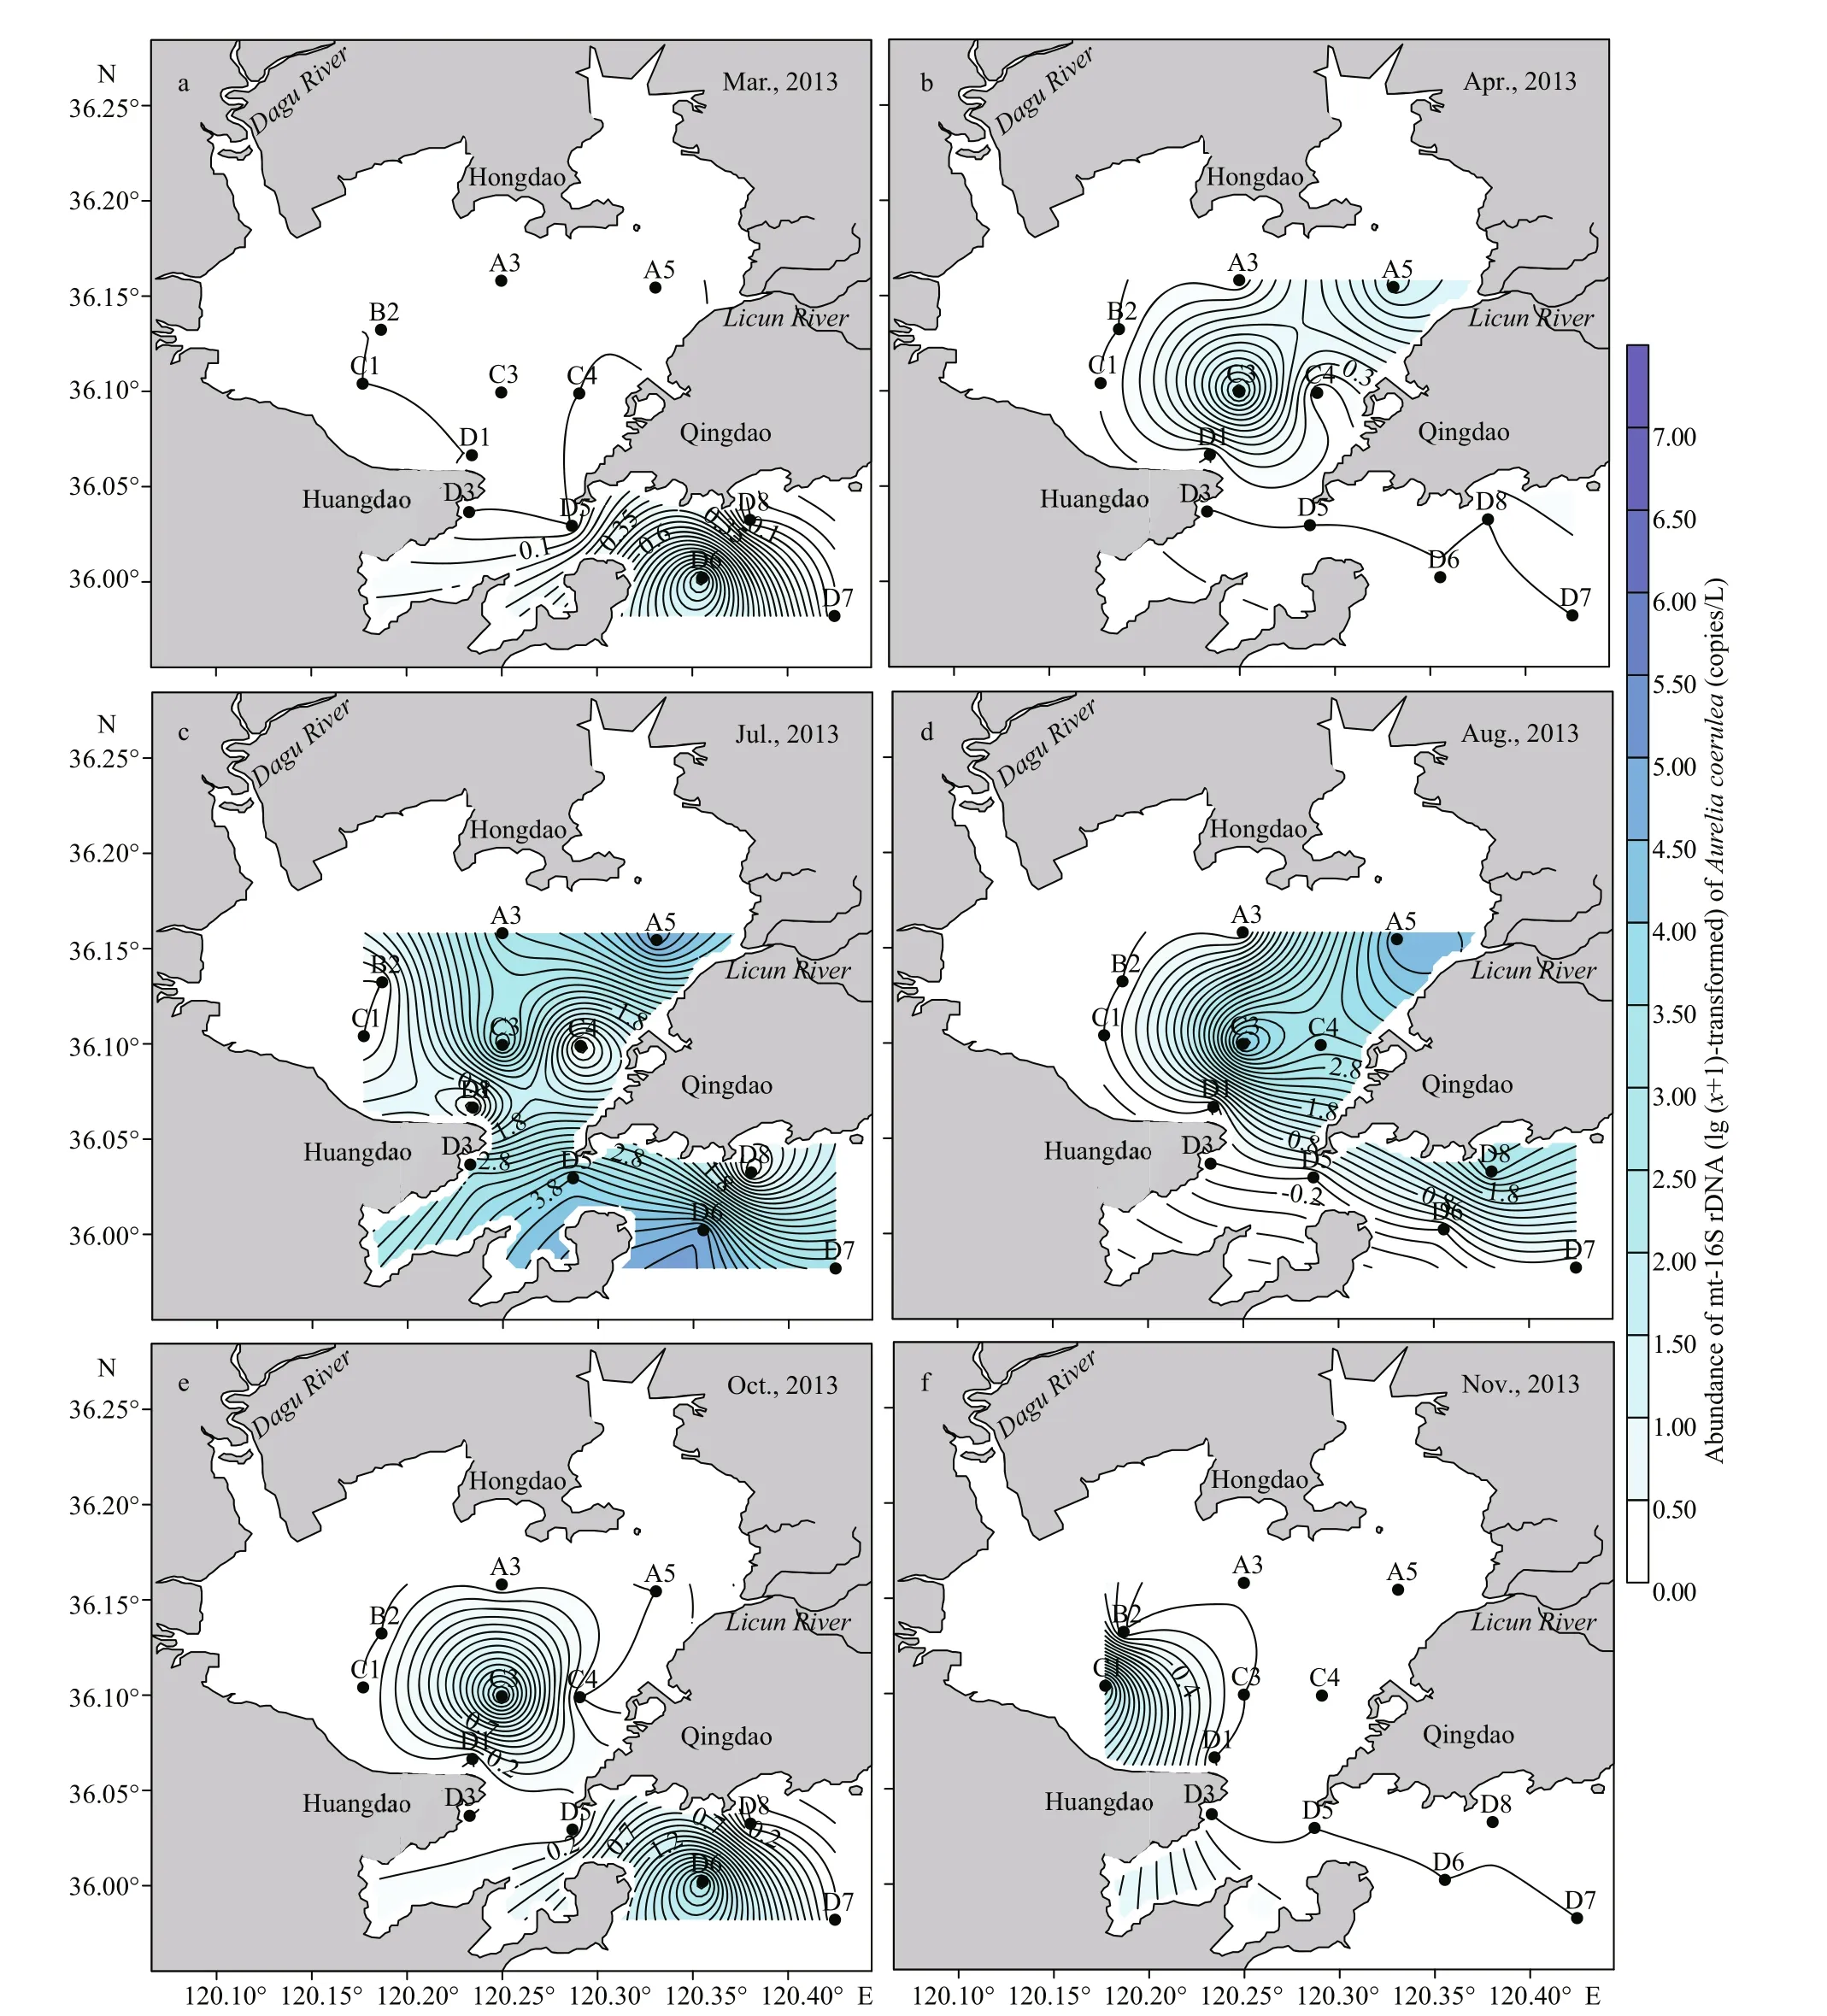
Fig.5 Spatial variation in mt-16S rDNA (lg ( x+1)-transformed) of A. coelurea in the surface water of Jiaozhou Bay sampled in 2013
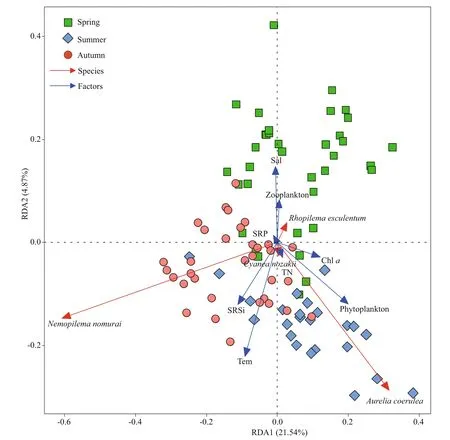
Fig.6 Redundancy analysis (RDA) oflg ( x+1)-transformed environmental parameters and the mt-16S rDNA abundance of the four jellyfish in 2013
4 DISCUSSION
4.1 Temporal and spatial distributions of jellyfish mt-16S rDNA in Jiaozhou Bay
Nemopilema nomurai
Usually,N.nomuraioccurs in Chinese coastal waters from May to December.N.nomuraioccurs in the junction of the East China Sea and the Yellow Sea in May, distributes in the southern Yellow Sea in June,reaches the highest abundance and spreads all over the Yellow Sea in late August and early September,and decreases and distributes to the north of the Yellow Sea from October to December (Ding and Chen, 2007; Zhang, 2008). Among the four scyphomedusae, the abundance ofN.nomuraiwas the highest in JZB in 2013. Mt-16S rDNA ofN.nomuraiwas first detected in March in JZB,increased thereafter, peaked in September, and then decreased. In general, the temporal variation in mt-16S rDNA ofN.nomuraiwas in accordance with that of medusae in JZB, which was ephyrae or metephyrae occurring in late May and early June, increasing from June to August, and then decreasing dramatically in October (Wang et al., 2012; Sun et al., 2015).N.nomuraishowed a tendency to originate and peak in the outer bay and then distribute and decrease towards the bay in the present study. According to in situ observations by Wang et al. (2012), medusae ofN.nomuraimainly distributed in the mouth and middle part of the bay from August 1 to the September 30 in 2011.
Aurelia coerulea
Mt-16S rDNA ofA.coeruleawas first detected in early spring, peaked in summer, and then decreased in autumn in JZB. This tendency was in accordance with the annual variation ofA.coeruleaabundance in JZB.The ephyrae ofA.coeruleawere first observed in April or May, and medusae were massively captured in July and disappeared after September (Wan and Zhang, 2012; Wang et al., 2012; Wang and Sun,2015). One diff erence was noted, however: a low abundance ofA.coeruleamt-16S rDNA was detected in October and November in the present study, while no medusae or ephyrae were observed at this time by visual counting or net sampling. The common longevity ofAureliaspp. medusae are approximately 4 to 8 months, but medusae ofAureliasp. could live for two years in Kagoshima Bay in Japan (Miyake et al., 1997). Medusae ofA.auritawere observed to attach closely to the seabed in October and November in Omura Bay, Nagasaki (Matsushita et al., 2011).According to Feng et al. (2018), polyps ofA.coeruleastarted strobilation from late winter to early summer in JZB, rather than in autumn or winter. Therefore, the mt-16S rDNA detected in late autumn was probably from medusae rather than ephyrae. Our result revealed that medusae ofA.coeruleain JZB could live longer than previously thought, and they could live to late autumn. As to the spatial distribution, mt-16S rDNA ofA.coeruleafirst occurred in the mouth of the bay in March (station D6) and then in the inner part of the bay (stations A5 and C3). Such a phenomenon was also observed by Wang and Sun (2015), where 55 of 56 ephyrae were detected at the station in the mouth of the bay, and one was observed in the bay. In summer, mt-16S rDNA ofA.coeruleaalso occurred at a high abundance at the D6 and A5 stations in July and then at the B2 and A3 stations in August.
Cyaneanozakii
Mt-16S rDNA ofC.nozakiiin JZB was relatively low in abundance compared with that ofA.coeruleaandN.nomurai.C.nozakiioccurred from August to October in JZB, consistent with the temporal variation in medusae in JZB observed by Wang et al. (2012).C.nozakiiis a relatively warm-temperature and highsalinity species that usually occurs in the seawater offthe estuary rather than near the coastal waters (Dong et al., 2010; Wang et al., 2014). Similar toN.nomurai,C.nozakiialso showed a spatial distribution in the mouth of the bay and outside the bay, which was also similar to the distribution observed in situ and on board (Wang et al., 2012). According to observations ofC.nozakiipolyp population dynamics in JZB,C.nozakiipolyps strobilated from May 27 to July 1 in 2013 (Feng et al.,2017); however, no mt-16S rDNA ofC.nozakiiwas detected during this period in the present study.
Rhopilemaesculentum
Rhopilemaesculentumis an important fishery species in China. Due to overfishing and blooms of other jellyfish species, fishery production ofR.esculentumhas decreased sharply in recent years, and native individuals have even disappeared (Song et al., 2017). A field survey of fishery resources on the southern coast of Shandong Province in August from 2010 to 2017 showed thatR.esculentumoccurred in only 2010 and 2011, accounting for 10.83% and 2.57% of the total weight of the main fishery resources, respectively (Lv,2018).R.esculentumwas undetected in JZB during 2009 to 2011 (Wang et al., 2020). Our results suggested thatR.esculentumappeared in JZB but at a very low abundance, nearly to an extinction level.
4.2 Relationship between abundance of jellyfish mt-16S rDNA and environmental variables
In the present study, only phytoplankton biomass was significantly related to the mt-16S rDNA abundance ofA.coerulea(R=0.37) andN.nomurai(R=-0.36). Jellyfish are generally thought to increase phytoplankton abundance as zooplankton are preyed upon by jellyfish (top-down control); additionally,phytoplankton are nourished by the gelatinous dissolved organic matter released by jellyfish when they die and decompose (bottom-up control) (Pitt et al., 2009).A.coeruleaoccurred abundantly in July,when phytoplankton abundance peaked but zooplankton biomass was low, suggesting they conducted a top-down control of phytoplankton abundance during this time in JZB. From summer to autumn,N.nomuraiabruptly increased and clearly peaked in September, and the phytoplankton biomass and zooplankton abundances were at very low levels at this time in JZB. According to Morais et al. (2015),the diet of jellyfish is composed not only of metazooplankton but also of phytoplankton, ciliates,and detritus. Therefore, when a large number ofN.nomuraisuddenly aggregate in a small area, their consumption of phytoplankton is huge and destructive,and they may decrease the phytoplankton abundance to a rarely low level (Uye, 2014; Iguchi et al., 2017;Zhang et al., 2017).
4.3 Origin or habitat locations of jellyf sih in Jiaozhou Bay
Based on geographical and ecological characteristics, JZB can be divided into three parts:the mouth, the inner part (also the northern part), and the middle part. The mouth has a similar geographical and ecological system as that in the Yellow Sea, the inner part is well known for mariculture, and the middle part is a mixture area aff ected by the both inbay mariculture and outer-bay current (Sun et al.,2005). In this study, mt-16S rDNA ofA.coeruleaoccurred first at the inner part (A5) and outer part of JZB (D6) and highly distributed in these two parts(A5 and A3 in the inner part, and D5, D6, and D7 in the outer part) in summer, suggesting that the inner part of JZB may be a habitat forA.coerulea. This speculation was confirmed by Dong et al. (2018), who showed that polyps ofA.coeruleapolyps were discovered on the inner sides of the substrate cages in aquaculture ponds in JZB. The rafts used for scallop culturing in JZB slow the water exchange and turbulence in this area, provide a retention location forA.coeruleato aggregate and spawn, and are ideal artificial substrates for polyps to attach.
Nemopilema nomuraiandC.nozakiiare suspected to be transported into JZB by the currents in summer rather than natively inhabit here (Sun, 2012; Wang et al., 2012). Observed by plotting experimental polyp colonies in JZB, the polyps ofN.nomurai,C.nozakiiandR.esculentumwere completely eliminated by biofouling within 7-8 months or died out after strobilation (Feng et al., 2017, 2018). However, in the present study, mt-16S rDNA ofN.nomuraiwas positively detected from March to November in 2013.The feeding pressure ofN.nomuraion the production of zooplankton is huge and is maximum at 344.28%in the Yellow Sea (Zhang et al., 2017), so the very low plankton biomass in autumn in JZB is unlikely to maintain the growth ofN.nomuraiin a large quantity.N.nomuraiwith high biomass was observed mainly in front of the Yellow Sea Cold Water Mass (YSCWM)or at the junction of cold and warm water masses (Li et al., 2012). The Qingdao coastal region, where the YSCWM extends and leads to coastal upwelling,facilitates the aggregation ofN.nomurai, and the current transportsN.nomuraito the JZB. Thus,medusae ofN.nomuraican survive in the JZB, but its polyps will experience high mortality, and only a small number of ephyrae are native-released; the large number ofN.nomuraimedusae occurring in summer in this area originate from the outside bay.Mt-16S rDNA ofC.nozakiiandR.esculentumwas scarcely detected in JZB and mostly distributed in the mouth and outer part of the bay; combing with the fact their polyps cannot survive in JZB (Feng et al.,2017, 2018), We also suggest that these two species originate from the outside bay.
4.4 qPCR assay for scyphomedusae detection
qPCR is a powerful technique for enumerating microbial species and has been used to determine the abundance of many microorganisms and algal species. Since Bayha and Graham (2009) first developed a Taqman©real-time PCR method for the detection of jellyfish polyps in ballast water, few studies (Wang et al., 2015; Minamoto et al., 2017;Takasu et al., 2019) have applied molecular quantitative approaches to quantify jellyfish in field samples. Many factors influence the accuracy of the molecular results, e.g., inhibitors in environmental DNA, deposition and distribution of targeted DNA in seawater, the calibration curve of jellyfish amount vs DNA copies, and so on. Though there is some inadequacy, quantification of eDNA can still reflect the spatial and temporal distributions of jellyfish(Minamoto et al., 2017). Molecular techniques will enable identification of tiny jellyfish individuals in the early development stage and provide some clues,allowing us to surmise the possible habitat of polyps and origin of jellyfish.
5 CONCLUSION
In the present study, we analyzed the spatial and temporal yearly distributions of mt-16S rDNA of four jellyfish in JZB using species-specific qPCR assays.Mt-16S rDNA ofA.coeruleaandN.nomuraiwas detected in most of the survey months and peaked in July and September, respectively. Mt-16S rDNA ofA.coeruleawas abundantly distributed in the inner part of the bay and outside the bay. Mt-16S rDNA ofN.nomuraioccurred in abundance in the outer bay.Mt-16S rDNA ofC.nozakiiwas detected from August to October only in a low abundance. Mt-16S rDNA ofR.esculentumwas the least abundant and was detected in one sample only.
6 DATA AVAILABILITY STATEMENT
The data that support the findings of this study are available from the corresponding author upon request.
7 ACKNOWLEDGMENT
Sincere thanks are given to staff at the Jiaozhou Bay National Marine Ecosystem Research Station(http://jzb.cern.ac.cn/) for providing the environmental data and for the kind help that they provided during the on-board water sampling.
杂志排行
Journal of Oceanology and Limnology的其它文章
- Numerical study of the seasonal salinity budget of the upper ocean in the Bay of Bengal in 2014*
- Study on evaluation standard of uncertainty of design wave height calculation model*
- A fast, edge-preserving, distance-regularized model with bilateral filtering for oil spill segmentation of SAR images*
- A Gaussian process regression-based sea surface temperature interpolation algorithm*
- Climatology and seasonal variability of satellite-derived chlorophyll a around the Shandong Peninsula*
- Sources of sediment in tidal flats off Zhejiang coast, southeast China*
