In vitro - in vivo - in silico approach in the development of inhaled drug products:Nanocrystal-based formulations with budesonide as a model drug
2021-07-21ChngzhiShiJelisvetIgnjtoviTingtingLiuMeihuHnDongmeiCunJelenuriMingshiYngSndrCviji
Chngzhi Shi ,Jelisvet Ignjtović ,Tingting Liu ,Meihu Hn ,Dongmei Cun ,Jelen Đuriš,Mingshi Yng ,c,∗,Sndr Cvijić
a Wuya College of Innovation,Shenyang Pharmaceutical University,Wenhua Road No. 103,110016 Shenyang,China
b Department of Pharmaceutical Technology and Cosmetology,University of Belgrade-Faculty of Pharmacy,Vojvode Stepe 450,11221 Belgrade,Serbia
c Department of Pharmacy,Faculty of Health and Medical Sciences,University of Copenhagen,Universitetsparken 2,DK-2100 Copenhagen,Denmark
Keywords:Pulmonary drug delivery Budesonide Nanocrystal suspension Nanocrystal-embedded microparticles In silico physiologically-based pharmacokinetic modeling
ABSTRACT This study aims to understand the absorption patterns of three different kinds of inhaled formulations via in silico modeling using budesonide (BUD) as a model drug.The formulations investigated in this study are:(i) commercially available micronized BUD mixed with lactose (BUD-PT),(ii) BUD nanocrystal suspension (BUD-NC),(iii) BUD nanocrystals embedded hyaluronic acid microparticles (BUD-NEM).The deposition patterns of the three inhaled formulations in the rats’ lungs were determined in vivo and in silico predicted,which were used as inputs in GastroPlusTM software to predict drug absorption following aerosolization of the tested formulations.BUD pharmacokinetics,estimated based on intravenous data in rats,was used to establish a drug-specific in silico absorption model.The BUD-specific in silico model revealed that drug pulmonary solubility and absorption rate constant were the key factors affecting pulmonary absorption of BUD-NC and BUD-NEM,respectively.In the case of BUD-PT,the in silico model revealed significant gastrointestinal absorption of BUD,which could be overlooked by traditional in vivo experimental observation.This study demonstrated that in vitro-in vivo-in silico approach was able to identify the key factors that influence the absorption of different inhaled formulations,which may facilitate the development of orally inhaled formulations with different drug release/absorption rates.
1.Introduction
Novel trends in drug discovery and formulation development impose the use of in silico physiologicallybased pharmacokinetic (PBPK) modeling tools to estimate drug pharmacokinetic and pharmacodynamic properties.A number of examples regarding modeling of drug bioperformance are available in literature,however they mostly concern peroral drug administration [1—5] .On the other hand,advanced in silico models aimed to simulate absorption and disposition of drugs dosed by alternative routes,including pulmonary administration,appeared more recently.Up to date,only a few publications have described the use of in silico tools for modeling inhaled drugs performance[6—12] .PBPK modeling of inhaled drugs requires a number of input data,and the selection of such dataset is a laborious task.Moreover,the available models are currently in the early developmental phase,and still not able to simulate all the processes that may affect drugs’ disposition in the lungs.However,they have a high potential to facilitate development of inhaled drug products,especially in combination with preclinical animal studies.Jones et al . [13] have proposed an in vivo-in silico strategy that involves modeling across species to estimate drug performance in humans.Although initially proposed for oral drugs,such an approach could also be applied for inhaled drugs,whereas the first step would be to construct and validate an in silico animal (e.g.,rat) model for intratracheally administered drugs.
In silico modeling of pulmonary drug delivery in experimental animals is challenging because none of the commercially available software is able to predict both drug deposition and absorption in animal lungs.To exemplify,PBPK software for the prediction of drug absorption (e.g.,GastroPlus,Mimetikos Preludium) have built-in models to estimate regional drug deposition and absorption in human lungs,but not in animals e.g.,rat respiratory tract.On the other hand,respiratory tract dosimetry models,such as Multiple-Path Particle Dosimetry (MPPD) model,are able to predict deposition of aerosols in some animal species (e.g.,mouse,rat,rabbit,rhesus monkey,pig),but the concomitant output data regarding drug deposition cannot be used as raw inputs in other software like GastroPlusto predict pulmonary drug absorption.This discrepancy is caused by intrinsic differences in the sub-regions of the lungs between MPPD and GastroPlussoftware.Namely,MPPD model provides data on the deposited fractions of drug in two pulmonary regions (tracheobronchial and pulmonary/alveolar) while GastroPlusrequires data on drug deposition in four distinct regions (extra-thoracic,thoracic,bronchiolar and alveolar),and considers that partial or total fraction of deposited drug in extra-thoracic region can be swallowed.
In this study we attempted to establish the in silico rat model for three intratracheally administered formulations using budesonide (BUD) as a model drug (Scheme
1
).The three inhaled formulations consisted of (i) commercially available micronized BUD (Pulmicort) mixed with coarse lactose as a carrier (BUD-PT),(ii) BUD nanocrystal suspension(BUD-NC),and (iii) BUD nanocrystals embedded hyaluronic acid microparticles (BUD-NEM).The latter two formulations were intended to render faster and slower (respectively) drug absorption/dissolution rate in the rat lung than Pulmicortpowder blended with lactose.The particle deposition data of these three formulations in rats’ lungs were obtained experimentally and used as input parameters in GastroPlusin order to construct the BUD-specific in silico absorption rat model.For comparison to the in vivo deposition data,BUD deposition in rat lungs was predicted by MPPD software and the obtained results were converted to GastroPlusidentifiable data,as described in the Supplementary Data Appendix A.Finally,the drug absorption patterns following intratracheal administration of the three inhaled formulations were predicted and analyzed using the designed model.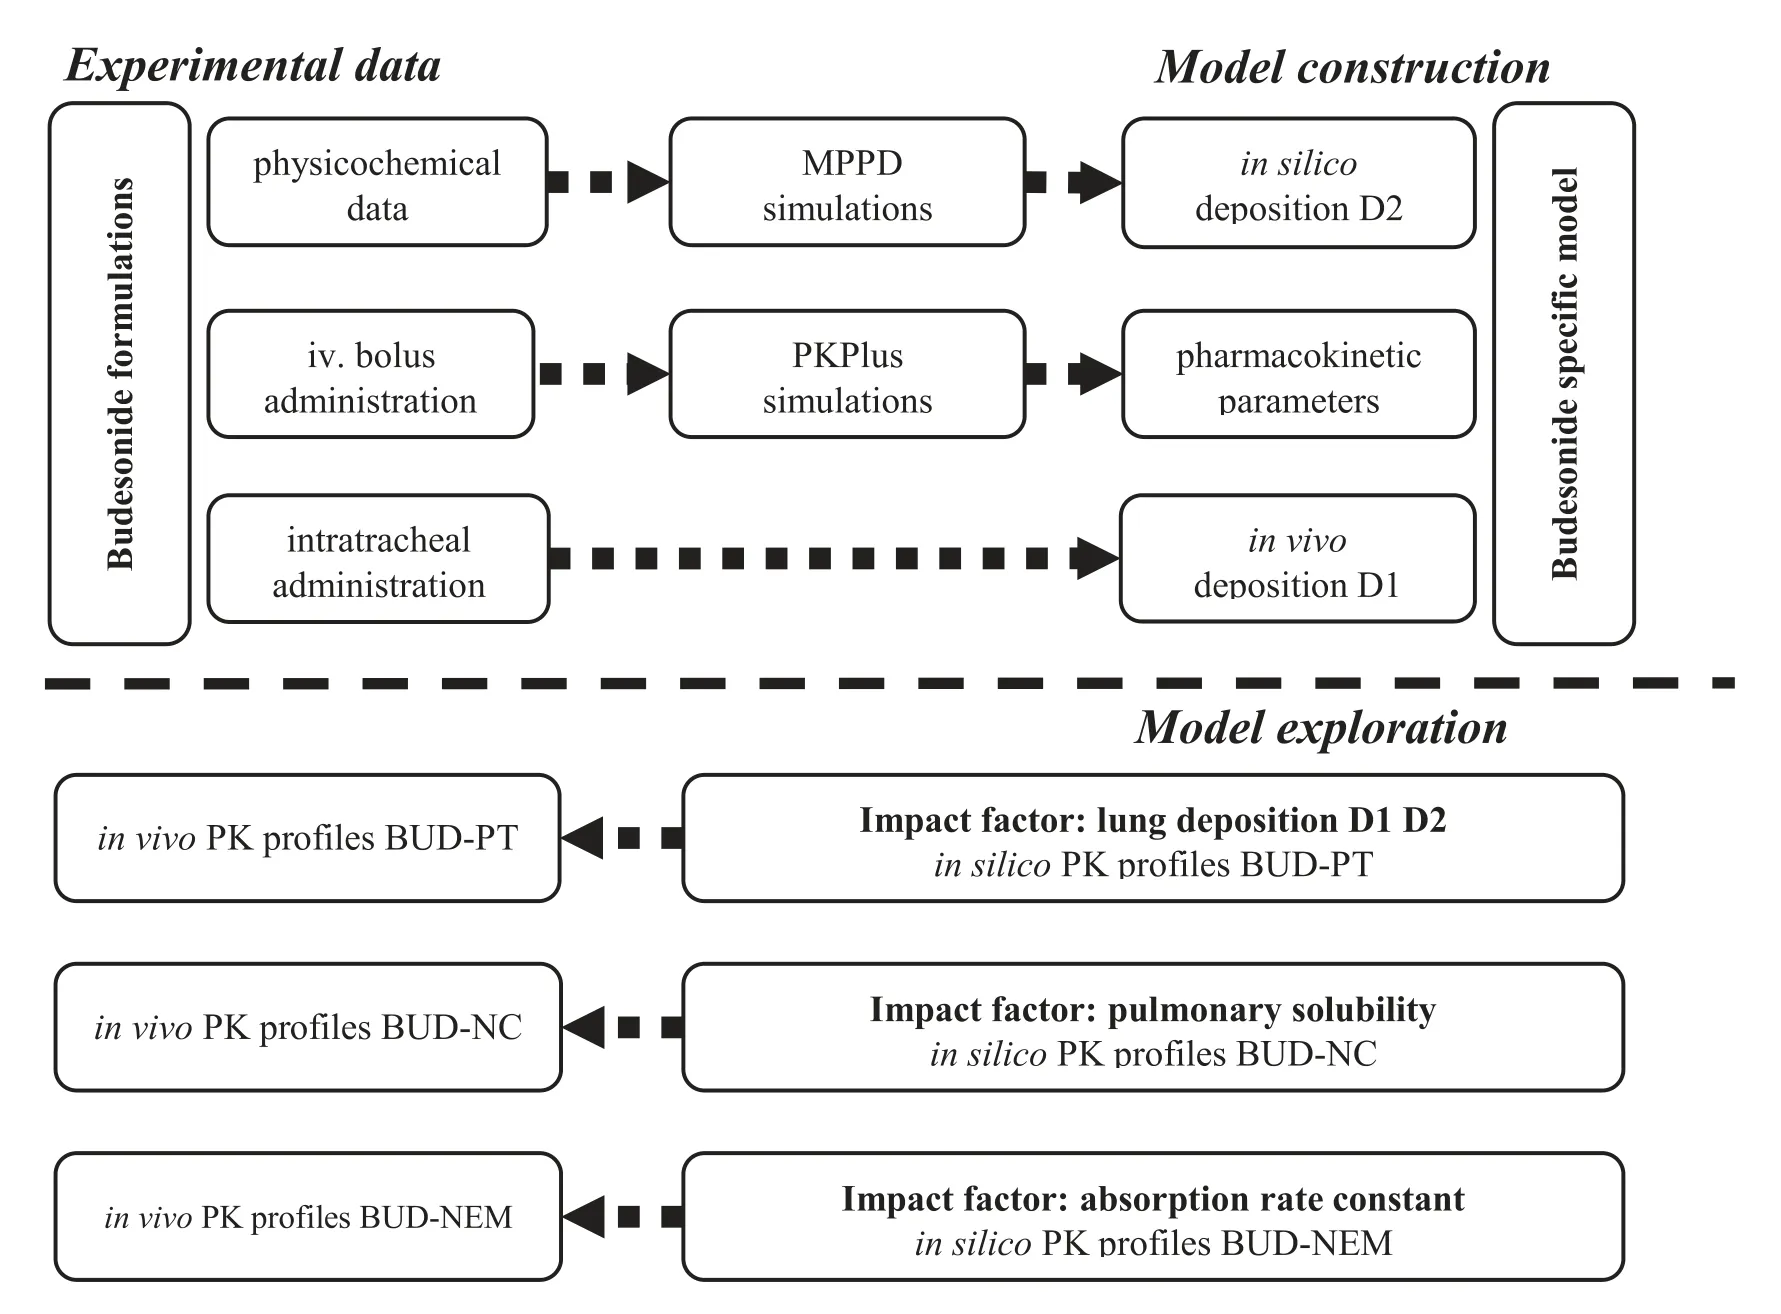
Scheme 1–Schematic illustration of the simulation study for budesonide.
2.Materials and methods
2.1.Materials
Budesonide (BUD) was purchased from Gedian Humanwell Pharmaceutical Co.Ltd.(Hubei,China).Hyaluronic acid (HA)was supplied by Shandong Freda Biotechnology Co.Ltd.(Jinan,China).Pluronic F-68 (F68) was kindly provided by BASF (China) Co.Ltd.Pulmicort Turbuhaler(AstraZeneca AB,Sodertalje,Sweden) was purchased from a local pharmacy.Sieved inhalation lactose in crystalline lactose grade(RespitoseSV003) was donated by DFE Pharma (Shanghai,China).Purified water was produced using a Milli-Qplus Millipore system (Millipore,Billerica,MA,USA).All other chemicals were of analytical grade.
2.2.Preparation of inhaled BUD formulations
We previously reported in the study by Liu et al . [14] the preparation of three inhaled formulations i.e.,(i) BUD-PT,(ii)BUD-NC,and (iii) BUD-NEM.In brief,BUD-PT was prepared by blending the BUD powder collected from Pulmicort Turbuhalerwith inhalation lactose (RespitoseSV003) at a ratio of 1:4 (w/w) using a vortex mixer (Lab Dancer,IKA,Germany) for 10 min.The obtained mixture was collected in a closed glass vial and stored in a vacuum oven (DZF-6050,Boxun,China) at room temperature for further use.This was done to increase the bulk volume of the dry powder to suit the application of Penn-Century dry powder insufflator (i.e.,1—5 mg).
BUD-NC was prepared by mixing 1 g of BUD raw material and 100 g zirconium oxide beads (0.5 mm in diameter) in 10 ml of 1% (w/v) F68 solution,followed by a milling process.The milling was performed at a rotation speed of 500 rpm for 120 min in a milling bowl equipped with a Pulverisette 7 Premium planetary ball mill (Fritsch GmbH,Germany).Thereafter,milling cycles of 5-min run with 2-min pause were applied to prevent overheating of the suspension and the mill.At the end of the milling process,the suspension was cooled down to room temperature and washed with purified water three times to remove F68.Finally,the washed BUD particles were resuspended in distilled water to give a final concentration of 30 mg/ml.
To prepare BUD-NEM,a liquid formulation composed of 0.1% (w/v) BUD-NC and 0.3% (w/v) HA solution was processed using a laboratory scale Mini Spray Dryer Büchi B-290 (Büchi Labortechnik AG,Switzerland) equipped with a 2-fluid nozzle with an orifice diameter of 0.7 mm.The following process parameters were used i.e.,the feeding rate of 4.5 ml/min,the aspirator gas flow rate of 35 m/h,the atomizing air flow rate of 437 l/h and the inlet temperature of 150 °C.The obtained BUD-NEM dry powder was collected in a closed glass container and stored in a vacuum oven (DZF-6050,Boxun,China) at room temperature for further use.
2.3.Aerodynamic particle size of aerosolized BUD powders
The aerodynamic performance of BUD-NEM was assessed and reported in previously published paper [14] .In this study,the aerodynamic properties of BUD-PT were evaluated using a next generation impactor (NGI,Copley Scientific,Nottingham,UK).To minimize bouncing or re-entrainment of the particles,all cups of NGI were coated with 10% (v/v) Tween 20 solution in ethanol.10 mg of BUD-PT was filled into size 3 hypromellose capsules (Capsugel Co.,Ltd,Suzhou,China) and inserted into a Cyclohalerdry powder inhaler (DPI) (Pharmachemie B.V.,Netherlands).Each capsule was aerosolized at a constant air flow rate of 100 l/min for an actuation time of 2.4 sec,and the assay was done in triplicate.After the aerosol settled,the powder retained in the capsule,inhaler,adaptor,throat,pre-separator and all NGI stages were collected using an appropriate volume of acetonitrile-water mixture 70:30 (v/v),and the drug content was determined by HPLC [14] .The mass median aerodynamic diameter (MMAD) and geometric standard deviation (GSD) were calculated to characterize the in vitro particles deposition profile.
2.4.Droplets size of aerosolized BUD-NC
The diameter of the aerosolized BUD-NC droplets was measured by a laser diffraction method using Malvern Spraytec(Malvern Panalytical Ltd,UK) equipped with RT Sizer software 3.20.In brief,50 μl of BUD-NC was aerosolized into fine droplets using a MicroSprayerAerosolizer (Model IA-1C,Penn-Century.Inc.Wyndmoor,PA) that was employed to intratracheally administer BUD-NC liquid aerosol in the rat study described in the latter section.The aerosolized droplets that crossed the laser beam of Malvern Spraytecwere detected by the laser receptor,and the photoelectric signals were converted into the information on particle size distribution by RT Sizer software.
2.5.Geometric particle size
Geometric particle sizes of the inhaled BUD formulations were used to in silico simulate drug dissolution from the inhaled BUD formulations in the animal lungs.
The geometric particle sizes of BUD-NC and BUD-NEM were taken from previously published paper [14] .The geometric particle size of BUD from BUD-PT was determined using scanning electron microscopy (SEM) images.Briefly,more than 10 pictures for a sample were taken at randomly selected sites,and then ImageJ (Version 1.51,National Institutes of Health,USA) freeware was used to process the SEM images through the following steps.Firstly,the SEM pictures were loaded into the software,followed by setting of the scale (of the known distance) versus unit pixels on the picture.In the next step,a diagonal line was constructed to distinguish the“objects”from numerous particles,and area of each particle on the diagonal line was calculated.These values were used to calculate the diameters of particles,based on the assumption that each particle is a perfect circle.The result,expressed as d,was used as input parameter to simulate drug dissolution.
2.6.In vivo assessment of particles deposition patterns in the rats lung
The deposition patterns of the three inhaled BUD formulations were reported in previous paper [15] .In brief,BUD-PT,BUD-NC and BUD-NEM were intratracheally administered to rats,then the animals’ respiratory organs were isolated by surgical resection and divided into six physiological parts:trachea,bronchi,bronchiole (left),bronchiole (right),alveoli (left),and alveoli (right).After the drug extraction from the lung tissues,the amount of BUD in each of lungs’ six parts was measured using HPLC assay.Finally,BUD deposition in the rats’ lungs compartments was reported as a percentage of the total deposited dose.
2.7.In vivo pharmacokinetic study
The procedures were designed as reported in previously published paper [14],including the dosing method,preparation of the plasma samples,and the HPLC methodology for BUD quantification.Even though pharmacokinetic studies on the three inhaled BUD formulations have already been performed and reported,a quick drug absorption from BUD-NC observed in the previous study proposed us to redesign an earlier sampling point i.e.,2-min to obtain a representative pharmacokinetic profile.
All animal research work reported in this article had been carried out strictly in accordance with the guidelines from the Life Science Research Center and Ethical Committee,and all animal study protocols were agreed and signed by the Institutional Animal Care and Use Committee (IACUC) at Shenyang Pharmaceutical University at Liaoning (license NO.SYPU-IACUC-C-2018—71—203) before the start of the animal experiments.Animal welfare was strictly guaranteed,and appropriate efforts were made to minimize animal sufferings and to limit the number of animals used.All animals were euthanized by anesthesia (diethyl ether) after completing the experiments.
2.7.1. Animals and husbandry
Twenty male Sprague—Dawley rats (SD rats,200—220 g body weight,10—12 weeks old) were supplied by the Experimental Animal Center of Shenyang Pharmaceutical University(Shenyang,China),and animal quality certificate was issued by Liaoning Changsheng Biotechnology Co.,Ltd.All rats were randomly subdivided into 4 groups,that were a intravenous(IV) group (n=5),BUD-PT group (n=5),BUD-NC group (n=5)and BUD-NEM group (n=5).Animals were acclimated for at least 2 d prior to experiments and bred by free access to food and water in breeding cages at about 25 °C,fasted overnight (12 h) before dosing,and water was available ad libitum throughout the study.
2.7.2. Dosing formulations
The administered dose was 0.2 mg BUD per 100 g rat body weight.Briefly,pharmacokinetic study of intravenous administration in the IV group was conducted by injecting BUD solution (0.4 mg/ml) through rats’ tail vein.BUDPT and BUD-NEM were administered by a Dry Powder Insufflator(DP-4-R,Penn-Century,Inc.,Wyndmoor,PA,USA)to deliver the preloaded powder to the rats’ airways.BUDNC suspension was directly aerosolized inside the trachea with the MicroSprayerAerosolizer.Subsequently,the blood samples (0.2-ml at each time point) were collected into heparin-coated centrifuge tubes from rats’ orbital venous plexus at pre-determined time intervals 0 min,2 min,5 min,15 min,30 min,45 min,1 h,1.5 h,2 h,4 h,6 h,8 h,12 h and 24 h.Collected blood samples were immediately centrifuged at 13,800 g for 5 min at 4 °C to obtain plasma which then was stored at −20 °C until analysis.
2.7.3.Sample extraction
Prior to analyses,plasma samples were thawed at room temperature.Plasma samples (100 μl) were then aliquoted in 1.5 ml Eppendorf tubes,followed by mixing with 40 μl of phosphoric acid solution (pH 3.2) and 10 μl of internal standard-triamcinolon acetonide (4 μg/ml) for 1 min.To extract BUD from the plasma samples,1 ml of ethyl acetate was added into the Eppendorf tubes,followed by vortex mixing for 3 min,and centrifugation at 13,800 g for 5 min at 4 °C.Then the organic phases were transferred to Eppendorf tubes and the organic solvent was removed using a concentrator under a nitrogen blowing at 40 °C.Subsequently,100 μl of mobile phase was added to Eppendorf tubes and mixed by vortex for 3 min to dissolve the residues.Finally,the samples were subjected to centrifugation at 13,800 g for 5 min at 4 °C,and then the supernatants (20 μl) were analyzed for BUD content using the HPLC method.
2.7.4. HPLC quantification assay
The Chromaster HPLC system from Hitachi (Hitachi High-Technologies Corporation,Tokyo,Japan),equipped with a Hitachi 5410 UV-detector and Chromaster software,was used for HPLC quantification of BUD.The applied method complied with the procedure described in the USP41-NF36.The mobile phase was a mixture of 32% (v/v) acetonitrile and 68%(v/v) buffer (3.17 mg/ml monobasic sodium phosphate and 0.23 mg/ml phosphoric acid with a pH 3.2 ± 0.1) to elute the samples at a flow speed of 1.5 ml/min through a column(BDS Hypersil C5.0 μm,250 mm ×4.6 mm ID,Thermo Fisher Scientific,USA).The column temperature was maintained at 40 °C and the detection wavelength was set at 254 nm.20 μl of samples were injected for each analysis.BUD quantification was performed using a calibration curve of the peak area versus drug concentration (10 to 2000 ng/ml),as described in previous study [14] .Average recovery of BUD was from 98%to 102% with an RSD of inter-day and intra-day precision less than 2% in this range.LOD (limit of detection) and LOQ (limit of quantitation) were 20 ng/ml and 100 ng/ml,respectively.
2.8.In silico modeling of inhaled BUD formulations
In silico modeling tools included MPPD model (version 3.04,ARA Inc,USA) and Gastroplussoftware (version 9.6,Simulation Plus Inc,USA).MPPD software was used to estimate BUD deposition in rat’s lungs,and the obtained data were converted into GastroPlusidentifiable values(described in Supplementary data Appendix A).An add-in Pulmonary Compartmental Absorption &Transit (PCAT)model in GastroPluswas used to predict drug absorption and disposition following intratracheal administration of the tested formulations to rats.PCATmodel was linked with Advanced Compartmental Absorption and Transit (ACAT)model of the gastrointestinal (GI) tract to predict the absorption of the swallowed drug fraction.
Absorption of BUD following intratracheal administration to rats was modeled using the animal fasted-state ACAT model,in conjunction with the PCATmodel.The necessary input parameters for GastroPlussimulations were obtained from literature,in silico estimated or experimentally determined in this study (Table
1
).Software default parameter values for rat’s physiology in fasted state were used for the simulations.An add-in PKPlusmodule in GastroPlussoftware was used to estimate BUD pharmacokinetic parameters based on the obtained plasma concentration-time profile following intravenous drug administration to rats.The estimated pharmacokinetic parameters were used to generate BUD-specific model for intravenous bolus injection and intratracheally administered formulations (BUD-PT,BUD-NC and BUD-NEM).For the simulations regarding three inhalation formulations,two types of drug deposition data were tested as inputs:(i) in vivo determined values obtained from the in vivo assesment of particle deposition of three inhaled BUD formulations (D1),(ii) in silico predicted values (D2) based on in vitro aerodynamic particle size data.In addition,dissolution of inhaled BUD in the lungs was predicted based on the mean geometric particle size data and pulmonary drug solubility using software default Johnson dissolution equation.Default absorption rate constant from pulmonary compartments(k) was calculated using software integrated equation which takes into account lung volume,blood flow rate,tissue-plasma partition coefficient and blood-to-plasma concentration ratio.Sensitivity analysis,an additional software feature,was used to assess the influence of the selected input parameter values on the predicted drug absorption profile.For this purpose,the selected input parameter value was gradually changed within a predefined range while keeping all other parameters at the baseline levels.The results are expressed as sensitivity coefficient (SC),calculated as: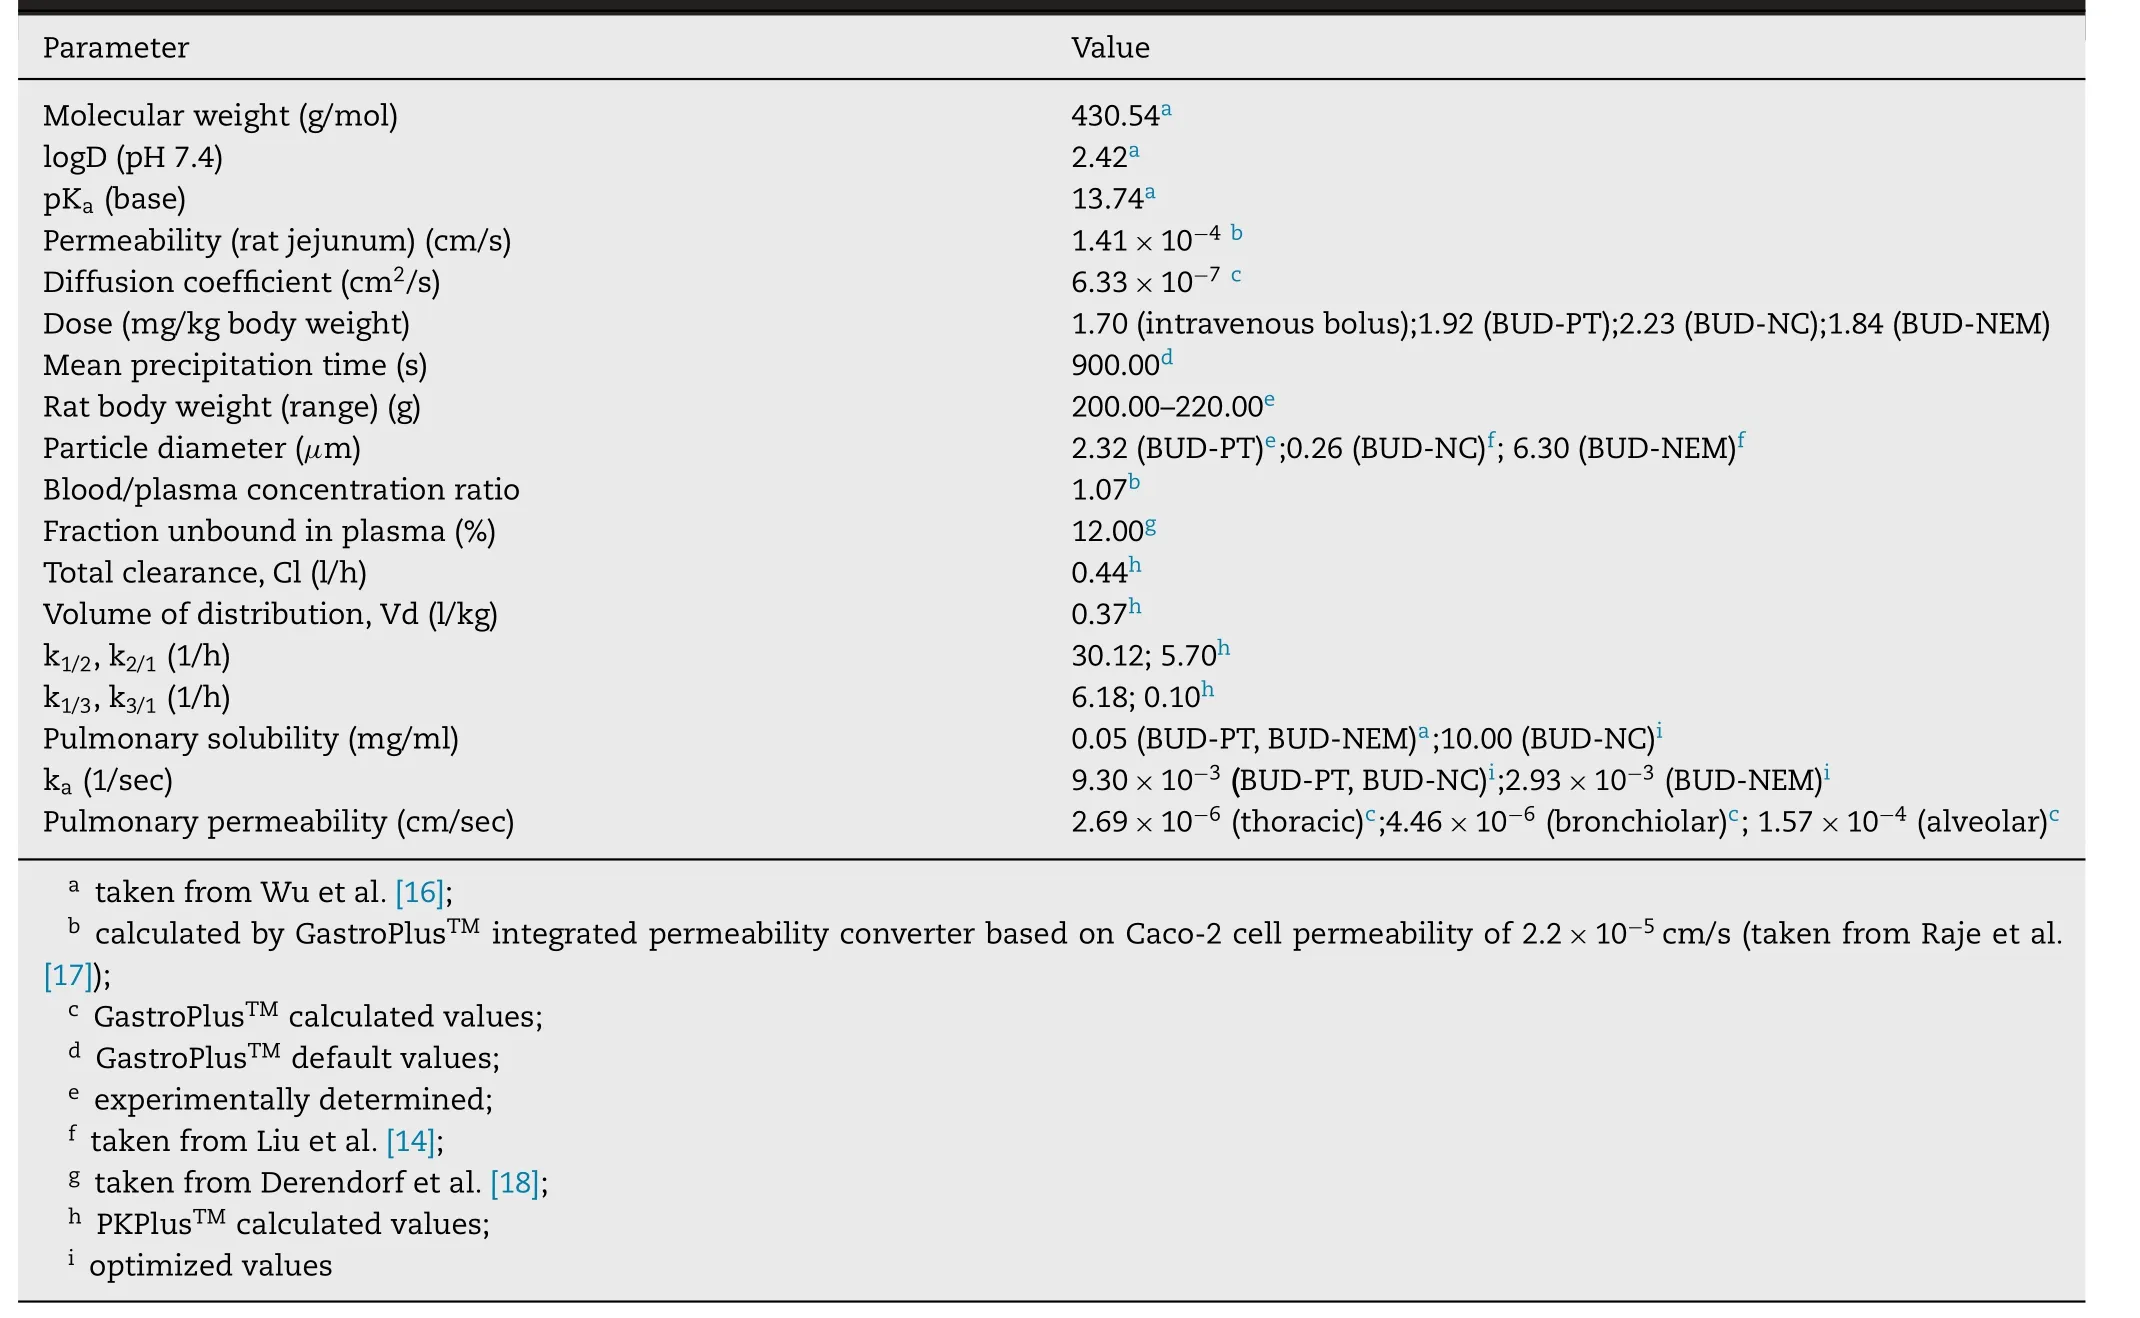
Table 1–BUD-specific input parameters for GastroPlus TM simulations.

Table 2– In vitro determined aerodynamic properties of BUD-PT and BUD-NEM (mean ±SD,n=3).

The simulation results were compared with the in vivo results in order to evaluate the designed BUD-specific model.Predictability of the generated model was assessed basedon the fold error between the predicted and mean in vivo observed data (Eq.2),considering that the prediction is better if the fold error value is closer to 1.If the predicted value ranged within two-fold of the observed value,the prediction was considered acceptable [19—22] .In addition,coefficient of determination (R) was calculated to assess linearity between the simulated and observed values of drug pharmacokinetic parameters:C,Tand AUC.

3.Results and discussion
3.1.Aerodynamic particle size of aerosolized BUD-PT and BUD-NEM
The aerodynamic properties of BUD-NEM and BUD-PT are depicted inTable
2
.The calculated MMAD and GSD of BUDPT from the NGI measurement were 2.63 ±0.11 μm and 1.97 ±0.07 μm,respectively.However,these values might not reflect the aerodynamic properties of BUD-PT in the animal study.This is because BUD-PT consisted of a mixture of micronized BUD powder (Pulmicort) and inhalation lactose that was directly sprayed in the rat’s trachea.The dispersing pattern of BUD-PT in the animal study is different from that being dosed using a DPI device,where the micronized BUD particles could disattach from the inhalation lactose due to the air turbulence generated in the DPI device during inhalation.Therefore,discrete deposition of micronized BUD and inhalation lactose could be expected in human lungs but not in the animal lungs in this study.In other words,most of the drug particles are expected to stay attached to the lactose surface during passive insufflation into rats’ trachea,and only the free fraction of micronized BUD will reach deep lungs.This scenario is elaborated in the Supplementary data Appendix B.3.2.Droplets size of aerosolized BUD-NC
The droplet size of aerosolized BUD-NC was measured to assess the aerodynamic properties of BUD-NC.This approach differed from the one applied for the other two formulations since BUD-NC was a liquid formulation and we could assume that droplet size would be a better predictor of drug deposition in the lungs than diameter of solid particles i.e.,nanocrystals.The droplet size data were found to be d=18.60 ± 1.17 μm,d=27.90 ±1.78 μm,d=43.23 ±4.28 μm,and span=0.89 ±0.08.These values suggested that majority of aerosolized BUDNC was expected to deposit in the upper airway of the animal lungs by inertia.Namely,considering the mode of BUD-NC dosing in the pharmacokinetic study,and the fact the BUDNC was aerosolized by the MicroSprayerwithin the animal trachea tube,we postulated that majority of BUD-NC would impact on the first branch of the bronchea,and less BUD-NC would reach animal’s alveoli.
3.3.In vivo pharmacokinetic data
Fig.
1
.
shows the plasma concentration-time course of BUD intravenous injection,and BUD-PT,BUD-NC and BUDNEM following intratracheal administration to rats.BUD-PT exhibited quick absorption and reached Cat ca .5 min.BUDNC exhibited even faster absorption (T=2 min),so it was not possible to observe an absorption phase.Among the tested formulations,BUD-NEM exhibited the slowest absorption rate and concomitant drug entry to systemic circulation.3.4.In vivo and in silico pulmonary deposition
The deposition patterns of BUD-PT,BUD-NC and BUD-NEM in the animal lungs,obtained from the in vivo assessment[15] are shown inFig.
2
A
,and denoted as D1.The lung deposition of the investigated formulations (BUD-PT,BUD-NC and BUD-NEM) in the animals predicted by MPPD is shown inFig.
2
B
.In order to be used as inputs in the PCATmodel to determine drug absorption,these data (in particular,MPPD generated drug deposition in tracheobronchial region) had to be converted to the deposited drug fractions in thoracic and bronchiolar regions,as shown inFig.
2
C
,and denoted as D2.The conversion of data fromFig.
2
B
to the data inFig.
2
C
is explained in Supplementary data Appendix A.The in vivo results for the inhaled microparticles (BUDNEM) showed that the deposited drug fraction in alveoli(61.00%) was much higher than the in silico estimated value(3.29%).Such a difference can be explained by the fact that current in silico pulmonary models are not able to simulate mucoadhesion of BUD-NEM particles (composed of HA as a mucoadhesive polymer),which has been demonstrated in the in vitro study [14] .The difference between observed(36.80%) and predicted (0.02%) fractions of drug deposited in alveoli for the inhaled nanocrystals (BUD-NC) was also pronounced,most likely because MPPD predictions were based on the average droplet size (d=27.90 μm) while in the in vivo environment these droplets might disperse due to impaction (droplets were ejected using high speeds).In the case of BUD-PT formulation,the predicted alveolar fraction(4.88%) was also lower than the observed one (19.08%) but the difference was not as pronounced as in the case of other two formulations.In order to estimate the prediction power of the in silico generated (D2) vs the in vivo determined drug deposition data (D1),both sets of data were used as inputs for BUD absorption simulations.In addition,we have tested the alternative scenarios based on the more realistic assessment of insufflated BUD-PT aerodynamic performance(Supplementary data Appendix B).
3.5.In silico model construction
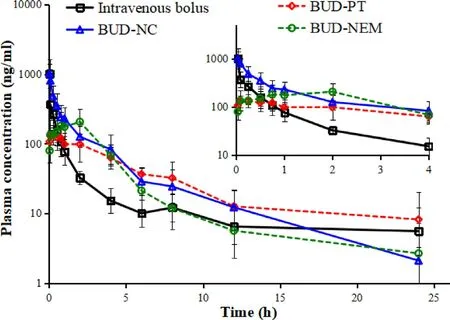
Fig.1–Plasma concentration-time profiles for intravenously and intratracheally administered BUD formulations (mean ±SD,n=5).The insert shows the zoomed region of 0–4 h.

Fig.2–Pulmonary deposition data for formulations BUD-PT,BUD-NC and BUD-NEM:in vivo determined (D1 deposition) (A),in silico (MPPD) predicted (B),converted from MPPD to GastroPlus TM identifiable data (D2 deposition) (C).
In order to generate an in silico drug-specific absorption model,input data have to be carefully selected and justified.However,some parameter values may be associated with certain level of uncertainty.PKPlusanalysis of the intravenous data indicated that BUD pharmacokinetics in rats can be described by three-compartmental model.The calculated pharmacokinetic parameters are provided inTable
1
.Simulations results for BUD intravenous bolus administration in rats are shown onFig.
3
,along with the in vivo observed values.It can be noted that the course of the predicted plasma concentration-time profile is in good agreement with the observed data.However,the predicted C(4505.30 ng/ml) was more than four times higher than the observed C(1012.40 ng/ml).This discrepancy may be explained by the late first sampling time in the in vivo experiment.Namely,it is likely that the real Cwas missed because e.g.,first sampling could not be performed quickly enough to capture the real Cvalue.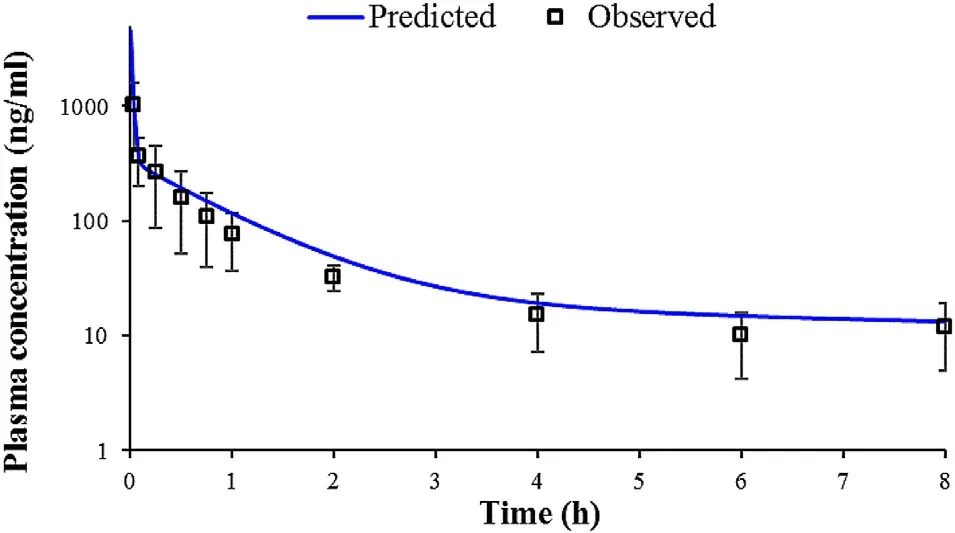
Fig.3–Predicted and observed mean plasma concentration-time profiles following 1.70 mg/kg BUD intravenous bolus administration in rats.
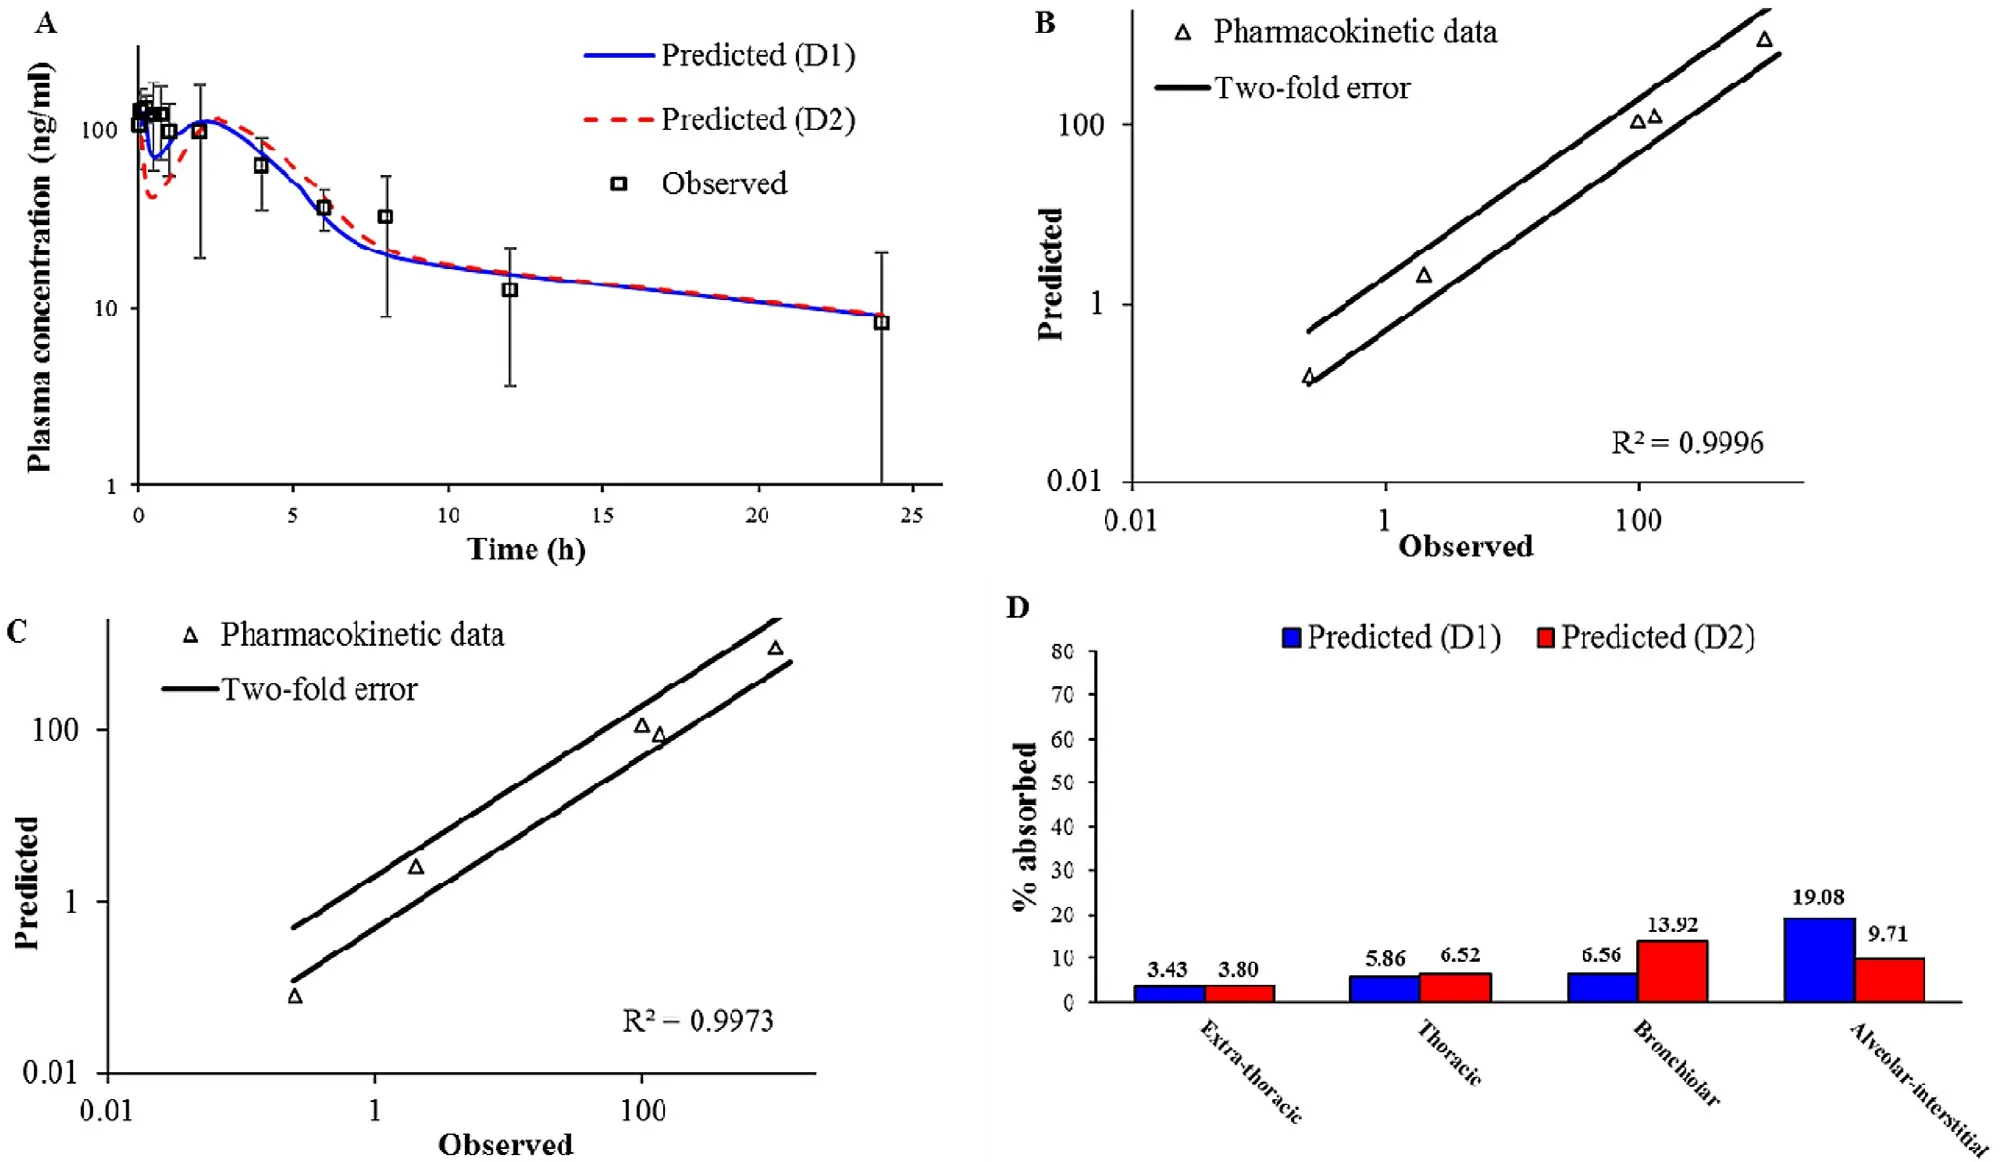
Fig.4–Intratracheal administration of BUD-PT (1.92 mg/kg BUD):predicted and observed mean BUD plasma concentration-time profiles (A);comparison of the observed and predicted pharmacokinetic parameters:C max1,T max1,C max2,T max2 and AUC 0 → ∞ (markers) where lines represent two-fold error for the observed pharmacokinetic parameters based on D1 deposition data (B) based on D2 deposition data (C);predicted BUD regional absorption profile from the lungs (D).
3.6.In silico model exploration
3.6.1. Formulation (i) BUD-PT
Based on the same input dataset as for intravenous bolus injection,and using the additional input parameters to describe drug performance in the pulmonary compartments(Table
1
),the generated model was used to predict BUD absorption following intratracheal administration of BUD-PT to rats.Pulmicortperformance in humans have already been addressed in literature [16,23—25],but deposition data for intratracheally administered BUD in rats are lacking,and BUD pharmacokinetic data in rats are rather scarce [14,26] .Fig.
4
A
shows the simulated BUD plasma concentrationtime profiles following intratracheal administration of BUDPT using two different deposition inputs (D1 and D2).The predicted pharmacokinetic parameters are provided inTable
3
.In both cases,the simulations indicated two peaks in the pharmacokinetic profiles.These two peaks are also visible in the mean in vivo observed profile.The first peak represents BUD absorption from the lungs,while the second peak signifies drug absorption from the gastrointestinal (GI)tract.Such performance can be explained by pulmonary drug deposition i.e.,high fraction of drug dose deposited in the upper parts of the respiratory tract (Fig.
2
),which will be cleared by mucociliary clearance,and eventually swallowed.Another observation considering BUD-PT is that D1 deposition input resulted in better prediction of the in vivo determined mean plasma profile,as illustrated by higher Rvalue (Fig.
4
B
and4
C
).However,both profiles simulated based on D1 and D2 deposition inputs provided reasonable prediction of the actual in vivo profile since the error between the predicted and observed pharmacokinetic parameters was less than two folds (Table
3
,Fig.
4
B
and4
C
).In addition,regional drug absorption patterns from the lungs were similar for D1 and D2 deposition inputs (Fig.
4
D
).This finding signifies that,in the case of non-mucoadhesive inhalation powders,certain differences between in vivo determined and in silico predicted drug deposition profiles in the lungs would not notably impair the prediction power of the in silico drug absorption simulations.In other words,the results suggest that,if the in vivo deposition data are lacking,in vitro aerodynamic assessment of non-adhesive inhalation powders may suffice in providing inputs for reasonably good prediction of drug absorption profile.3.6.2. Formulation (ii) BUD-NC
In the next step,BUD-specific in silico model was used to simulate drug absorption following intratracheal administration of BUD-NC.As in the case of BUD-PT,the predictions of BUD absorption from BUD-NC were performed for two different deposition data inputs (D1 and D2).The simulation results based on different solubility inputs(Fig.
5
A
andTable
4
) clearly demonstrate that BUD pulmonary solubility is one of the key factors affecting its absorption.Namely,under the assumption that BUD dissolution in the lungs is governed by the input solubility (0.05 mg/ml),peak drug absorption from BUD-NC formulation (profiles"Predicted,Cs (pulm) 0.05 mg/ml (D1)" and "Predicted,Cs(pulm) 0.05 mg/ml (D2)" inFig.
5
A
) would be much lower than observed in vivo .
Table 3–Predicted and observed pharmacokinetic parameters for BUD-PT (1.92 mg/kg BUD).

Table 4–Predicted and observed pharmacokinetic parameters for formulation BUD-NC (2.23 mg/kg BUD).
To explain the reasons for rapid drug absorption following intratracheal aerosolization of formulation BUD-NC,we assumed that BUD in vivo dissolution from the nebulized nanosuspension formulation is faster and more complete than expected based on the initial input solubility value,most likely because of the nanosize effect on drug particle dissolution and the presence of additional water (to dissolve the drug) in the nebulized droplets.This hypothesis has also been supported by Yang et al . [26] who commented that BUD nanosuspension (with average particle diameter less than 0.5 μm) behaved more like solution than conventional suspension.Also,Yang et al . [26] annotated that high BUD permeability across lung epithelial cells,along with the lack of major first pass metabolism,contributed to rapid absorption of the aerosolized drug.In addition,it has been annotated in literature that nanocrystals/nanoparticles possess increased surface to volume ratio in comparison to larger particles(i.e.,microparticles),which leads to notable increase in drug dissolution rate and saturation solubility [27—32] .To simulate enhanced BUD dissolution from BUD-NC nanosuspension,and a scenario where drug solubility and dissolution are not limiting factors for drug absorption,pulmonary drug solubility was increased to 10 mg/ml.In addition,the model assumed fast drug absorption from pulmonary compartments,as reflected in the high absorption rate constant (Table
1
).The predicted plasma concentration-time profiles based on the optimized input value for pulmonary drug solubility (profiles"Predicted,Cs (pulm) 10 mg/ml (D1)" and "Predicted,Cs (pulm)10 mg/ml (D2)" inFig.
5
A
) matched the in vivo observed profile well.As visible inFig.
5
A
,these two plasma concentrationtime profiles partially overlap.Fig.
5
A
andTable
4
illustrate the differences in the estimated BUD absorption from formulation BUDNC,depending on the input deposition data and drug solubility value.The differences between the predicted pharmacokinetic parameters based on D1 and D2 deposition inputs were pronounced solely in the case when drug solubility was the limiting factor for dissolution (initial solubility of 0.05 mg/ml),and were caused by the differences in the fraction of drug deposited in alveolar region.Higher fraction of drug deposited in alveoli in the case of D1 deposition led to faster drug absorption (Table
4
).On the other hand,simulations based on the assumption that BUD solubility from a nebulized suspension would not impair particle dissolution and absorption (solubility of 10 mg/ml)demonstrate that both D1 and D2 deposition inputs yield similar prediction outcomes (Table
4
).In both cases,the simulated pharmacokinetic parameters were within two-fold error of the mean observed data,except T max predicted based on D2 deposition (Table
4
,Fig.
5
B
and5
C
).Although not visible in the drug plasma concentration profiles,the only difference here lies in the pulmonary regional drug absorption (i.e.,the highest fraction of inhaled drug in the case of D1 deposition was absorbed from alveoli,while in the case of D2 deposition the drug was predominantly absorbed from bronchiolar region),as illustrated inFig.
5
D
.Overall,modeling results demonstrated that increasing drug solubility was the essential step to obtain meaningful prediction results for BUD-NC.In other words,data for the formulation BUD-NC revealed that pulmonary solubility of a highly permeable drug is the key factor affecting its pulmonary absorption from the nanosuspension,and if the solubility of such particles is high enough,the type of deposition data (in vivo vs .in silico) would not influence the simulation results in terms of drug plasma concentration profile (Fig.
5
A
).However,accurate particle deposition profile is important for the prediction of regional drug absorption from the lungs (Fig.
5
D
).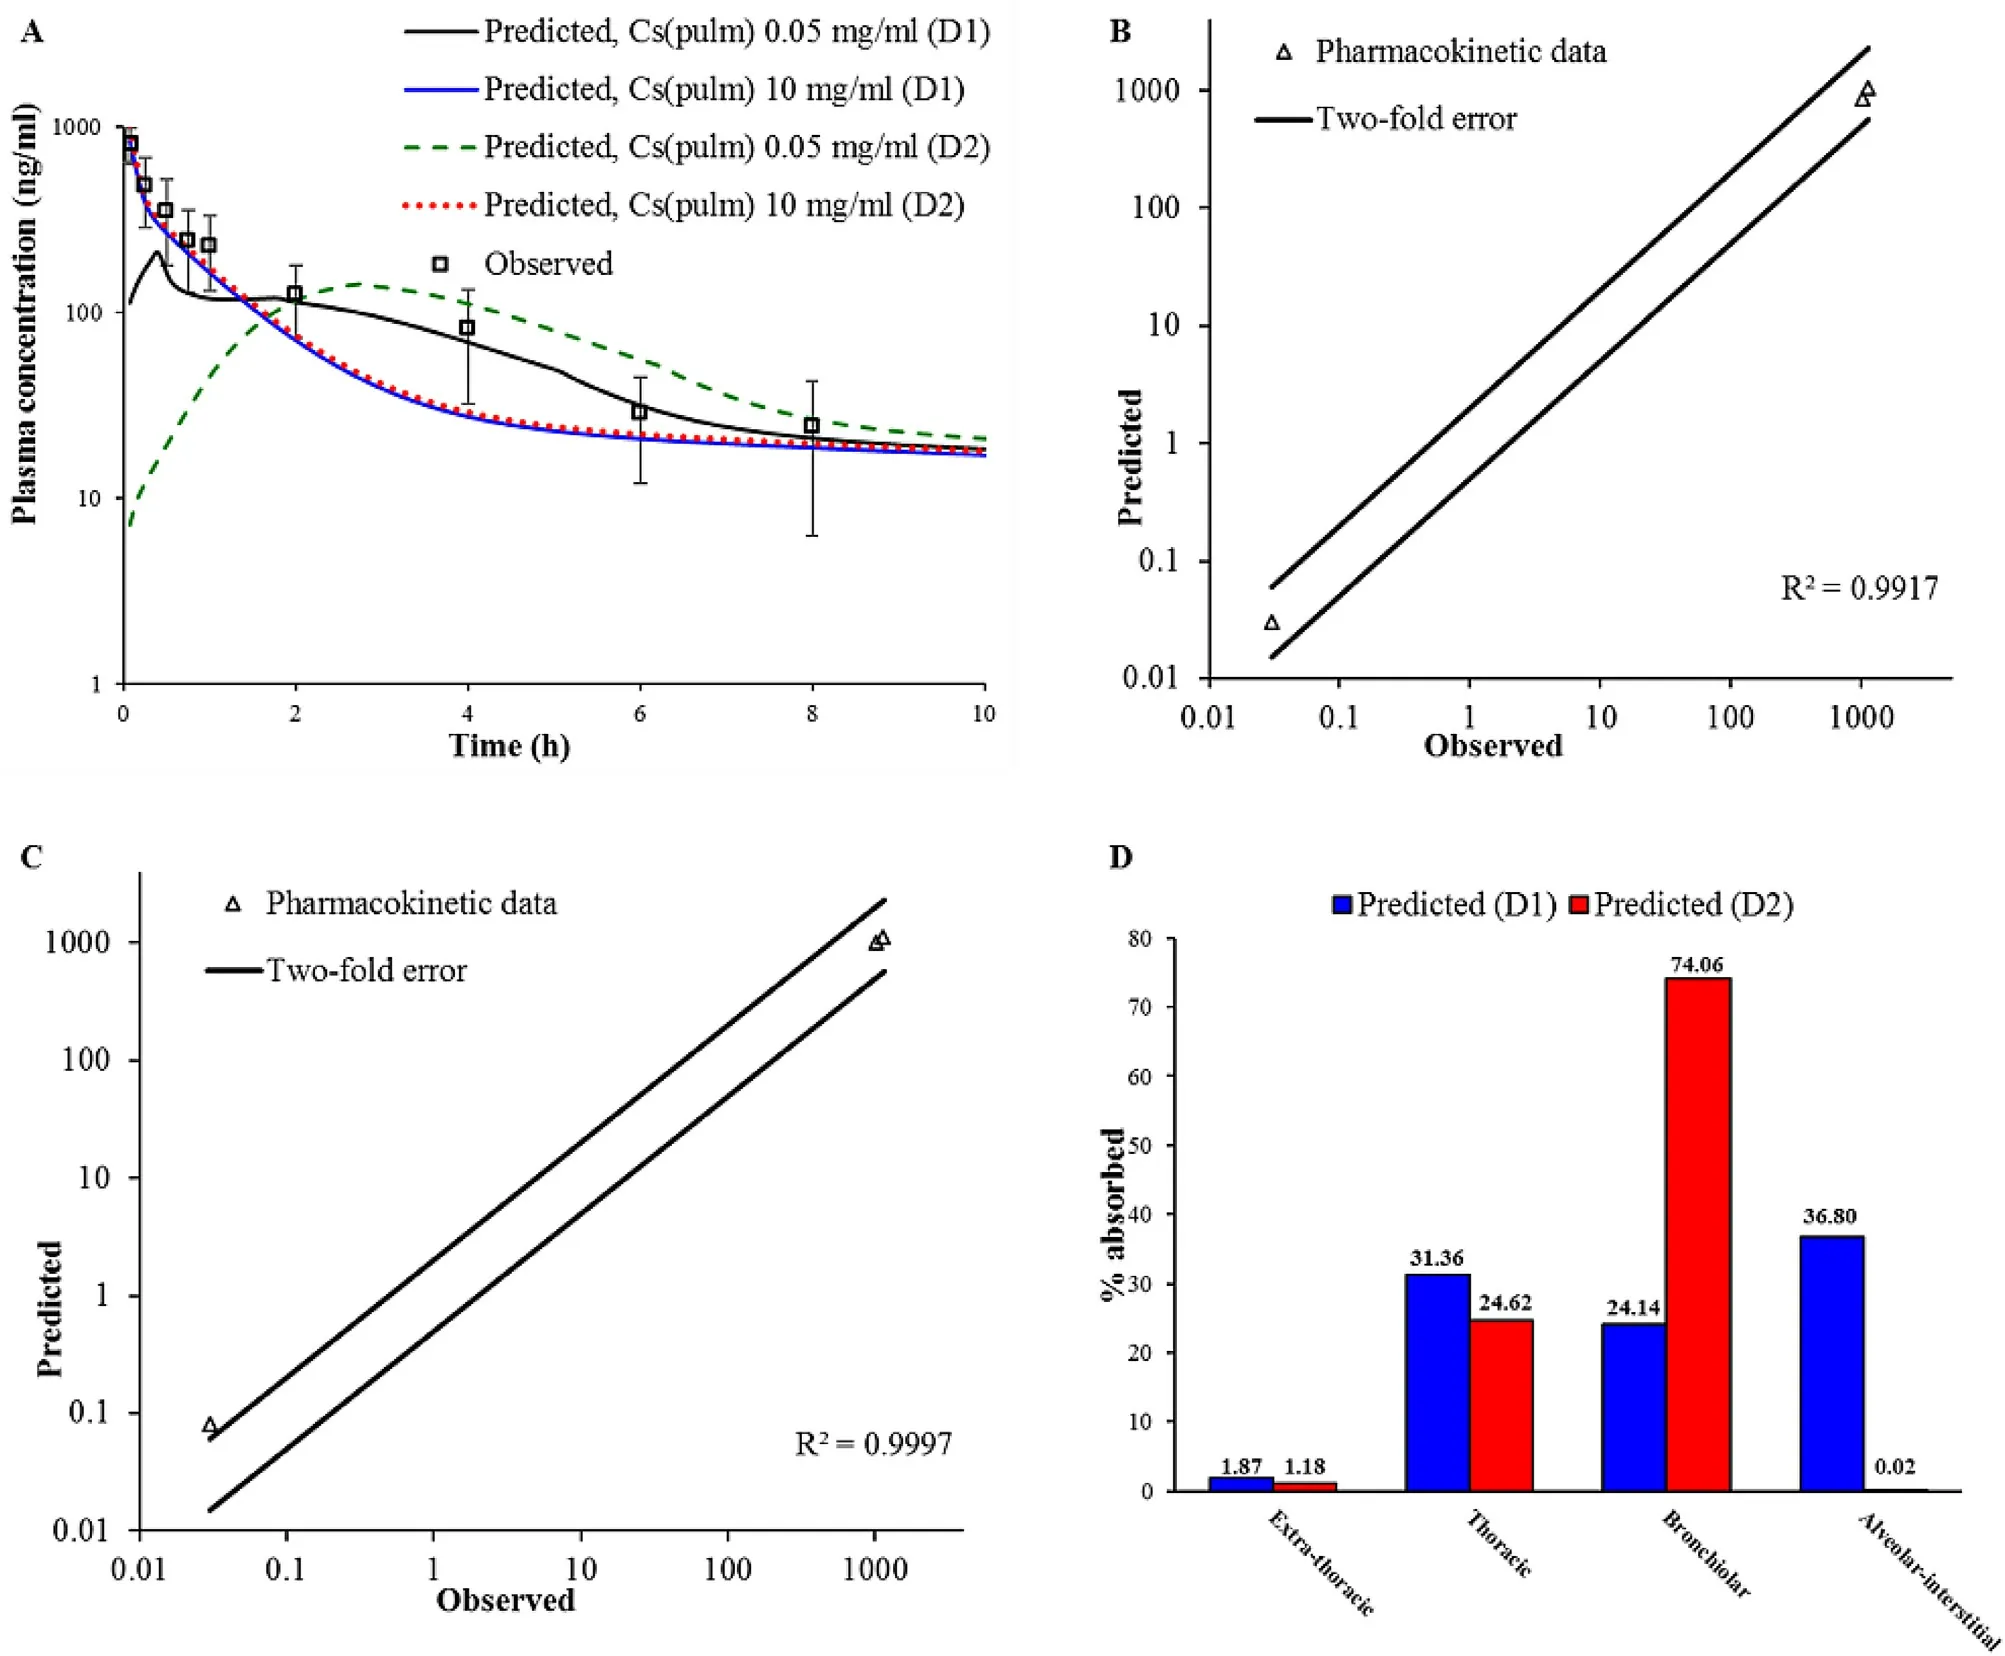
Fig.5–Intratracheal administration of BUD-NC (2.23 mg/kg BUD):predicted and observed BUD mean plasma concentration-time profiles (A);comparison of the observed and predicted pharmacokinetic parameters:C max,T max and AUC 0 → ∞ (markers) assuming drug solubility of 10 mg/ml where lines represent two-fold error for the observed pharmacokinetic parameters:based on D1 deposition data (B);based on D2 deposition data (C);predicted BUD regional absorption profile from the lungs (D).
3.6.3. Formulation (iii) BUD-NEM
An additional challenge in exploring the generated BUDspecific absorption model referred to the simulation of drug absorption following intratracheal administration of BUDNEM.The in vivo results (Fig.
1
) for BUD-NEM demonstrated delayed drug absorption.According to Liu et al . [14],such performance can be attributed to the pronounced mucoadhesion of HA microparticles,and consequently,prolonged drug retention in the lungs.In silico simulation of delayed drug absorption was difficult because the software built-in PCATmodel is not able to simulate prolonged particle mucoadhesion,and prolonged drug retention and dissolution in the lungs.Namely,the current version of the PCATmodel does not offer the option to use drug pulmonary retention time and dissolution data as inputs for the simulations.Therefore,an alternative approach of changing drug absorption rate constant (k) was applied,which has been proved by Bhagwat et al . [33] .Sensitivity of the predicted pharmacokinetic parameters to the input kvalues was first tested using Sensitivity Analysis,and the obtained data indicate marked influence of this parameter on drug absorption from BUD-NEM formulation (e.g.,sensitivity analysis for alveolar kresulted in SC=0.73 for C max and SC=-3.37 for T).It should be noted here that a parameter is classified as having a high influence on the output value if SC ≥0.5 [34] .In order to illustrate the effect of k,we’ve tested three different scenarios referring to different kvalues (noted in Table 5).
Fig.
6
A
andTable
5
illustrate the effect of different kvalues on the predicted BUD plasma profile following intratracheal administration of formulation BUD-NEM,assuming the invivo determined (D1) input deposition data.The initial kvalue (9.30 ×101/sec),representing fast drug absorption,resulted in relatively good prediction of BUD Cand AUCfollowing administration of BUD-NEM,but the predicted rate of drug absorption in terms of T(0.64 h) deviated from the mean in vivo observed value (2.00 h).On the other hand,when ten times decreased kvalue (9.30 ×101/s)was tested as input,the resulting Cwas much lower than the mean in vivo value,and the predicted time to peak plasma concentration (2.88 h) exceeded the in vivo observed T.Only the predicted AUCstayed relatively unaffected,regardless of the input k.The optimal input k a value,that resulted in the best matching between the predicted and mean observed pharmacokinetic parameters,was 2.93 ×101/s.The predicted Cbased on this k a,was lower than the mean observed value,but fitted into the range of individually observed values (121.95—360.70 ng ·h/ml).In addition,the shape of the predicted plasma concentrationtime curve matched the observed profile well (Fig.
6
andTable
5
).
Table 5– The influence of different ka values on the predicted pharmacokinetic parameters for formulation BUD-NEM(1.84 mg/kg BUD).

Fig.6–Intratracheal administration of BUD-NEM (1.84 mg/kg BUD):the influence of different k a values on the predicted BUD plasma concentration-time profiles based on D1 deposition data (A);based on D2 deposition data (B);comparison of the observed and predicted (based on ka of 2.93 ×10 −3 1/sec) pharmacokinetic parameters:C max,T max and AUC 0 → ∞ (markers)where lines represent two-fold error for the observed pharmacokinetic parameters based on D1 deposition data (C);based on D2 deposition data (D);predicted BUD regional absorption profile from the lungs (E).
The prediction results based on the in silico estimated drug deposition (D2) and different input kvalues are provided inFig.
6
B
andTable
5
.It can be seen that the influence of different input kvalues on the predicted drug plasma profiles is not that pronounced as in the case of D1 deposition,probably because the fraction of drug deposited and absorbed from alveoli is much lower than for D1 deposition.The obtained data,based on the optimized kvalue(2.93 ×101/s),indicate that the in vivo determined BUDNEM deposition in the lungs (D1) provided better prediction of BUD in vivo plasma profile in comparison to the in silico estimated D2 deposition (Table
6
).These results imply that in silico (MPPD) modeling may not accurately predict pulmonary drug deposition in rats,and if possible,it is preferable to use in vivo determined drug deposition data to predict the expected drug absorption profile.In other words,for this kind of formulations,in vivo animal deposition studies are needed.This is also evident inFig.
6
C
and6
D
showing that all the pharmacokinetic parameters,predicted based on D1 deposition and the optimized k(2.93 ×101/s),were withintwo-fold error of the mean observed data,while the predicted C max corresponding to D2 deposition lied on the borderline.Consequently,the calculated Rbetween the observed and predicted values was higher for the prediction based on D1 deposition (Fig.
6
C
and6
D
).
Table 6–Predicted (based on ka of 2.93 ×10 −3 1/sec) and observed pharmacokinetic parameters for formulation BUD-NEM(1.84 mg/kg budesonide).
The prediction results (based on the optimized kvalue of 2.93 ×101/s) showing regional lung distribution of BUD absorption following intratracheal administration of BUDNEM in rats are depicted inFig.
6
E
.It can be observed that the fraction of BUD absorbed from alveoli in the case of D1 deposition is higher than in the case of D2 deposition.This can be explained by the pronounced differences in fractions of the drug deposited in alveoli between D1 and D2 deposition(Fig.
2
).Overall,in silico modeling results indicate that prediction of drug absorption pattern following administration of an inhaled formulations with pronounced mucoadhesive properties is rather challenging due to difficulties in determining drug absorption rate constant from the lung compartments.The approach applied in this study,based on the optimization of k a value,can be used for rough predictions of pulmonary drug absorption when drug plasma exposure data are available to validate the simulation data.However,such an approach is not applicable in the early phases of formulation development,before conduction the in vivo pharmacokinetic studies.
4.Conclusion
In this study,we tested the value of in vitro-in vivo-in silico approach using inhaled BUD formulations in a rat model,and highlighted the importance of input parameters to predict the expected drug pharmacokinetic outcome.Our findings include the following:
(i) In vitro-in silico predicted pulmonary drug deposition might serve as a suitable alternative to predict drug absorption following inhalation of relatively simple formulations such as non-mucoadhesive nanosuspensions or dry powders for inhalation.Considering that in vivo drug particle deposition studies are laborious and time-consuming,a simplified in vitro-in silico approach may facilitate the development of new inhaled formulations in a competitive pharmaceutical industry environment.(ii) The in vitro-in vivo-in silico approach used in this study was found helpful in determining the absorption patterns of inhaled BUD formulations with different biopharmaceutical properties.Since determination of fraction of drug absorbed through the lungs is an important issue in the development of inhaled formulations,the proposed approach may facilitate the decision on the promising formulation in terms of providing the desired drug absorption profile.(iii) Moreover,in silico modeling enabled to elucidate the differences in drug regional absorption distribution in the lungs depending on particle deposition data,even in cases when differences in drug pulmonary deposition were not reflected in the estimated drug plasma concentration profiles (i.e.,as in the case of BUD-NC formulation).Such mechanistic analysis,which cannot be determined in vivo,is highly important in the development of inhaled formulations for targeted drug delivery/absorption in a particular lung compartment.(iv) In silico tools need to be improved in order to better simulate drug absorption profile following administration of inhaled formulations e.g.,by allowing the input of drug retention time in the lung(e.g.,prolonged drug retention due to mucoadhesion) along with drug release rate obtained under biorelevant in vitro conditions.
Conflicts of interest
The authors declare that there is no conflict of interest.
Acknowledgments
This work was supported by National Natural Science Foundation of China (Nos.81302720 and No.81573380) and Liaoning Pan Deng Xue Zhe Scholarship.This study was based upon work from COST Action MP1404 SimInhale ’Simulation and pharmaceutical technologies for advanced patienttailored inhaled medicines’,supported by COST (European Cooperation in Science and Technology),www.cost.eu .Part of this work was supported by the Ministry of Education,Science and Technological Development,Republic of Serbia(grant number 451-03-68/2020-14/200161).Cun D.is grateful to Liaoning Provincial Education officer’s Excellent Talents Supporting Plan for financial support.
Supplementary materials
Supplementary material associated with this article can be found,in the online version,at doi:10.1016/j.ajps.2020.12.001 .
杂志排行
Asian Journal of Pharmacentical Sciences的其它文章
- Advances of mRNA vaccines for COVID-19:A new prophylactic revolution begins
- Exploring the potential of functional polymer-lipid hybrid nanoparticles for enhanced oral delivery of paclitaxel
- Innovative color jet 3D printing of levetiracetam personalized paediatric preparations
- pH-sensitive micelles self-assembled from star-shaped TPGS copolymers with ortho ester linkages for enhanced MDR reversal and chemotherapy
- Small changes in the length of diselenide bond-containing linkages exert great influences on the antitumor activity of docetaxel homodimeric prodrug nanoassemblies
- Recent advances of sorafenib nanoformulations for cancer therapy:Smart nanosystem and combination therapy
