Empirical Analysis on Performance Evaluation of A Pharmaceutical Company Based on Economic Value Added
2021-07-18LiMengHuangZhe
Li Meng ,Huang Zhe,2*
(1.School of Business Administration,Shenyang Pharmaceutical University,Shenyang 110016,China;2.Research Institute of Drug Regulatory Science,Shenyang Pharmaceutical University,Shenyang 110016,China)
Abstract Objective To establish an economic value added (EVA) performance evaluation system to maintain the competitiveness of pharmaceutical company A under the environment of fierce competition in the pharmaceutical industry.Methods An EVA performance evaluation model was established by adjusting the items of EVA performance evaluation index,such as after-tax profits,total invested capital and weighted average cost of capital rate.Results and Conclusion EVA values of pharmaceutical company A from 2014 to 2018 were calculated and compared with the traditional performance evaluation method,it was found that EVA performance evaluation model reflected the real performance of pharmaceutical company A.Therefore,pharmaceutical company A is doing well,but its growth rate is unstable.
Keywords:economic value added (EVA);pharmaceutical company A;performance evaluation
In recent years,with the rapid development of economy,the overall situation of Chinese pharmaceutical industry has grown significantly.Although the pharmaceutical industry can maintain the trend of continuous growth,it is under strict supervision because drugs are closely related to human health.At the same time,the market for drugs that have passed the patent protection period is highly competitive.If pharmaceutical companies want to make more profits,they need to constantly develop new drugs,which require high costs and risks.In December 2018,China officially announced the“4+7”volume procurement program,which means that the competition between generic drugs that pass the consistency evaluation and original drugs that are about to face patent protection expiration will be even more intense.Under such circumstances,pharmaceutical companies should use a more objective and scientific performance evaluation system to ensure their competitiveness.
1 Overview of the economic value added(EVA) performance evaluation system
1.1 The concept of EVA
EVA is a performance rating system that has developed rapidly since the 1990s.It can reflect the true performance of an enterprise and has been adopted by many companies both at home and abroad.It refers to the value of the company’s net operating profit after tax for a certain period of time,which is deducted from the total amount of capital invested,and the basic formula is as follows[1,2]:
EVA=Net operating profit after tax (NOPAT)–Total invested capital (TC) × Weighted average cost of capital (WACC) (Formula 1)
1.2 EVA indicator adjustment
EVA generally adjusts the following items when making indicator adjustments:
(1) Deferred income tax.Deferred income tax refers to the difference between the tax for book value in the financial statements and the tax according to the tax law.It does not affect the actual assets and total liabilities of the company.When calculating EVA,the deferred income tax assets shall be deducted from the after-tax net operating profit,or the deferred income tax liabilities shall be added[3].
(2) Non-business revenue and expenditure.Profits and losses unrelated to the company’s business activities are called non-business revenue and expenditure.It is not related to the operation of a company,so in calculating net operating profit after tax,extra-business expenses or deducted nonoperating income should be added[4].
(3) Financial expenses.It contains debt-related content,financial expenses should be added to net operating profit after tax[5].
(4) Assets devaluing reserve.The company finds risks in the impairment test and needs to withdraw various impairment provisions,it doesn’t mean that the company actually incurs losses,but it will reduce the profits of the current period.Therefore,in the adjustment,the provision previously accrued shall be added to the after-tax net operating profit.
(5) Project under construction.The company invested a lot of capital in the project under construction,it is a company’s future business investment,at present,it cannot generate profits.Therefore,in calculating the EVA,the project under construction should be excluded from the total amount of invested capital[6,7].
2 Performance evaluation analysis of pharmaceutical company A
2.1 Status of pharmaceutical company A
Pharmaceutical company A is a large-scale comprehensive company integrating pharmaceutical R&D,production,distribution,retail and logistics.At present,the traditional financial index with net profit is used to evaluate the performance of the company’s operation,but it ignores the cost of equity capital in the process of evaluation.When the cost of capital is less than the net profit,the management would think the company is in good operation,which is difficult to find some problems in the company.Therefore,it is not conducive to the management and development of pharmaceutical company A.
2.2 Calculation of EVA of pharmaceutical company A
According to the characteristics of the pharmaceutical industry and the specific situation of pharmaceutical company A,this study constructs the EVA performance evaluation model of pharmaceutical company A by referring to the“Interim Measures”on the institutional norms of EVA implementation formulated by the State-owned Assets Supervision and Administration Commission of China[8-10].
2.2.1 Net operating profit after tax
The following formula is used to adjust the net operating profit after tax (NOPAT):
Net operating profit after tax (NOPAT)=Net profit+Financial expenses × (1– Income tax rate)+Increased deferred income tax liabilities–Increased deferred income tax assets+(Non-business expenditure– Non-business revenue) × (1– Income tax rate)+Impairment of assets (Formula 2)
Since pharmaceutical company A was recognized as a high-tech enterprise from 2014 to 2018,it had to pay 15% income tax.However,the parent company and other subsidiaries were levied 25% of income tax.Therefore,this paper adjusts the income tax rate of pharmaceutical company A to obtain its average income tax rate (Table 1).
The net operating profit after tax from 2014 to 2018 is calculated in Table 2.
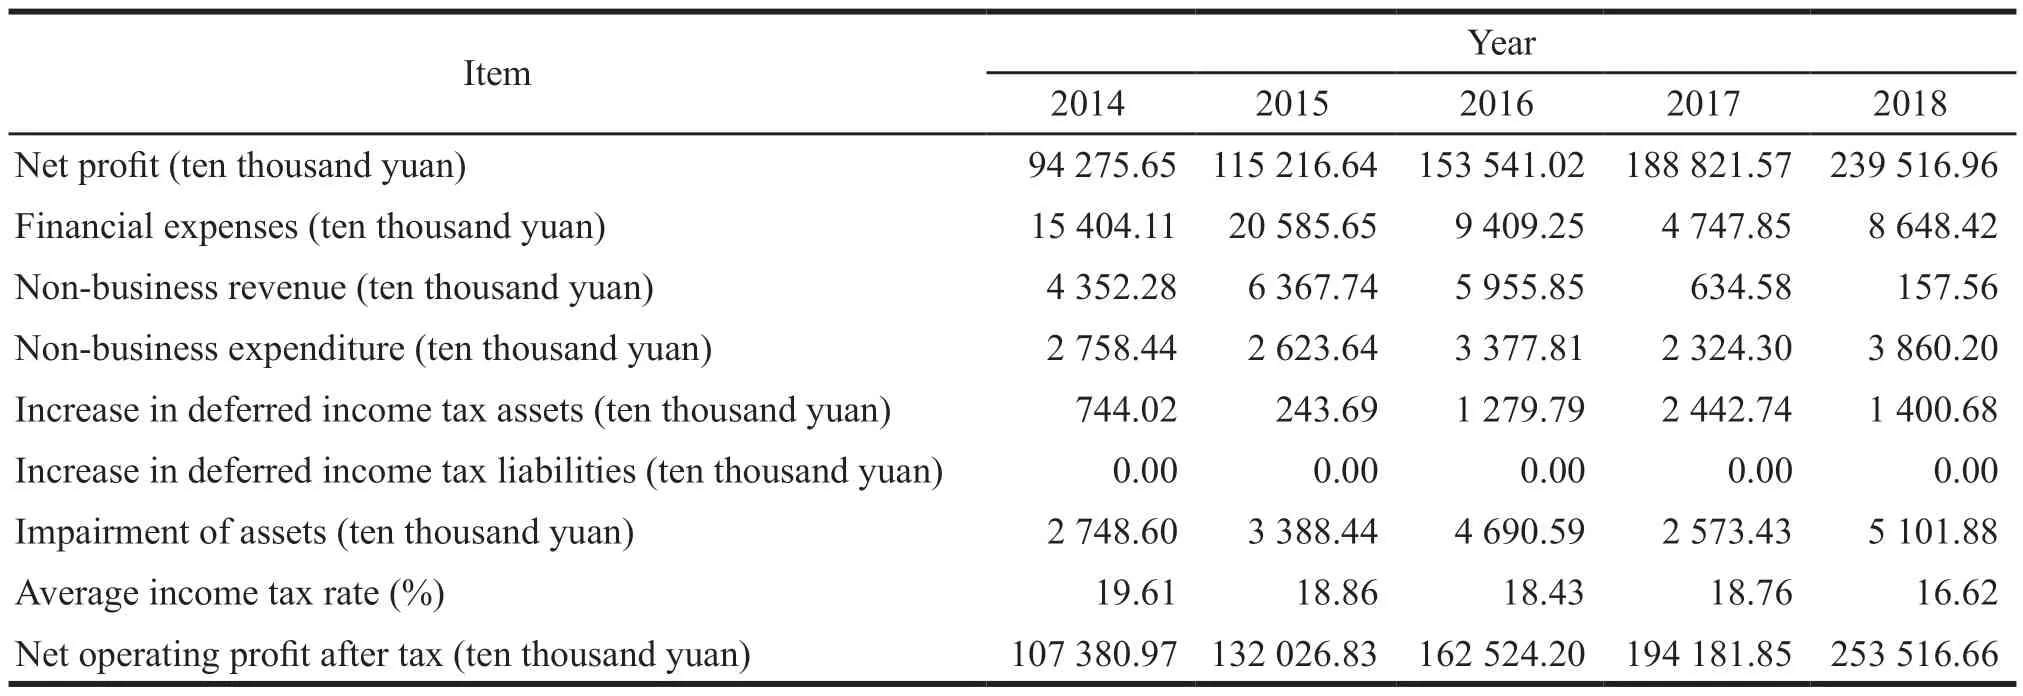
Table 2 Calculation of net operating profit of pharmaceutical company A after tax from 2014 to 2018
2.2.2 Calculation of the total invested capital
The total invested capital (TC) is calculated as follows[11]:
Total invested capital (TC)=Shareholder equity+Capital impairment provisions+Short-term borrowings+Non-current liabilities due within one year+Non-current liabilities– Debt payable bonds–Year-end deferred tax assets+Year-end deferred tax liabilities– Project under construction (Formula 3)
The calculation of the total capital invested by pharmaceutical company A from 2014 to 2018 is shown in Table 3.
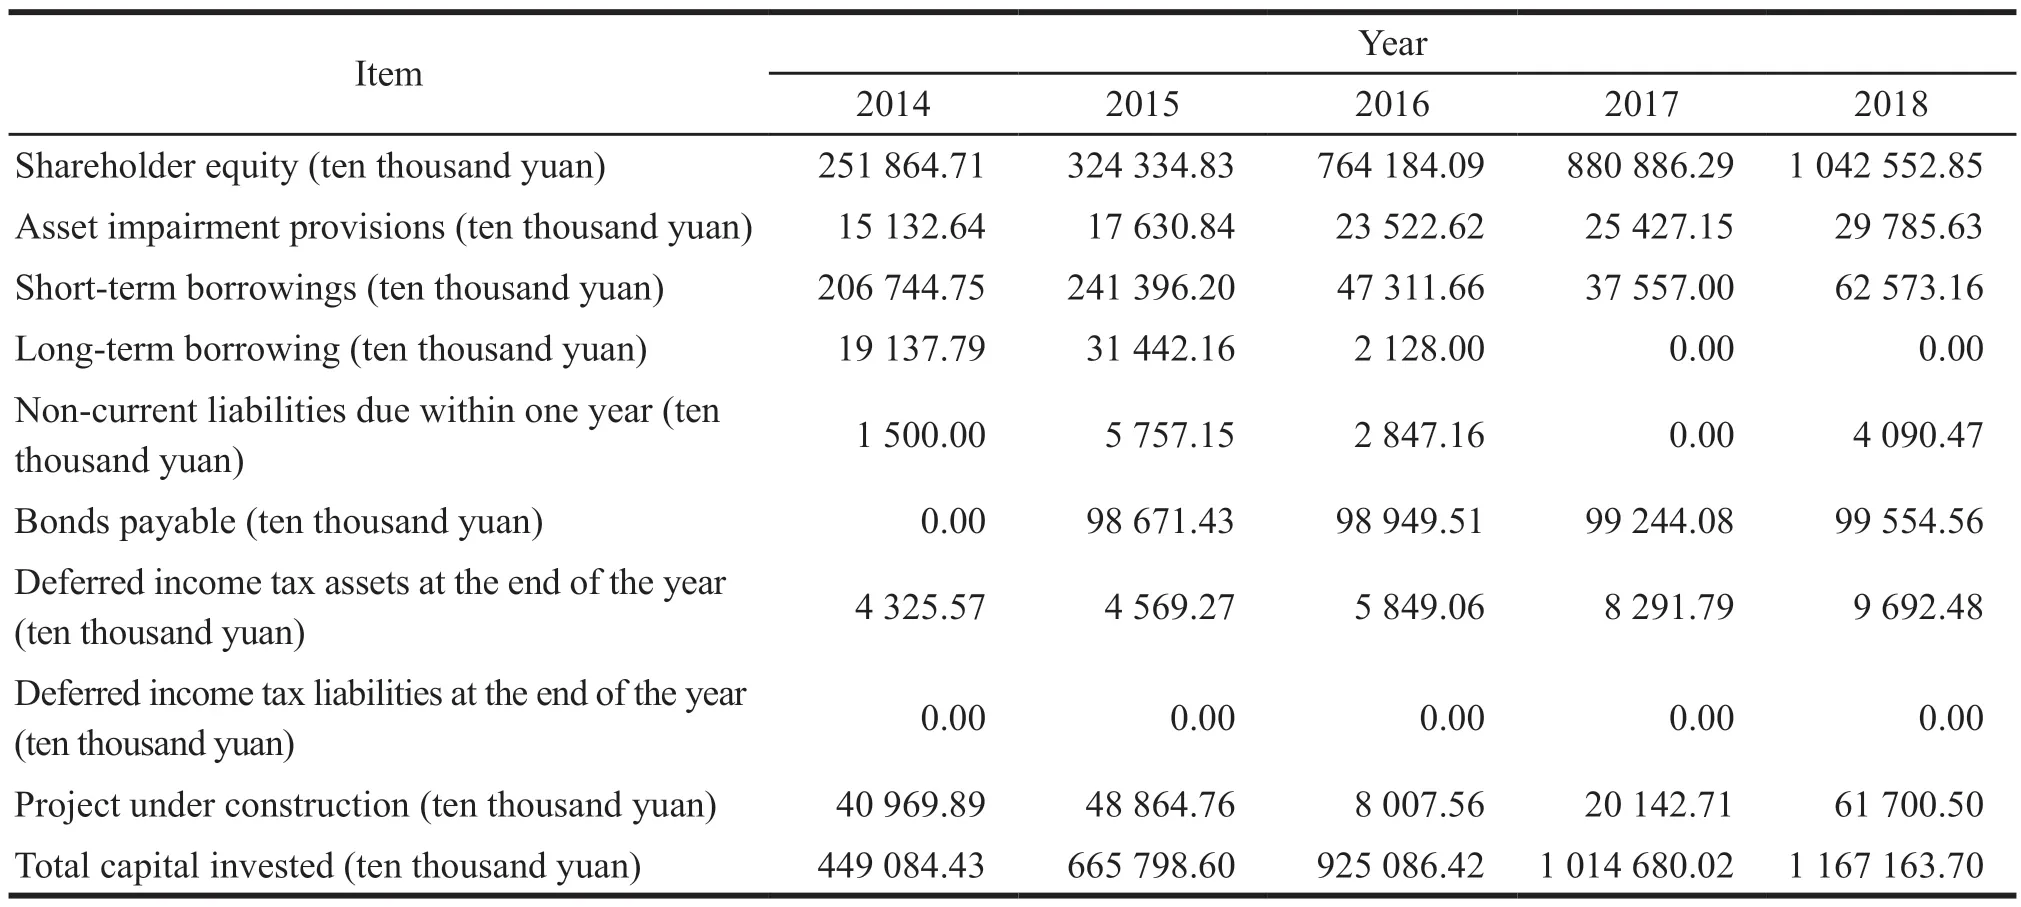
Table 3 Total invested capital of pharmaceutical company A from 2014 to 2018
2.2.3 Calculation of weighted average cost of capital
Weighted average cost of capital (WACC)consists mainly of the cost of debt capital and the cost of equity capital.It is calculated according to its proportion and the following is the formula[12].
Weighted average cost of capital (WACC)=Debt capital/Total capital × Cost of debt capital+Equity capital/Total capital × Cost of equity capital (Formula 4)
(1) Cost of debt capital.According to the research results of a large number of scholars at home and abroad,the cost of debt capital can be estimated using the bank deposit rate for the same period.So,this paper takes the medium and long term bank loan rate of one to five years as the cost of pre-tax debt capital,as shown in Table 4.
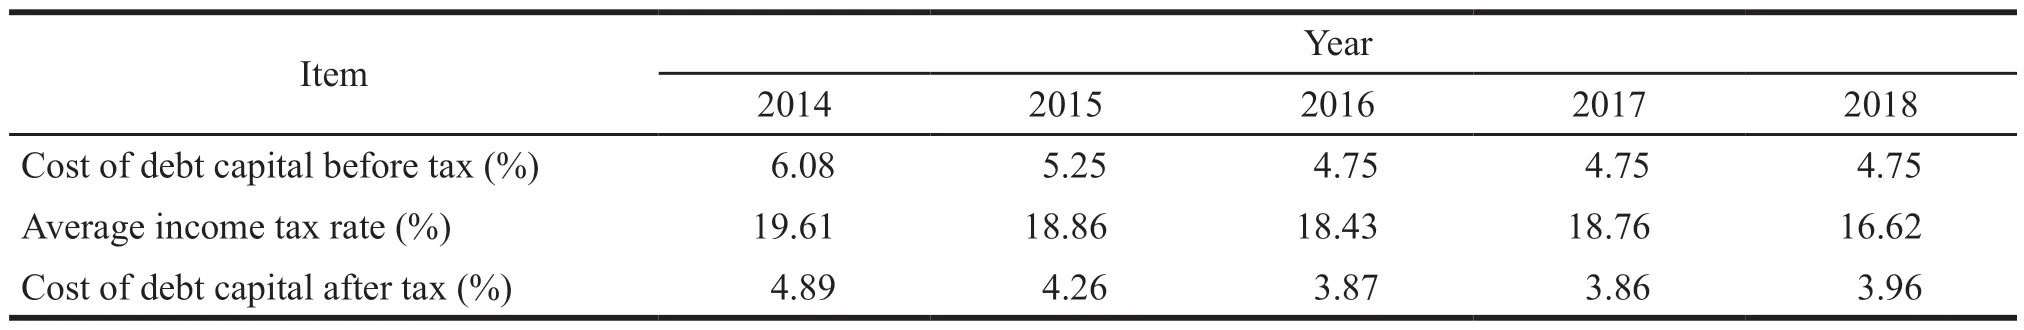
Table 4 Cost of debt capital of pharmaceutical company A from 2014 to 2018
(2) Cost of equity.The cost of equity is the rate of return that investors need to invest in a project.This study uses the capital asset pricing model for calculation,the formula of capital asset pricing model is as follows:
Expected return on assets (Ke)=Risk-free interest rateRf+Beta factor (β) × Equity market risk premium (Rm– Rf) (Formula 5)
a.Risk-free interest rate.Risk-free interest rate is the rate of return of an investment with no risk of financial loss.In this study,the one-year deposit rate in a bank is selected as the risk-free rate from 2014 to 2018 (Table 5).
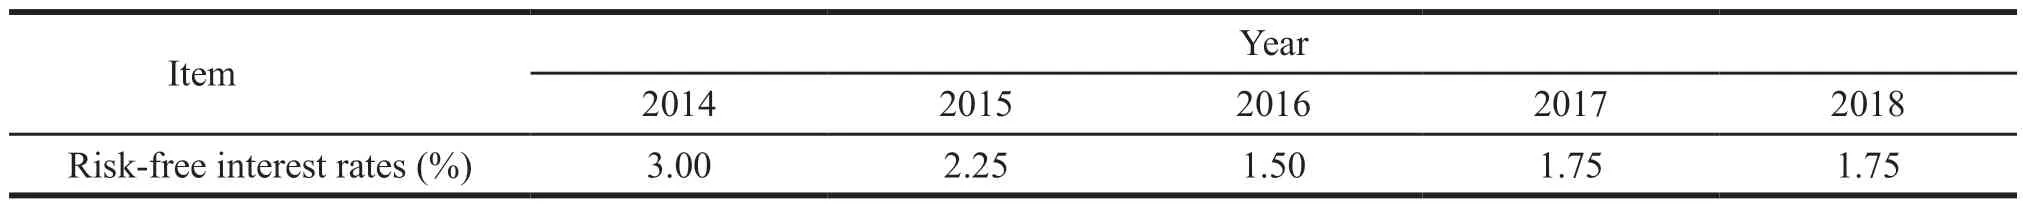
Table 5 Risk-free interest rate of pharmaceutical company A from 2014 to 2018
b.βvalue.Theβcoefficient represents a company’s sensitivity to risk in the entire market system and can be used primarily to measure the vulnerability of the company’s systemic risk.Since pharmaceutical company A is a public company,this study uses the“Tonghuashun”software to get theβcoefficient (Table 6).
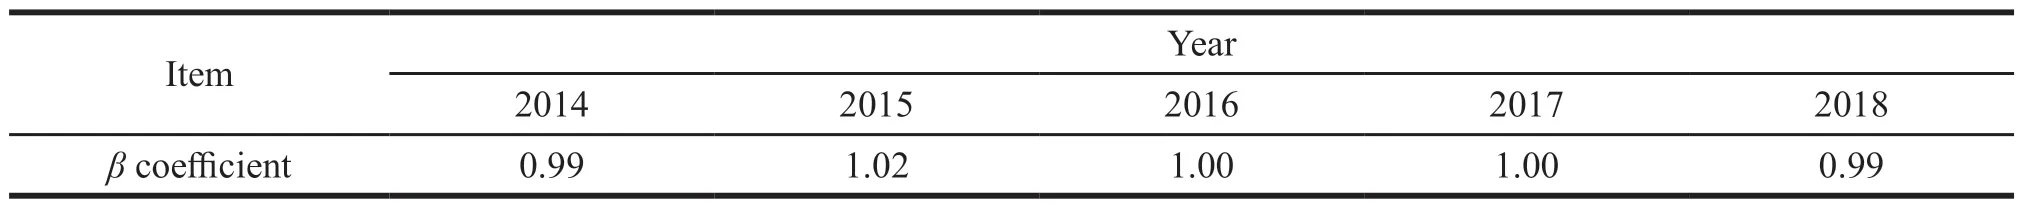
Table 6 β coefficient of pharmaceutical company A from 2014 to 2018
c.Equity market risk premium.Equity market risk premium is the difference between market risk interest rate and risk-free interest rate over a long time.The stocks included in the CSI 300 index are mature and stable,the average return rate of 9.17% of the CSI 300 index is selected as the market risk rate.The equity market risk premium is calculated as follows:
Equity market risk premium=Market risk rate(rm)– Risk-free rate (Rf) (Formula 6)
Equity market risk premium is as shown in Table 7.

Table 7 Risk premium in equity market of pharmaceutical company A from 2014 to 2018
The calculation of the cost of equity capital of pharmaceutical company A from 2014 to 2018 is shown in Table 8.
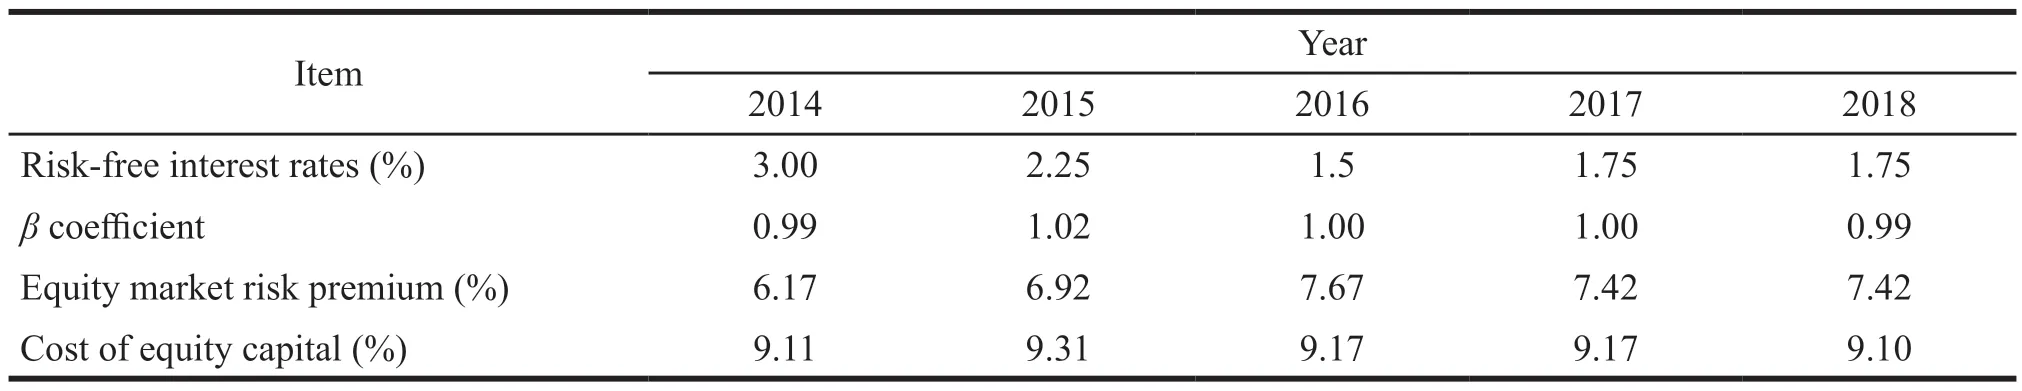
Table 8 Cost of equity capital of pharmaceutical company A from 2014 to 2018
(3) The proportion of capital cost.According to the financial statements of Pharmaceutical Company A from 2014 to 2018,the annual debt capital and equity capital account for the proportion of total capital are shown in Table 9,respectively.
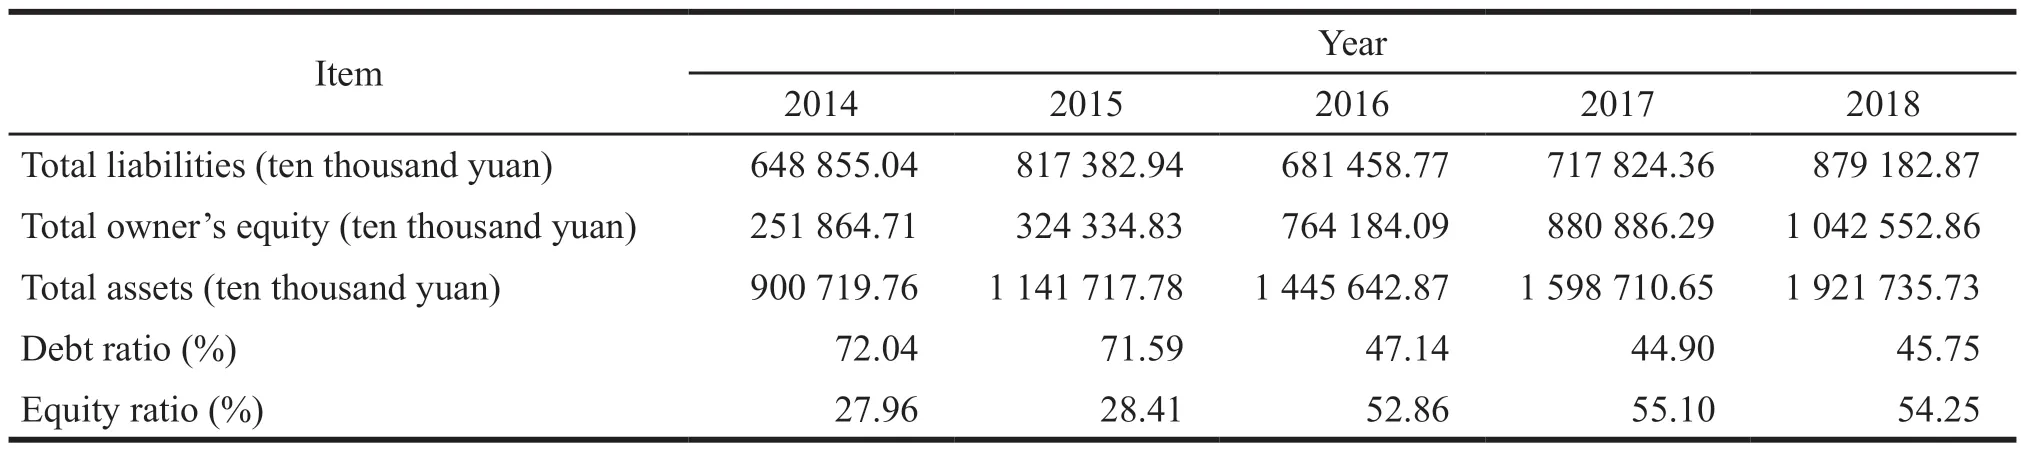
Table 9 Proportion of capital cost of pharmaceutical company A from 2014 to 2018
(4) Calculating the weighted average cost of capital.The calculation results of the weighted average capital cost of pharmaceutical company A from 2014 to 2018 are shown in Table 10.
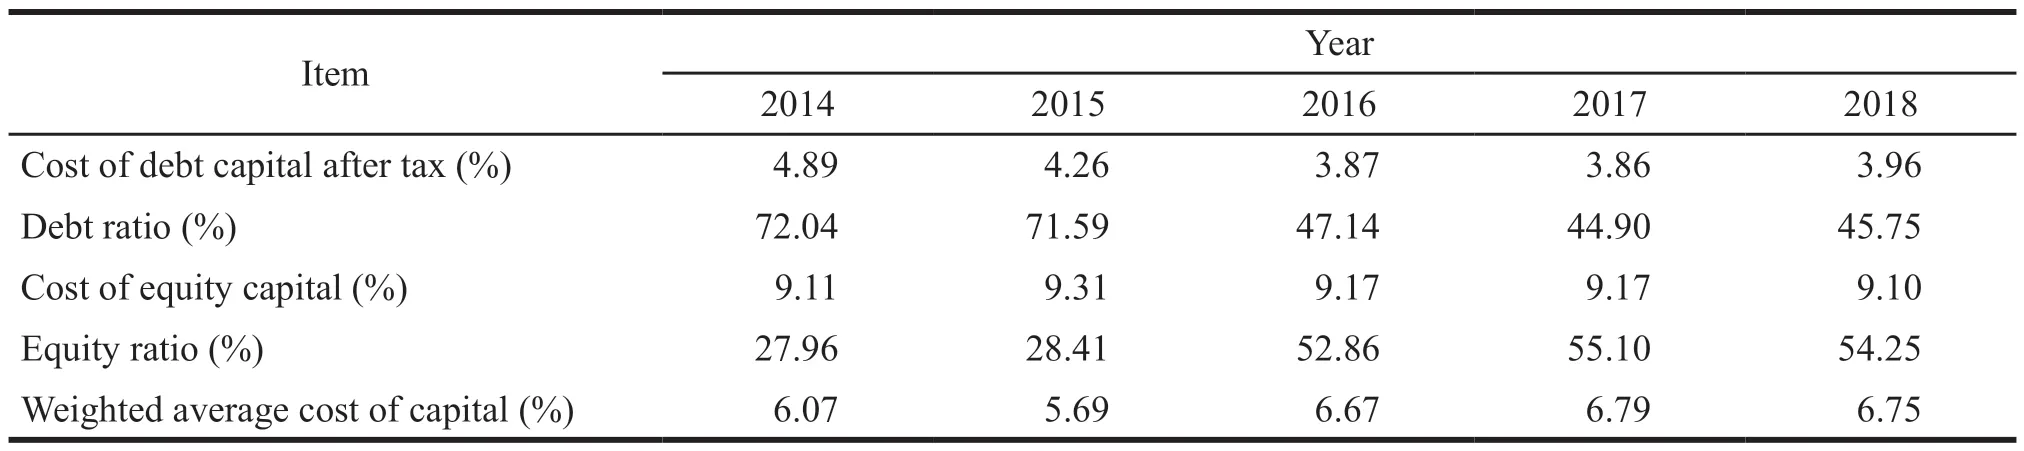
Table 10 Weighted average capital cost of pharmaceutical company A from 2014 to 2018
2.2.4 Calculation of EVA
According to formula 1,the EVA of pharmaceutical company A from 2014 to 2018 is calculated,and the calculation results are shown in Table 11.

Table 11 The EVA of pharmaceutical company A from 2014 to 2018
Table 11 shows that the EVA of pharmaceutical company A rose from 2014 to 2018,indicating that the company’s assets had been increasing from 2014 to 2018,and the company’s management capabilities are improving.Therefore,pharmaceutical company A can bring more returns to investors.However,the EVA growth rate decreased from 2015 to 2017,indicating that the growth rate of the company’s operating performance has dropped.Therefore,pharmaceutical company A is required to further improve its profitability.
3 Comparison of EVA with traditional performance evaluation indicators
3.1 Comparison of EVA and net profit value
the EVA and the value of net profit of pharmaceutical company A from 2014 to 2018 are shown in Table 12 and Fig.1.

Table 12 EVA and the value of net profit of pharmaceutical company A from 2014 to 2018

Fig.1 EVA and the value of net profit of pharmaceutical company A from 2014 to 2018
As can be seen from Table 12 and Fig.1,the EVA of and the net profit pharmaceutical company A have the same growing trend from 2014 to 2018.Among them,the EVA in 2014 is slightly less than net profit.A careful analysis of the financial statements reveals that the accounting cycle has more interestfree current liabilities,resulting in a smaller total amount of invested capital.It means the company generated a good profit by taking up fewer capital costs in 2014.
The EVA from 2015 to 2018 is greater than the net profit value,especially in 2016 and 2017.There is a large gap between net profit and EVA,and the value of net profit is 1.44 and 1.42 times of EVA value respectively.This situation occurs because in calculating the EVA of pharmaceutical company A,the non-business revenue and expenditure,asset impairment loss and other items in the net profit are adjusted.This can avoid the financial personnel to make artificial adjustments to the profit which will affect the company’s real operating performance.In addition,the cost of equity capital of the company will be ignored when calculating net profit.Therefore,net profit cannot be used to evaluate the performance of the company for it cannot really reflect the value created by the company for shareholders.As to the performance evaluation,pharmaceutical company A uses EVA performance evaluation model for it can reflect its true level and work out the correct development path.
3.2 comparison of EVA return rate and net asset return rate
Return rate of EVA (REVA) refers to the ratio of the company’s EVA to the total amount of capital invested over a period of time.Return on Equity(ROE) is the percentage of net profit and average shareholder equity.By comparing the two,we can learn more about the differences in the evaluation of the company’s performance (Table 13 and Fig.2).
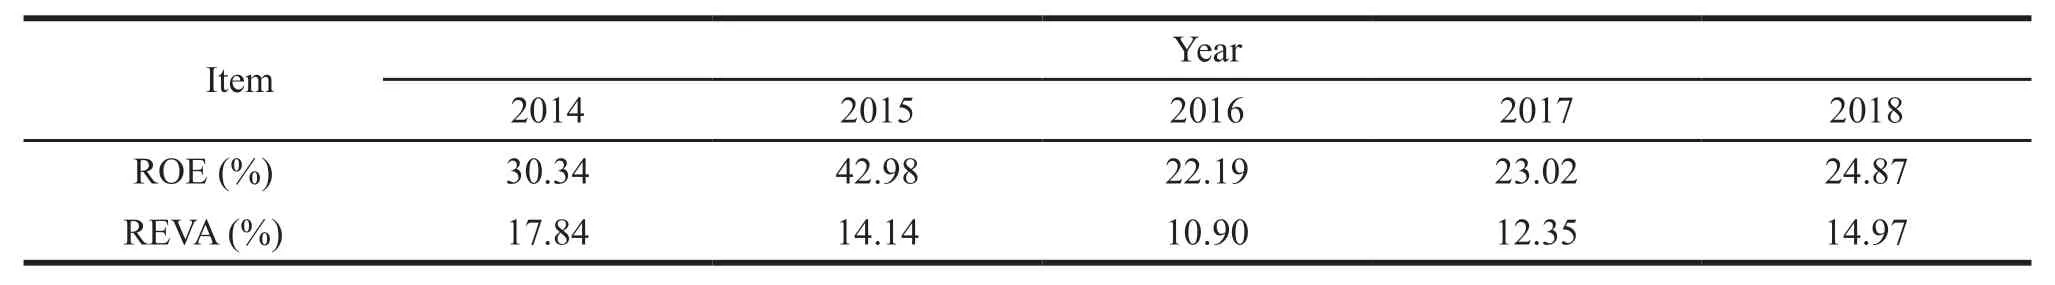
Table 13 REVA and ROE of pharmaceutical company A from 2014 to 2018
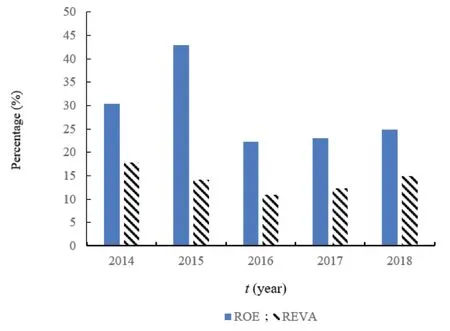
Fig.2 REVA and ROE of pharmaceutical company A from 2014 to 2018
As can be seen from Table 13 and Fig.2,from 2014 to 2018,the ROE and REVA of pharmaceutical company A are positive,indicating that the company is operating well.The return on assets value of pharmaceutical company A from 2014 to 2018 is higher than the EVA.Among them,the return on equity in 2015 is as high as 3.04 times of EVA.Even if the gap between the two indicators is small in 2018,the return on equity is also 1.66 times of EVA.The main reason for this is that EVA data is used to calculate the rate of return on EVA.Meanwhile,the net profit data is used for calculating the return on equity,and net profit does not take into account the cost of equity capital.
3.3 EVA per share vs.earnings per share
EVA per share refers to the ratio of EVA to total shares,reflecting the value created by equity capital.Earnings per share is the ratio of net income to total equity,reflecting the level of common stock earnings.By comparing them,the difference between the creation of shareholder value is analyzed (Table 14 and Fig.3).
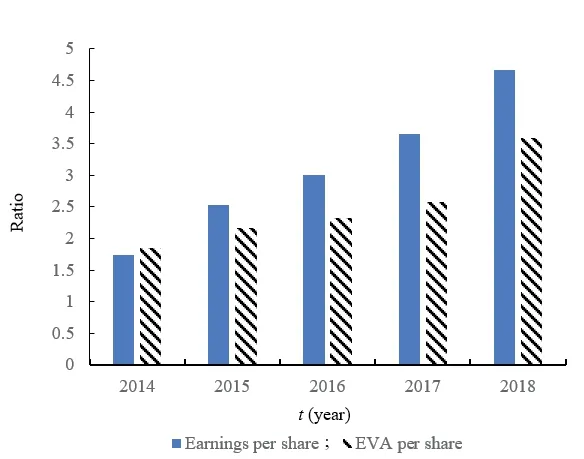
Fig.3 Earnings per share and the EVA per share of pharmaceutical company A from 2014 to 2018
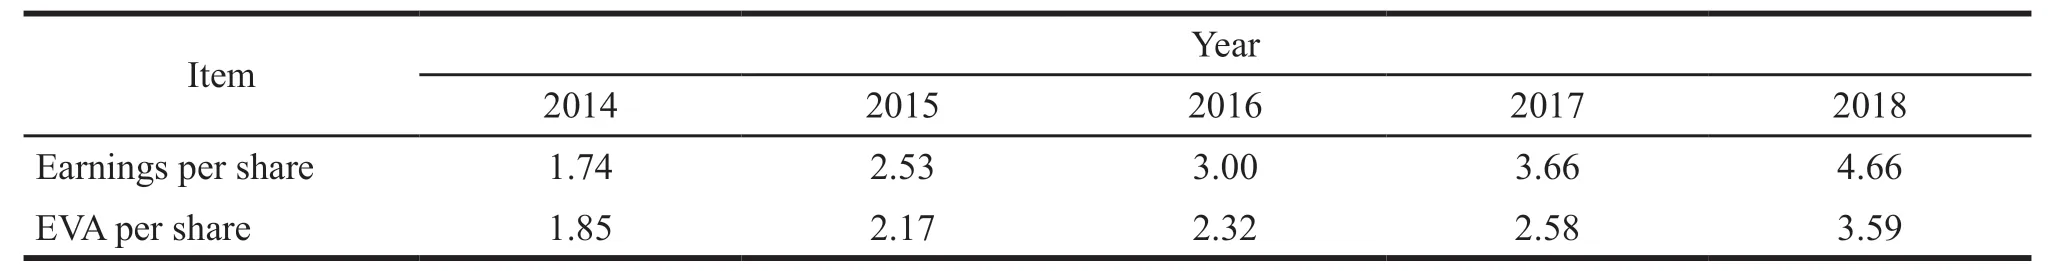
Table 14 Earnings per share and the EVA per share of pharmaceutical company A from 2014 to 2018
As can be seen from Table 14 and Fig.3,the earnings per share and EVA per share of pharmaceutical company A are growing,of which the EVA per share in 2014 is less than earnings per share.A careful analysis of the company’s financial statements shows that it is due to the large number of interest-free current liabilities in the accounting period.The value of earnings per share from 2015 to 2018 is greater than the EVA per share,of which earnings per share in 2017 are 1.41 times as much as the EVA.If the earnings per share are used as the evaluation index of the company’s operating performance,the results may differentiate.Therefore,the EVA performance evaluation system is more suitable for pharmaceutical company A.
4 Conclusions
According to the analysis of performance evaluation of pharmaceutical company A,it is found that the traditional accounting indicators do not take into account the cost of equity capital,it is difficult to reflect the company’s real performance.But EVA can truly reflect the performance of pharmaceutical company A.In addition,the traditional accounting indicators may also lead to artificial manipulation of net profit,which makes the company hard to evaluate its real business situation.EVA performance evaluation index can adjust net operating profit after tax and total investment capital accordingly,and takes the cost of equity capital of the company into account too,which can reflect the real performance of the company and is beneficial to its long-term development.
According to the analysis of EVA performance evaluation system on pharmaceutical company A,it is found that the EVA of the company is increasing,indicating the operation of the company is in good condition.However,the increase rate of EVA has changed from high to low in recent years,which means that the growth rate of the company’s operating performance is not stable.Therefore,pharmaceutical company A is required to further improve its operation and management ability.Firstly,pharmaceutical company A should actively introduce high-level talents to strengthen its team building.Second,it should learn advanced science and technology and valuable experience at home and abroad to change the company’s management model.Finally,it should vigorously develop new drug research and development projects so as to maintain the stable growth of its performance.
杂志排行
亚洲社会药学杂志的其它文章
- Problems in China’s Licensed Pharmacists System and Suggestions for Improvement
- Investigation and Analysis of the Current Situation of Online Drug Sellers
- EU Real-World Evidence Supporting Drug Regulatory Decision and Its Enlightenment to China
- The Practice of Pharmacist-Driven Antimicrobial Stewardship Based on Value-Based Healthcare
- Current Situation and Development Strategy of Residents’Cognition and Use of TCM in Liaoning Province
- Research on the Status Quo and Countermeasures of Patent Application in Liaoning Biopharmaceutical Industry Based on Patent Map