Dynamic Evolution of NDVI in Qinling Mountains from 2000 to 2019
2021-07-01LiangyanYANGLeiSHI
Liangyan YANG, Lei SHI
Shaanxi Provincial Land Engineering Construction Group Co., Ltd, Xi’an 710075, China; Institute of Land Engineering and Technology, Shaanxi Provincial Land Engineering Construction Group Co., Ltd., Xi’an 710021, China; Key Laboratory of Degraded and Unused Land Consolidation Engineering, Ministry of Natural Resources, Xi’an 710021, China; Shaanxi Provincial Land Consolidation Engineering Technology Research Center, Xi’an 710075, China
Abstract [Objectives] To investigate the dynamic evolution of vegetation index in Qinling Mountains from 2000 to 2019. [Methods] Based on MODIS13 NDVI data, the regularity of dynamics of vegetation index in Qinling Mountains from 2000 to 2019 was analyzed using maximum value composite method and trend analysis method. [Results] The NDVI in Qinling Mountains was in the range of 0.799-0.863 during 2000-2019. It showed a slow upward trend overall, and the growth rate was 0.033/(10 a). The area with declined NDVI accounted for 4.111% of the study area. It was distributed in the surrounding areas of cities, and was manly affected by the process of urbanization. The improved area accounted for 36.224% of the study area. It was widely distributed in Qinling Mountains, and was mainly affected by natural factors and national policies. [Conclusions] This study provides a basis for the protection of ecological environment and the sustainable development and utilization of resources in Qinling Mountains.
Key words Qinling Mountains, Vegetation index, Maximum value composite, Trend analysis
1 Introduction
Under the influence of global climate change and human activities, significant changes have taken place in terrestrial ecosystems. As a part of terrestrial ecosystem, vegetation is an important medium of global material and energy cycle, and also an indicator of global ecological environment change, and its dynamic change is affected by both natural and social factors. Regional vegetation change has become a hot issue at home and abroad. Normalized difference vegetation index (NDVI) is the ratio of the reflectance difference to the reflectance sum in the near infrared band and the red band of remote sensing image. It can comprehensively reflect the growth of regional vegetation, and is widely used in the study of global vegetation change.
The special geographical location and climate environment of Qinliang Mountains, as an important boundary between the north and the south of China, have made them a transition zone of physical geography and a sensitive area of climate change in China. At the same time, Qinling Mountains are also an important water conservation area for the middle route of South-to-North Water Diversion Project, with good ecosystem water conservation function. Therefore, the importance of protecting the ecological environment of Qinling Mountains is self-evident. In recent years, with the rapid development of global climate change and urbanization, the ecological environment of Qinling Mountains has been damaged to varying degrees, and the woodland and grassland are constantly replaced by construction land and cultivated land. The reduction of woodland and grassland area will seriously affect the sustainable development of ecological environment in the region, and it may reduce the water conservation capacity and net primary productivity and cause a series of environmental problems such as soil erosion and river pollution. Therefore, in order to realize the protection of the ecosystem and the development strategy of "lucid waters and lush mountains are invaluable assets", in this study, taking Qinling Mountains in the narrow sense as study area, based on MODIS image data, the dynamics of vegetation index in Qinling Mountains during 2000-2019 were investigated using the maximum value composite method and trend analysis method, thereby providing the basis for the protection of ecological environment and the sustainable development and utilization of resources in the region.
2 Data sources and methods
2.1 Data sources and preprocessing
MOD13A1 data was from NASA (https://ladsweb.modaps.eosdis.nasa.gov/search/). It was a class-III product corrected on the basis of MODIS 1b data, including the global normalized difference vegetation index (NDVI) and enhanced vegetation index (EVI), with a period of 16 d and a spatial resolution of 500 m. Each region had 23 images every year, of which 001 represents the composite value of NDVI from day 1 to day 16. The MOD13A1 data selected in this study include the data of normalized difference vegetation index (NDVI) from January to December of 2000-2019 (the data in January, 2000 is missing), and the column number is h27v05. After format transformation, projection transformation and maximum value composite, the spatial distribution of NDVI in Qinling Mountains from 2000 to 2019 was obtained.2.2 Methods
Trend analysis is to analyze the change trend of indicators in different time periods, so as to find a kind of analysis method for problems. Trend analysis method can be used to simulate the change trend of vegetation index at pixel scale, so as to obtain the spatiotemporal variation law of vegetation index in the study period. The expression is as follows: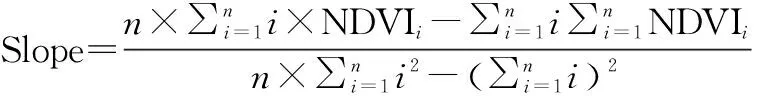
n
is the duration of the study (the research period of this study was 20 years, so the value ofn
is 20); and NDVIis the vegetation index of yeari
(i
=1 for 2000). When Slope>0, it indicates that the vegetation index tends to rise, and when Slope<0, it indicates that the vegetation index tends to decline.3 Results and analysis
3.1 Temporal dynamics of vegetation index
The annual NDVI of the Qinling Mountains from 2000 to 2019 was obtained by using the maximum value composite method. The average NDVI of each year was calculated by ENVI5.3. The change trend of NDVI in Qinling Mountains was obtained by univariate linear regression. The proportion of different NDVI intervals in each year was calculated. As shown in Table 1, the NDVI of Qinling region from 2000 to 2019 ranged from 0.799 to 0.863, showing a slow upward trend, with a growth rate of 0.033/(10 a). In 2004-2009, the change was not significant and the volatility was large; since 2009, the value had been rising steadily; and in 2014, the value reached the bottom. It shows that in Qinling Mountains, the proportion of vegetation index between 0.6 and 0.8 was decreasing; the proportion of vegetation index of 0.8-1.0 showed an upward trend; and the proportions of other intervals were relatively stable.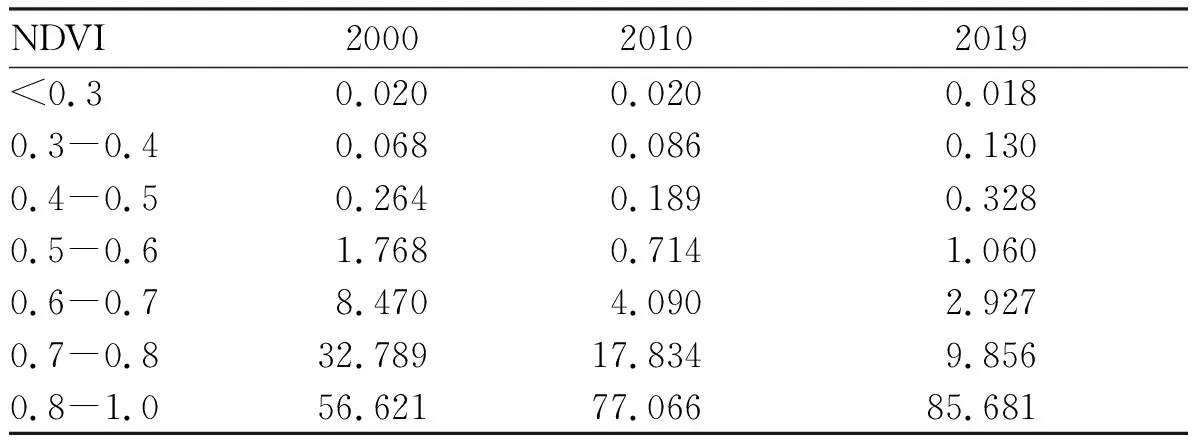
Table 1 Proportion of different NDVI interval of Qinling Mountains in 2000, 2010 and 2019
3.2 Spatial dynamics
The spatial change trend and proportion of NDVI in Qinling Mountains at pixel scale from 2000 to 2019 were obtained by trend analysis (Table 2). From 2000 to 2019, the area with vegetation index declined accounted for 4.111% of the study area. It was distributed in the surrounding areas of cities, and was mainly affected by the process of urbanization. The improved area accounted for 36.224% of the study area. It was widely distributed in the study area, and was mainly affected by natural factors and national policies.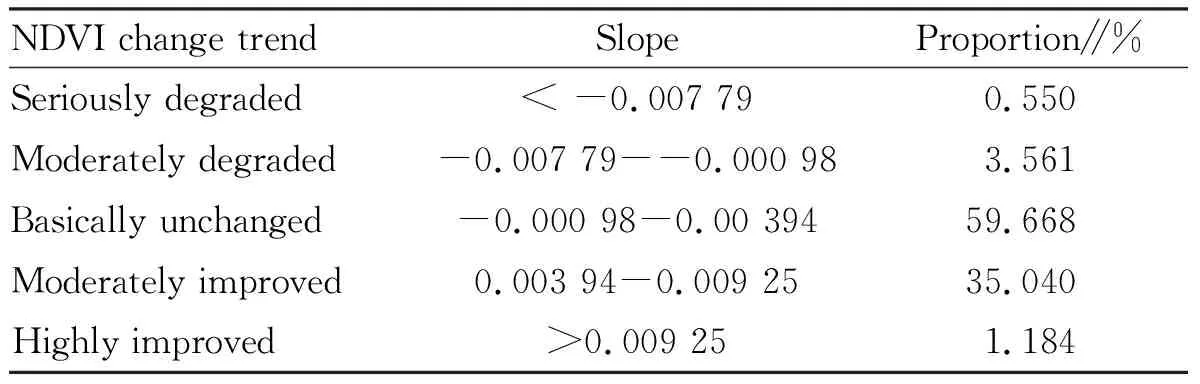
Table 2 Change trend of NDVI of Qinling Mountains in 2000-2019
4 Conclusions
Based on MODIS13 NDVI data, the dynamics of vegetation index in Qinling Mountains from 2000 to 2019 were analyzed using maximum value composite method and trend analysis method. The results show that in 2000-2019, the NDVI in Qinling Mountains was in the range of 0.799-0.863, and it showed a slow upward trend overall, with a growth rate of 0.033/(10 a). The area with vegetation index declining accounted for 4.111% of the study area, distributed in the surrounding areas of cities, and mainly affected by the process of urbanization. The improved area accounted for 36.224% of the study area, and was widely distributed in the study area.
杂志排行
Asian Agricultural Research的其它文章
- Comprehensive Construction of Innovative Talent Cultivating Model in Colleges and Universities
- Application of Big Data in the Remediation of Contaminated Sites
- Advances in Research on Effect of Heavy Metals Cd and Pb on Wheat and Mitigation Effect of Conditioners
- Breeding of Jingdan 15, a New Stress-resistant and High-yield Maize Cultivar
- Endogenous Governance: Governance Way and Realization Path for Construction of Chinese Characteristic Town
- Effect of Sodium Selenite-Chitosan Compound Preservative on Storability of Kumquats