Gas sensor using gold doped copper oxide nanostructured thin films as modified cladding fiber
2021-06-26HusseinSalloomRushdiJasimNadirFadhilHabubiSamiSalmanChiadJadanandJihadAddasi
Hussein T.Salloom Rushdi I.Jasim Nadir Fadhil Habubi Sami Salman Chiad M Jadan and Jihad S.Addasi
1Al-Nahrain Nanorenewable Energy Research Centre,Al-Nahrain University,Baghdad,Iraq
2Department of Physics,College of Education,Mustansiriyah University,Baghdad,Iraq
3Department of Physics,College of Science,Imam Abdulrahman Bin Faisal University,Dammam 31441,Saudi Arabia
4Basic and Applied Scientific Research Center,Imam Abdulrahman Bin Faisal University,Dammam 31441,Saudi Arabia
5Department of Applied Physics,College of Science,Tafila Technical University,Tafila 66110,Jordan
Keywords: nanostructured thin films,gold-doped copper oxide,gas sensors,optical properties
1. Introduction
Nowadays,fiber-optic gas sensors are the most important type of sensors thanks to their distinctive properties,including low cost,small size,remote sensing,immunity to electromagnetic,and capability of working in various environments.[1–4]Current fiber-optic systems for gas sensing have exploited many different detection manners[5]such as transmission,absorption, reflectance, evanescent wave surface plasmon resonance (SPR), and lossy mode resonance. Regarding the type of fiber, no-core optical fiber (NCF),[6]a side polishing Dshape optical fiber,[7]tapered small core single mode fiber(TSCSMF) and a microfiber coupler (MFC),[8]and another characteristic related to optical fiber sensing is that utilizing a modified clad region with nanocrystalline metal oxide to create a hybrid structure. In this sense, Renganathanet al. have widely exploited such structures for gas sensing with various metal oxides such as zinc oxide ZnO,[9]NiO,[10]CeO2,[11]and V2O5, WO3.[12]In a real case, light propagating inside the fiber could escape from the core towards the modified clad region. Variations in the output light power are correlated not only to the refractions among the modified clad region but also to the presence of the surrounding medium.
On the other hand, CuO has been proved a prominent catalytic material for gas sensing in terms of better response,improved stability,and longer lifetime.[13]Also doping metal oxides with noble metals(i.e.,Au,Ag,Pt,and Pd)[14–16]may find potential applications in gas sensor that acts as sensitizers or promoters having diverse optical properties. In clad modified fiber optic,the gas-sensing mechanism relies on evanescent wave leakage, in which the creation of the sensing layer requires the removal of cladding and replacement by a thin layer of nanocrystalline metal oxides. Consequently,some of the light launched to the fiber’s core will leak into the surrounding. The refractive index of the cladding material varies due to chemical reactions if such a device has been exposed to gases and produces an optical loss by evanescent.
Hence, in the present work, we investigate the influence of pure and Au-doped CuO deposited on fiber surface on gassensing capabilities. The effect of Au doping on various samples of CuO thin films on the structural, morphological, and optical properties have been studied and discussed. The light intensity of a clad modified polymer optical fiber coated with pure and gold doped cupric oxides is examined at room temperature with different ammonia concentrations. The optical response of the presented sensor when exposed to gas is discussed in terms of the modified clad interface.
2. Experimental details
2.1. Deposition of Au:CuO samples
Thin films of CuO were prepared by the chemical spray pyrolysis method. These films were deposited on a highly cleaned glass slide using 0.1 M of copper chloride(CuCl2·2H2O) dissolved in 100 mL deionized water. 0.1 M of gold chloride was dissolved in redistilled water added to the matrix solution to obtain 1%and 3%Au doped CuO.The substrate temperature was kept at 350◦C during the deposition process and nitrogen was used as a carrier gas. The spray parameters were optimized to obtain clear and homogenous samples: nozzle distance was 27 cm,spraying time was 10 s,spray rate was 5 mL/min,and spray time interval was 2 min.
2.2. Devices and measurements
To determine film structure, XRD(Model: SHIMADZU XRD-6000) was used, while AFM (Model: AA3000 SPM)was used to determine the morphology of the films. Characteristics spectra of transmittance and the absorbance were measured via UV–visible spectrophotometer(Model: Double beam SPUV 26)in the wavelength range(300–900 nm).
2.3. Sensor setup
The proposed ammonia gas sensor structure is presented in Fig. 1. A multi-mode plastic optical fiber of 40 cm length and 750 mm diameter was used. 3 cm of cladding region was etched in the center to work as sensor head. The cladding section was chemically etched by acetone,followed by polishing with a 1000 grid sheet.Then,the polished surface was cleaned and coated with pure and Au doped (2 at% and 4 at%) CuO thin film. A halogen lamp (Model-SLS201/M) is coupled at the first end of the fiber. At the other end of the fiber, a fiber optic spectrometer(Model:Thorlabs CCS200)was used to exhibit the intensity spectrum. The sensor head was inserted into the lab-built gas chamber,which is the bottom flask filled with a gas of interest.
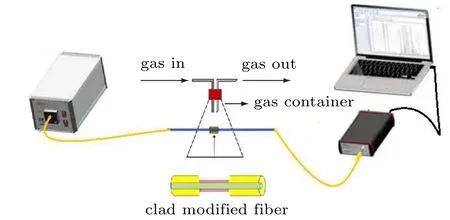
Fig.1. Modified clad-fiber optic gas sensing setup.
The sensitivity of the proposed gas sensor is calculated using the following relation

whereIaandIgare the intensity in the reference(without gas)and measured signals in the presence of a gas.
3. Results and discussion
3.1. Structural analysis
Two characteristics diffraction peaks with high intensity are observed at values of 32.6◦and 37.1◦with a preferred orientation along the (11) and (111) axes, which are indicated as cubic structured CuO.The other two less intense peaks are found at 55.4◦and 65.9◦. The sharp diffraction peaks indicate that wellcrystallized CuO nanostructures films can be obtained. With the increase of Au content,there is a slight shift in the position 2θtowards the lower from 37.1◦for the undoped film to 36.7◦for 4% Au:CuO films and this could be assigned to the replacement of Cu+2ions of(0.73 ˚A)by Au+2ions of larger radius(1.73 ˚A).It can be assumed that Au atoms were effectively substituted by Cu sites within CuO lattice without altering the crystal structure of copper oxide or generating new phases. Considering the most intense peak(11)mean size of crystal(D)was calculated by utilizing Scherrer’s equation[17–19]

whereλis the wavelength of the x-rays used(1.5406 ˚A),βandθare full width at half maximum(FWHM)and the diffraction angle,respectively.The crystalline size has been found to vary from 90 nm to 75 nm with Au concentration,as represented in Table 1. The reduction of the grain size facilitates the increase of nucleation center density in the doping films leading to the formation of small crystallites. It is found that the values of strain decrease from 2.88 to 1.77 when increasing the Au content. On the other hand,the dislocation densityδincreases as the concentrations of Au-doped CuO increase. Generally,Au doped CuO thin film exhibits better crystalline quality with less strain as compared to pure CuO films.
Other structural parameters such as dislocation density(δ) are also evaluated.δgives the number of defects in the films, the values ofδin Table 1, which shows the structural parameters estimated from[20–22]

The strain (ε) gives information about the material structure and obtained by employing the following equation:[23–25]


Table 1. Grain size, optical band gap and structural parameters of the prepared films.
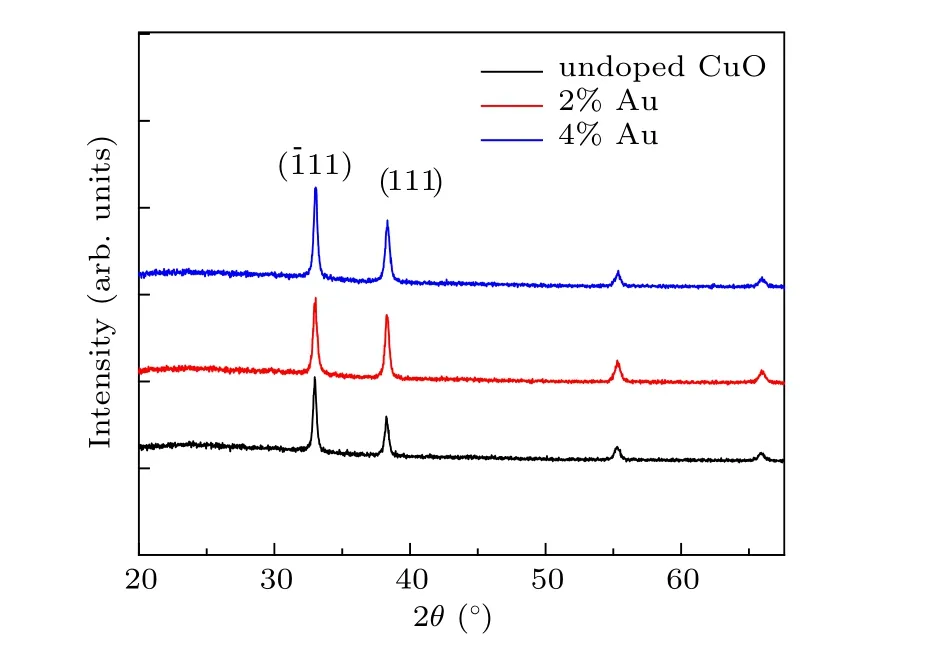
Fig.2. XRD-patterns(a)crystalline size(b)dislocation(c)strain(d)of the prepared films.
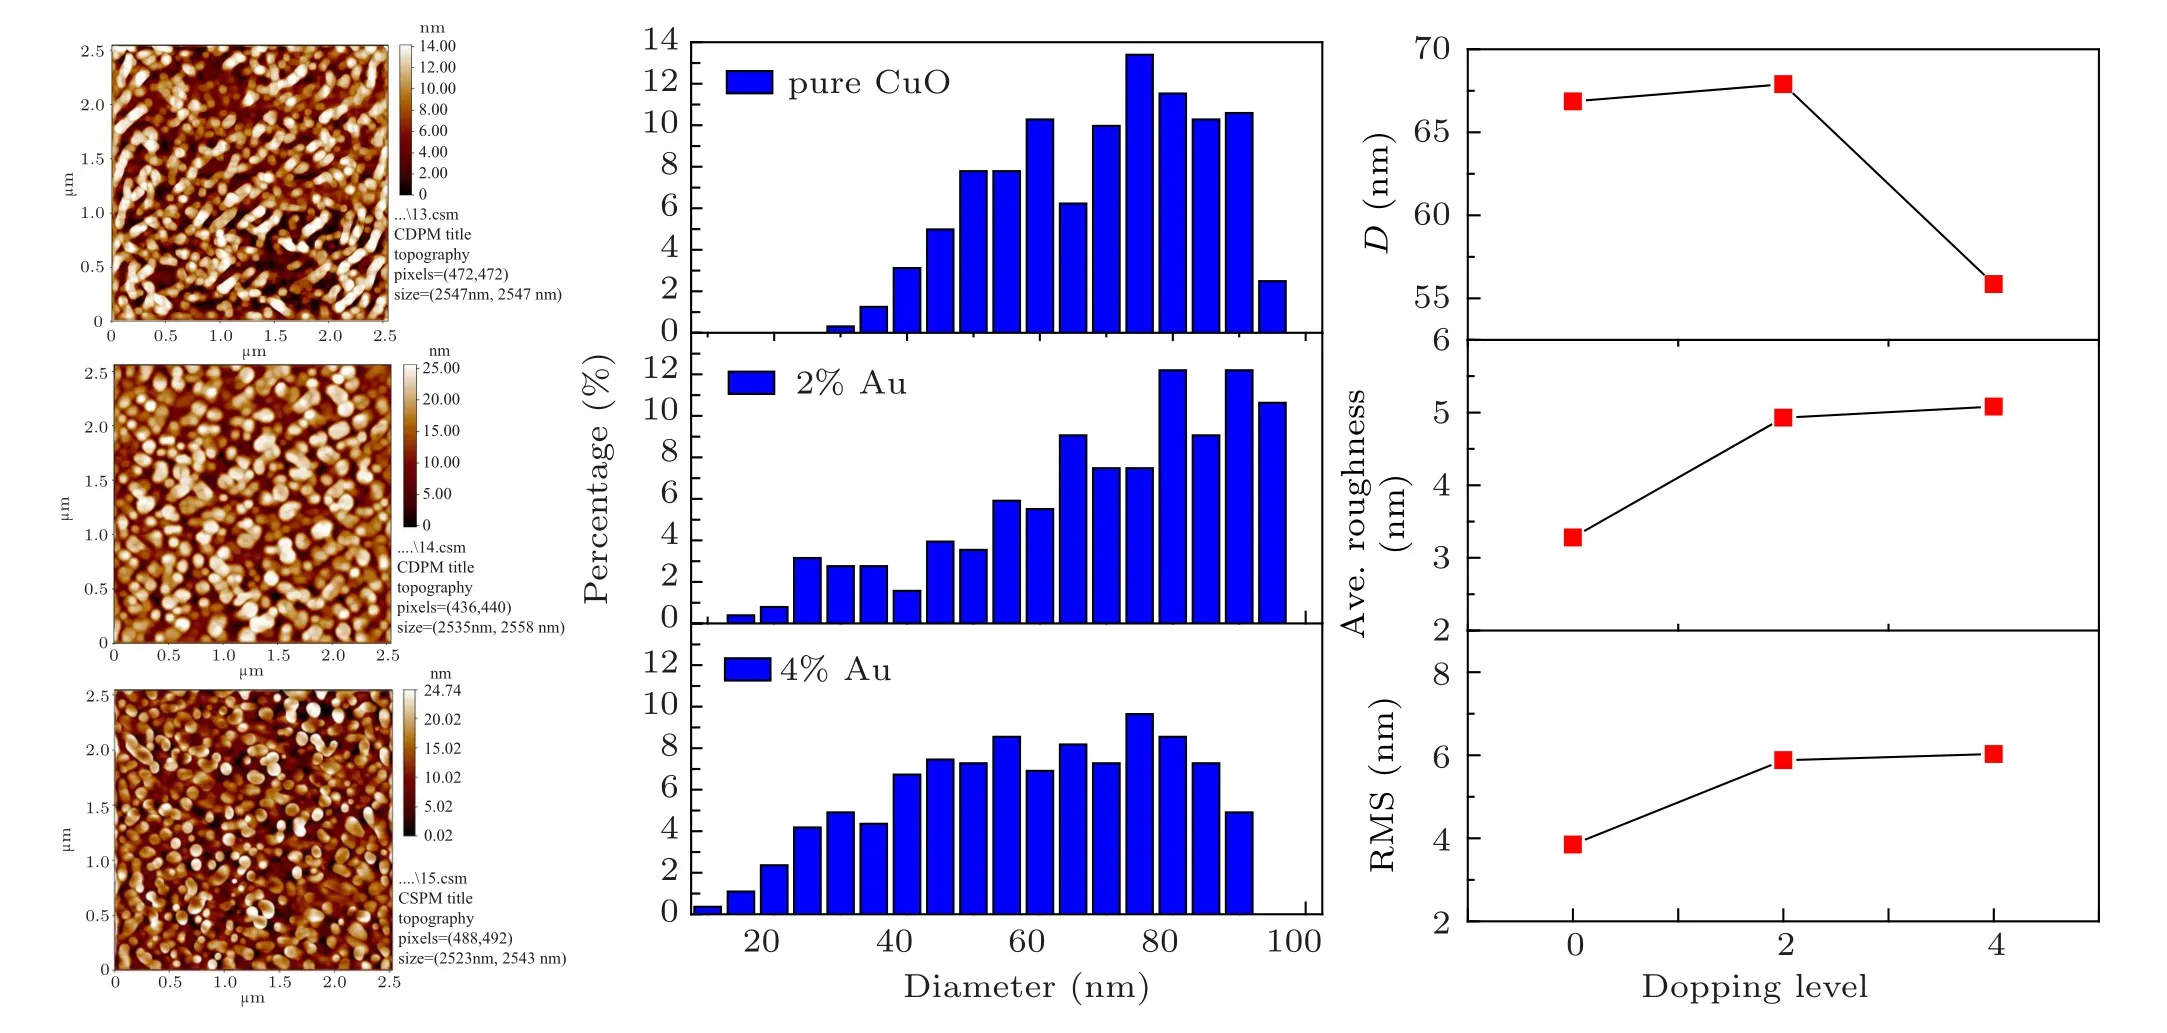
Fig.3. The 2D AFM images,AFM parameters and granularly distribution of the pure and Au doped CuO films.
Atomic force microscope (AFM) micrographs and their roughness analysis of prepared Au:CuO films are shown in Fig.3.The 2D images and distribution of grains exhibit spherical nano-grainshaving an average diameter of 66.08 nm for pure CuO, 67.90 nm for 2% Au doped CuO and 55.86 nm for 4%Au doped CuO.The surface roughness is 3.28 nm for pure CuO, 4.93 nm for 2% Au doped CuO, and 5.08 nm for 4%Au doped Cu. The decrease in average surface roughness could be attributed to the reduced grain size. The reduction values agree with crystallite size variation established from XRD data. The same trend in roughness values NiO:Co was reported by Tas¸k¨opr¨uet al.,[26]and the influence of Au doping on AFM parameters is shown in Fig.3 and summarized in Table 2.

Table 2. AFM parameters of the deposited films.
3.2. Optical analysis
Figures 4 and 5 show the optical transmittance and absorbance measurements of prepared films recorded in the spectral region 300–900 nm. All films are transparent in that region.The undoped CuO films exhibit an average optical transparency of 65% in the visible range and decrease to 45% for the 2% Au-doped thin films and 40% for the 4% doped thin films. The lower optical transmittance for CA1 and CA2 may be due to the increase of absorbing centers with the incorporation of Au leading to an increase in the absorption capability.Moreover,the decrease of transmittance can also be associated with the scattering of incident photons by the addition of gold at different sites in the CuO matrix. However, CuO: Au thin films are found to be highly transparent in the NIR region,and the maximum transmittance is about 80%for 4%Au concentration. These results are in accord with films deposited using other coating techniques.[27]The absorption edge is shifted to higher wavelengths according to the increase in gold content,as shown in Fig.4,due to the presence of inter-band transitions at localized states in the energy gap.
Optical energy gap analysis was performed according to Tauc’s relation given by[28–30]

whereαis the absorption coefficient,βis constant and is photon energy.Egis given from thex-axis intersection of(αhν)2versushνplots shown in Fig.6 and found to decrease with Au dopants. Similar to the trend described for Au doped ZnO by Dilonardoet al.[31]
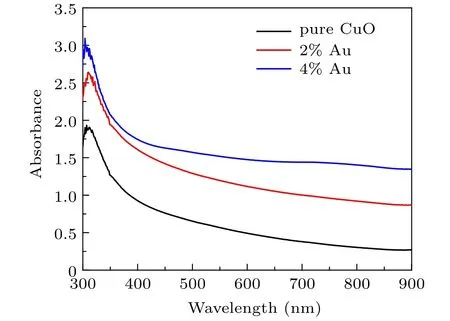
Fig.4. Absorbance versus wavelength for the grown films.
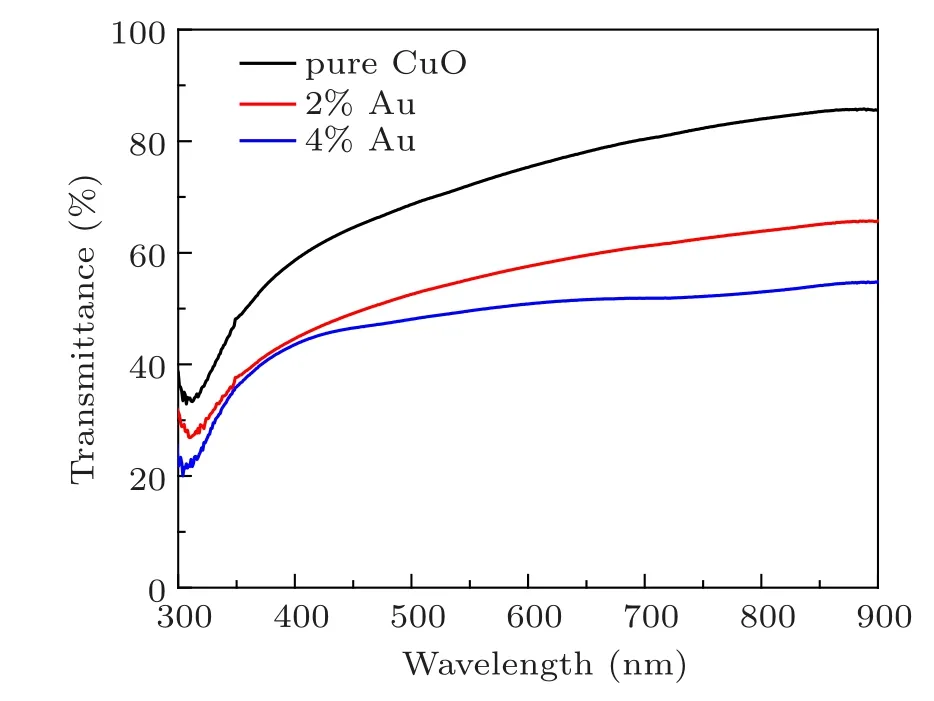
Fig.5. Transmittance for the prepared films.
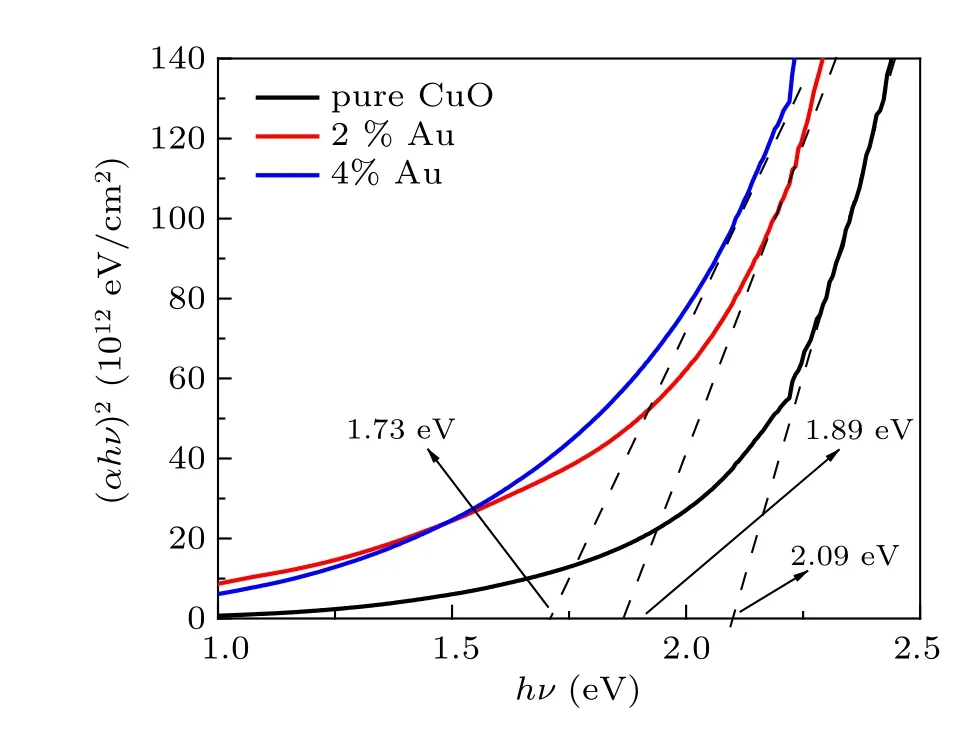
Fig.6. The(αhν)2 vs. hν of the prepared thin films.
3.3. Sensing properties and analysis
Figure 7 shows a plot of the spectral intensity of the proposed sensor with special emphasis on the spectral region of(560–600) nm and various gas concentrations from 0 ppm to 500 ppm. The optical response of the sensor is described as a change in the peak intensity with respect to the change in the gas concentration. After rigorous observation, the results demonstrate an increase in the light intensity output with an increase in gas concentration, and the proposed sensor showed a good response compared to its counterparts made of optical fibers. This could be attributed to the increase of refractive index of modified cladding region when ammonia gas interacts with CuO film, so the transmitted light through the fiber is confined by the modified cladding and there is an increase in the output. Furthermore,the output intensity increases with Au-doping,which indicates that the percentage of light reflectivity may be enhanced depending upon the value of the refractive index of the modified cladding with Au doped CuO.As it is obvious from this figure,the output intensity shows a slight increase with the increase of gas ammonia concentrations due to the decrease in evanescent wave absorption and increase of light confinement. In general,there is light intensity modulation rather than light conversion.
Figure 8 presents the gas sensor sensitivity plot of pure and Au doped CuO films in different gas concentrations ranging from 0 ppm to 500 ppm at room temperature. It can be seen that Au doped CuO(2%and 4%)shows enhanced sensitivity,where Au doped CuO(4%)exhibits a maximum sensitivity of 17%compared with that of other pure and Au doped CuO(2%). According to the data plotted in Fig.8,the sensor response increases properly with Au doping. As the refractive index of the modified cladding(nmclad)is about 2.6,[32]which is higher than the core (1.492), the presented sensor satisfies the leaky mode criteria. Moreover, the features of the sensor could be correlated to the variation of light reflectivity at the core-modified clad surface.
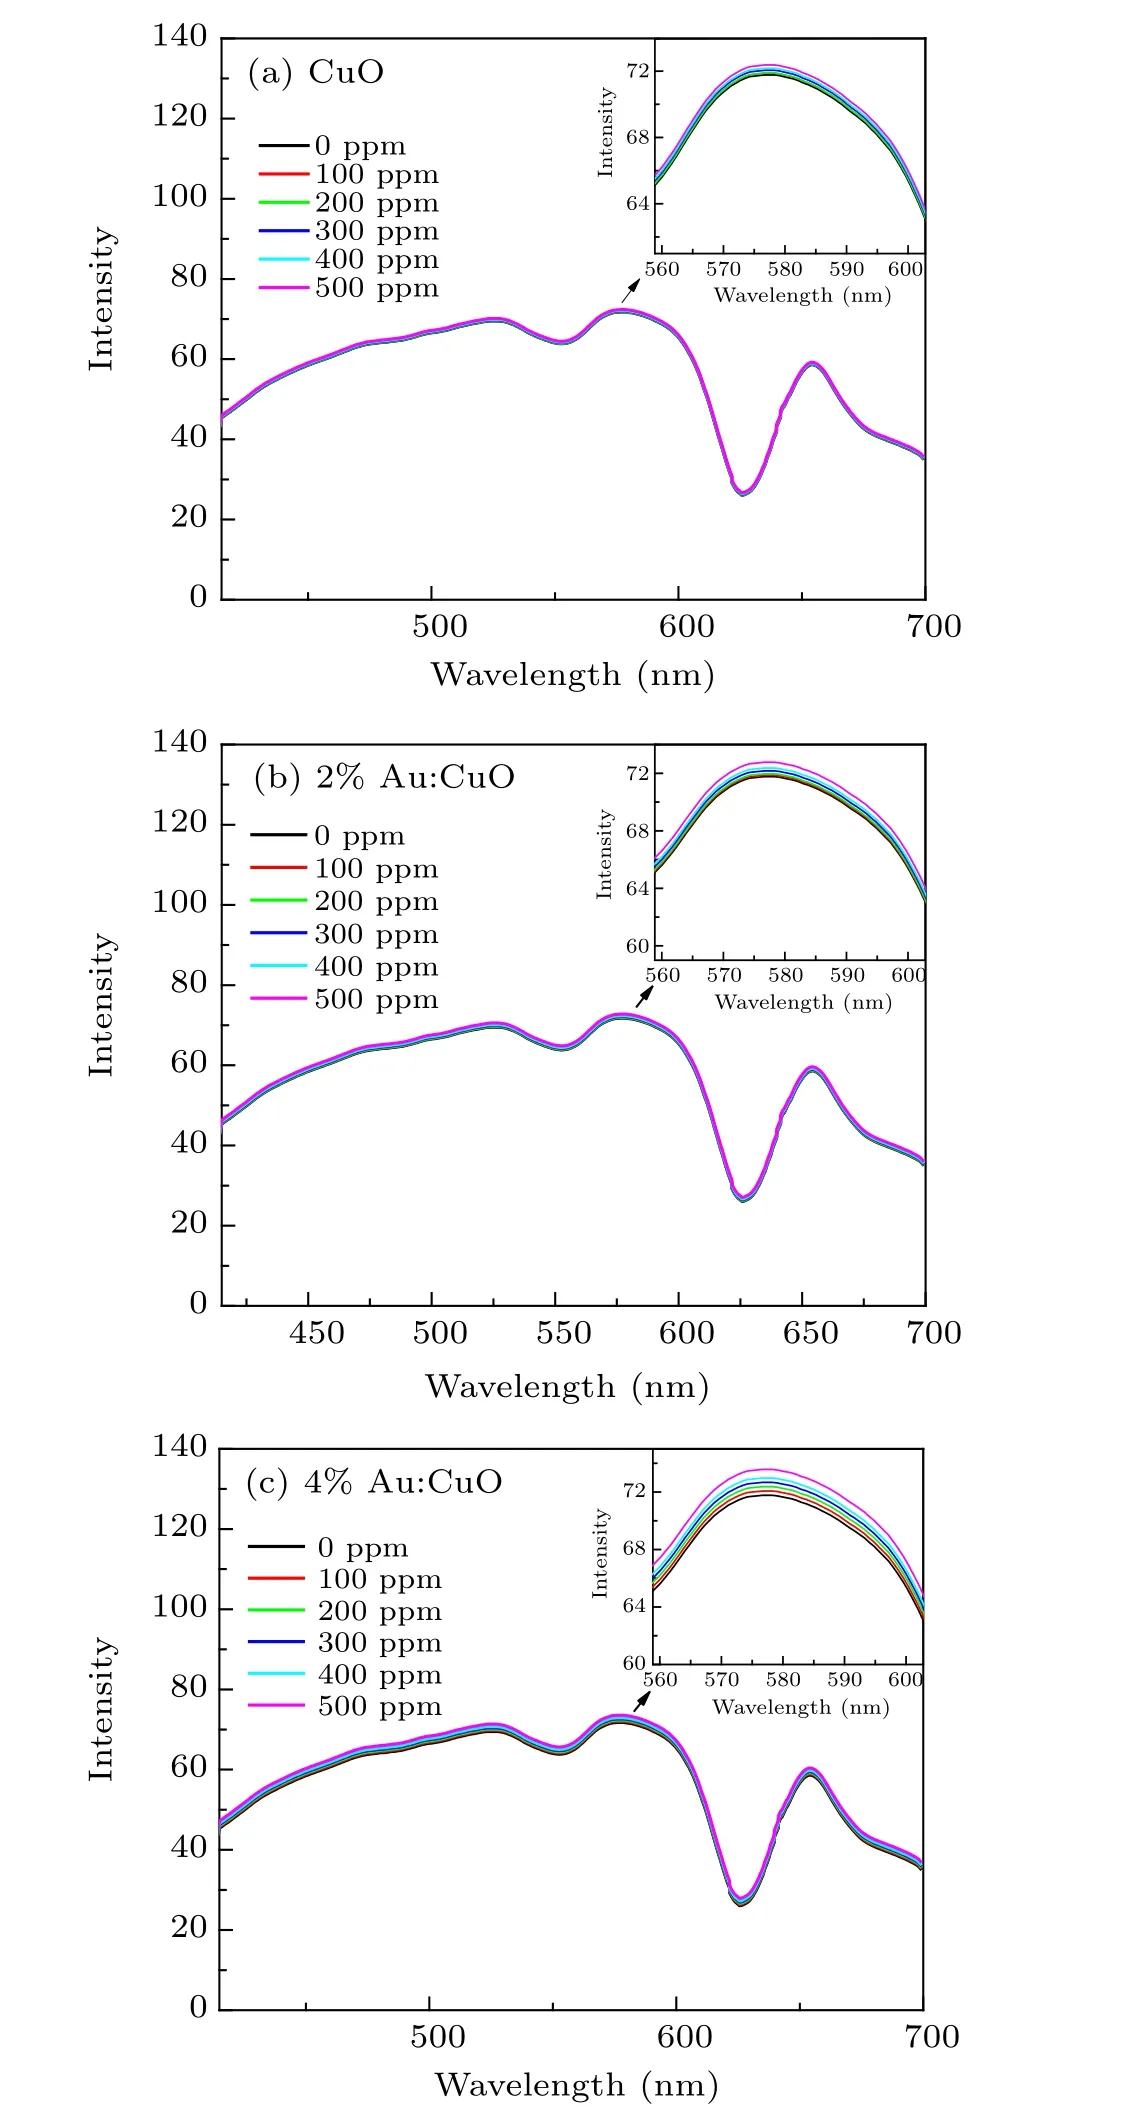
Fig. 7. The response of the presented sensor with different gas concentrations ranging from 0 to 500 ppm(a)CuO,(b)2%Au:CuO,(c)4%Au:CuO.
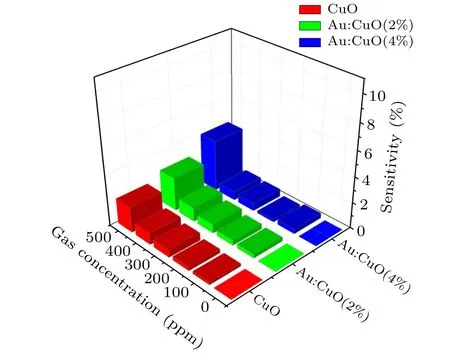
Fig.8. Variation of sensitivity versus gas concentration ranging from 0 ppm to 500 ppm.
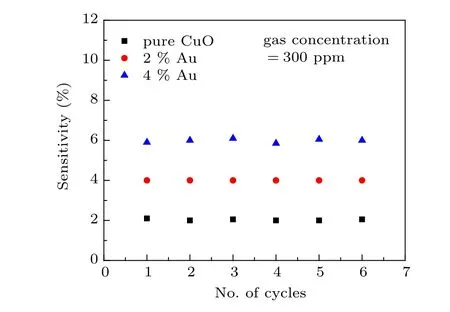
Fig. 9. Reproducibility plot (sensitivity versus No. of cycles) of pristine CuO and Au doped CuO films towards ammonia gas.
Reproducibility and stability are the most critical factors for choosing a sensor. Hence,these have been examined in the experiments by the injection and removal of the gas with realtime measurement of the optical response in repeated cycles.The sensor was checked by allowing the ammonia gas concentration of 300 ppm to remain in the gas chamber for 3 min and recording the optical signal. The gas was evacuated from the chamber by the end of the 3 min and the signal was recorded;the results are shown in Fig.9.Over six cycles,the response is almost constant except for a slight sensitivity fluctuation,indicating respectable reproducibility for the fabricated sensor.
4. Conclusion
Undoped,2%and%Au doped CuO nanostructured thin films were produced by spray method.XRD analysis and SEM images displayed that undoped CuO formed clear nanostructured films. XRD analysis reveals that no secondary phase is formed. The prepared films are deposited on surface fiber and act as a gas sensor for detecting ammonia as the output response increases with the gas concentration. Furthermore,the sensitivity increases when CuO is doped with gold. The reproducibility of the proposed sensor is studied over six cycles with an ammonia gas concentration of 300 ppm.
Acknowledgment
The authors gratefully appreciate the support from Al-Nahrain University and Mustansiriyah University.
杂志排行
Chinese Physics B的其它文章
- Quantum computation and simulation with vibrational modes of trapped ions
- ℋ∞state estimation for Markov jump neural networks with transition probabilities subject to the persistent dwell-time switching rule∗
- Effect of symmetrical frequency chirp on pair production∗
- Entanglement properties of GHZ and W superposition state and its decayed states∗
- Lie transformation on shortcut to adiabaticity in parametric driving quantum systems∗
- Controlled quantum teleportation of an unknown single-qutrit state in noisy channels with memory∗
