Impacts of Aerosol−Radiation Interactions on the Wintertime Particulate Pollution under Different Synoptic Patterns in the Guanzhong Basin, China
2021-06-22NaifangBEIXiaLIQiyuanWANGSuixinLIUJiaruiWUJiayiLIANGLangLIURuonanWANGandGuohuiLI
Naifang BEI, Xia LI, Qiyuan WANG, Suixin LIU, Jiarui WU, Jiayi LIANG, Lang LIU,Ruonan WANG, and Guohui LI*,3
1School of Human Settlements and Civil Engineering, Xi’an Jiaotong University, Xi’an 710049, China
2Key Laboratory of Aerosol Chemistry and Physics, State Key Laboratory of Loess and Quaternary Geology,Institute of Earth Environment, Chinese Academy of Sciences, Xi’an 710061, China
3Center for Excellence in Quaternary Science and Global Change, Chinese Academy of Sciences, Xi’an 710061, China
ABSTRACT The effects of aerosol–radiation interactions (ARI) are not only important for regional and global climate, but they can also drive particulate matter (PM) pollution. In this study, the ARI contribution to the near-surface fine PM (PM2.5)concentrations in the Guanzhong Basin (GZB) is evaluated under four unfavorable synoptic patterns, including “northlow”, “transition”, “southeast-trough”, and “inland-high”, based on WRF-Chem model simulations of a persistent heavy PM pollution episode in January 2019. Simulations show that ARI consistently decreases both solar radiation reaching down to the surface (SWDOWN) and surface temperature (TSFC), which then reduces wind speed, induces sinking motion,and influences cloud formation in the GZB. However, large differences under the four synoptic patterns still exist. The average reductions of SWDOWN and daytime TSFC in the GZB range from 15.2% and 1.04°C in the case of the“transition” pattern to 26.7% and 1.69°C in the case of the “north-low” pattern, respectively. Furthermore, ARI suppresses the development of the planetary boundary layer (PBL), with the decrease of PBL height (PBLH) varying from 18.7% in the case of the “transition” pattern to 32.0% in the case of the “north-low” pattern. The increase of daytime near-surface PM2.5 in the GZB due to ARI is 12.0%, 8.1%, 9.5%, and 9.7% under the four synoptic patterns, respectively. Ensemble analyses also reveal that when near-surface PM2.5 concentrations are low, ARI tends to lower PM2.5 concentrations with decreased PBLH, which is caused by enhanced divergence or a transition from divergence to convergence in an area. ARI contributes 15%–25% toward the near-surface PM2.5 concentrations during the severe PM pollution period under the four synoptic patterns.
Key words: aerosol–radiation interactions, wintertime particulate pollution, synoptic patterns, Guanzhong Basin
1. Introduction
Atmospheric aerosols, or particulate matter (PM), generated either naturally or anthropogenically, not only disturb regional and global climate, but also adversely influence air quality, ecosystems, and human health (Seinfeld and Pandis, 2006). Aerosol particles directly alter the radiative balance of Earth by scattering or absorbing solar radiation to cool or heat the atmosphere and dim the surface. These effects further induce changes to the surface energy budget,thermodynamic profile, and cloudiness (semi-direct effects).Aerosol particles indirectly change cloud properties, such as cloud lifetime, reflectivity, and composition, by acting as cloud condensation nuclei (CCN) or ice nuclei (IN) (indirect effects). IPCC (2013) has used new terminology of aerosol–radiation interactions (ARI) to refer to the combination of aerosol direct and semi-direct effects and aerosol–cloud interactions (ACI) to refer to the aerosol indirect effects.
ARI is one of the largest uncertainties in the current understanding of radiative forcing, and it also plays a significant role in PM pollution during heavy haze days (Wu et al.,2019, 2020). Many studies have shown that ARI cools the near-surface but warms the air aloft, enhancing atmospheric stability, facilitating accumulation and formation of PM(PM with an aerodynamic diameter equal to or less than 2.5 μm) in the planetary boundary layer (PBL), and consequently deteriorating the air quality during PM pollution events. Field observations have indicated that dense PMstrengthens the PBL stability caused by ARI and further reduces PBL height (PBLH), subsequently increasing nearsurface PMmass concentrations ([PM]) (Petäjä et al.,2016; Ding et al., 2017; Tie et al., 2017). Yang et al. (2016)have estimated that contributions from ARI by aerosol–PBL feedback and aerosol–wind feedback to the near-surface[PM] are 15% and 12%, respectively, in south Beijing during the 2014 Asia-Pacific Economic Cooperation (APEC)summit period. Simulations using an online-coupled meteorology and chemistry model have further emphasized the importance of ARI in PM pollution formation. Numerous studies have focused on the ARI effect on PM pollution in the North China Plain (NCP), showing that the ARI effect on near-surface [PM] varies substantially with time and location, contributing up to 80% (e.g., Wang et al., 2014a, b,2015; Gao et al., 2015, 2016; Liu et al., 2018; Zhang et al.,2018; Zhong et al., 2018a, b). Simulations by Wu et al.(2019) have revealed that the near-surface [PM] contribution from ARI increases from 12% to 20% with near-surface [PM] increasing from 250 to 500 μg mduring a persistent and severe PM pollution event in the NCP.
Expanding cities and industrial growth have led to severe PM pollution in the Guanzhong Basin (GZB), China,in recent decades. The formation of severe PM pollution has been attributed to interaction between increased anthropogenic emissions and dynamic, physical, and chemical atmospheric processes (An et al., 2019) and specific local topography. Bei et al. (2016a, b) have emphasized the significant role of unfavorable synoptic patterns in PM pollution in the GZB. Huang et al. (2014) have shown that secondary aerosols, formed through atmospheric chemical processes, have high contributions to PM pollution in the GZB. Additionally, recent studies have comprehensively investigated the components, features, and sources of PMin the GZB(e.g., Cao et al., 2009, 2012; Shen et al., 2010, 2011).However, there has been uncertainty about the contribution of atmospheric physical processes, such as ARI, to PM pollution in the GZB.
In this study, sensitivity simulations by the Weather Research and Forecast model with Chemistry (WRF-Chem)are performed to assess contributions of ARI to the local meteorological conditions and air quality during wintertime heavy PM pollution episodes under various synoptic conditions in the GZB. Section 2 explains the model and methodology, Section 3 presents the results and discussion, and section 4 provides the summary and conclusions.
2. Model and Methodology
2.1. Model description and configurations
The specific version of the WRF-Chem model employed in this study was originally developed by Grell et al. (2005) and modified by Li et al. (2010, 2011a, b, 2012).A flexible gas-phase chemical module with different chemical mechanisms and the Community Multiscale Air Quality (CMAQ) aerosol module (AERO5) developed by the US EPA (Binkowski and Roselle, 2003; Foley et al., 2010) are integrated into the modified WRF-Chem model. The dry and wet deposition of aerosols is computed following Wesely (1989) and the methodology in the CMAQ, respectively. The Fast Tropospheric Ultraviolet and Visible(FTUV) Radiation Model is used to calculate photolysis rates, with considerations of both the aerosol and cloud effects (Li et al., 2005, 2011a). The inorganic aerosol species are predicted by the method in ISORROPIA Version 1.7, calculating the constitutes and phase state of a thermodynamic equilibrium in ammonium-sulfate-nitrate-water inorganic aerosols with gas precursors (Nenes et al., 1998). The non-traditional volatility basis-set (VBS) modeling approach, considering contributions from glyoxal and methylglyoxal to the secondary aerosols formation, is utilized to predict secondary organic aerosols (SOA). Detailed information of the parameterizations can be referenced in Li et al.(2010, 2011a, b). A developed aerosol radiative module has been incorporated into the WRF-Chem model to predict aerosol optical properties (Li et al., 2011a). In the improved module, aerosol particles are divided into 48 bins from 0.002 μm to 10.0 μm and then classified into four types: (1) internally mixed sulfate, nitrate, ammonium, hydrophilic organics and black carbon, and water; (2) hydrophobic organics; (3) hydrophobic black carbon; and (4) other identified aerosols. The four types of aerosols are assumed to be mixed externally.The aerosol optical properties, such as the extinction efficiency (Q), the single scattering albedo (ω
), the asymmetry factor (g), and the aerosol optical depth (AOD) are calculated based on the aforementioned assumptions. The Goddard shortwave radiation scheme (Chou and Suarez, 1999;Chou et al., 2001) is chosen in our simulation to calculate the radiation flux. The aerosol optical properties are also transferred into the Goddard shortwave radiation scheme to evaluate the ARI effect.A heavy PM pollution event that occurred in the GZB from 29 December 2018 to 29 January 2019 has been simulated using the WRF-Chem model, including four unfavorable synoptic patterns: “north-low” (8 days); “transition”(2 days); “southeast-trough” (3 days); and “inland-high”(7 days). The WRF-Chem model simulation domain is displayed in Fig. 1 and detailed model setups are listed in Table S1 in the electronic supplementary material (ESM).
2.2. Synoptic patterns
Bei et al. (2016a) have provided detailed analyses of the four unfavorable synoptic patterns associated with the occurrence of PM pollution in the GZB. Under the general conditions of the “north-low” pattern, the GZB is situated in the northern part of the low at 850 hPa, with prevalent weak easterly winds aloft. The frequently formed convergence or stagnant situations in the GZB hinder dissipation of air pollutants. It is noted that PM pollution might not be severe due to the occurrence of precipitation resulting from favorable dynamical conditions and humid air. In the case of the “transition” pattern, the basin is located in the transition zone between the high in the south and the trough in the north at 850 hPa, with westerly winds prevailing over the basin.Although the westerly wind is weak in the basin, caused by attenuation of the specific topography, it still tends to transport air pollutants to the eastern basin. When the GZB is controlled by the trough at 850 hPa in the northwest, with dominant southwesterly winds aloft, the synoptic situation is defined as “southeast-trough”. The weak southerly winds and the trough-caused convergence trap air pollutants in the GZB, facilitating accumulation of PM. In the case of the“inland-high” pattern, the inland high at 850 hPa controls the basin, and the winds are generally variable over the basin, depending on the specific location of the high. Weak winds, subsidence, and the stable pattern associated with the high cause air pollutant accumulation and further worsen PM pollution. The observed daily [PM] corresponding to the four kinds of unfavorable synoptic situations from 2008 to 2013 exceeds 200 μg m, showing heavy PM pollution(Bei et al., 2016b). However, there is still uncertainty about the contribution of ARI to PM pollution under those unfavorable synoptic patterns.
Two experiments have been designed to evaluate contributions of ARI to near-surface [PM] under the four kinds of synoptic situations in the GZB. In the control run, ARI is turned on (hereafter referred as to F_BASE), while in the sensitivity run, ARI is turned off (hereafter referred as to F_ARI0).
2.3. Data and statistical methods for comparisons
The WRF-Chem model performance in simulating PM, O, NO, SO, and CO is validated using the hourly observations provided by the Ministry of Ecology and Environment (MEP) of China. In addition, the predicted sulfate,nitrate, and ammonium aerosols are compared with measurements by the Aerodyne Aerosol Chemical Speciation Monitor (ACSM) deployed in Baoji and by the Gas and Aerosol Compositions Monitor (IGAC) deployed in Xianyang(Fig. 1).
The mean bias (MB), root mean square error (RMSE),and the index of agreement (IOA) are applied as indicators to assess the WRF-Chem model performance. For the calculation formulae and descriptions of indicators please reference Li et al. (2010, 2011a, b, 2012). Detailed model validations are presented in the SI Appendix (Figs. S1−S4 in the ESM).
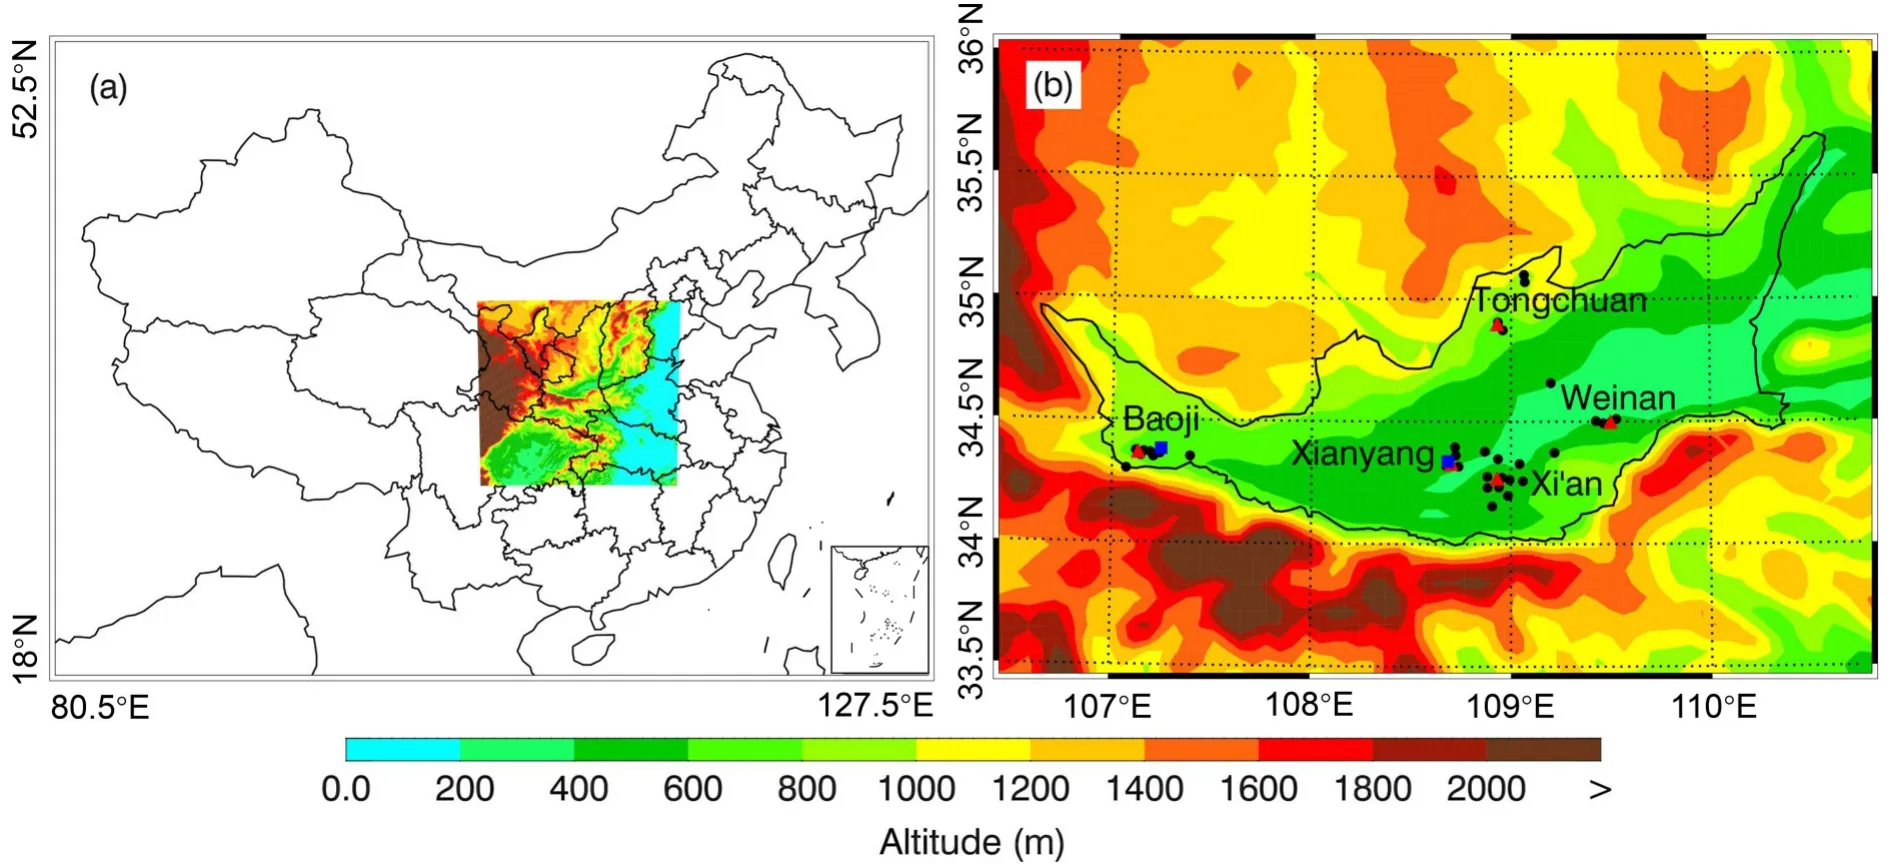
Fig. 1. (a) Map showing the location of the simulation domain and (b) the Guanzhong Basin (GZB). In (b), the filled black circles represent ambient monitoring sites in the GZB, the filled red triangles show the center of cities, and the filled blue rectangles denote the deployment location of the ACSM in Baoji and IGAC in Xianyang.
3. Results and discussions
3.1. ARI effects on local meteorological conditions
It has been well established that particles in the lowlevel atmosphere absorb or scatter the incoming solar radiation to attenuate the downward shortwave flux to the surface (SWDOWN) and reduce the surface temperature(TSFC), further restraining the development of the PBL and increasing near-surface [PM]. Figure 2 presents distributions of the average reduction in SWDOWN due to ARI under the four unfavorable synoptic patterns during the simulation period, evaluated by differentiating F_BASE and F_ARI0. On average, ARI reduces SWDOWN in the GZB by 10%–50%. In the case of the “north-low” pattern, the reduction of SWDOWN due to ARI is remarkable, ranging from 25% to 50% and with an average of 26.7%. However,under the conditions of the “transition” pattern, the average reduction of SWDOWN is 15.3% and mainly concentrated in the eastern part of the basin. For the “southeast-trough”and “inland-high” synoptic patterns, the average reduction of SWDOWN is 24.8% and 21.5%, respectively, which is in between those of “north-low” and “transition”. The variation of daytime TSFC (Fig. 3) is very consistent with that of SWDOWN, with the average reduction varying from 1.0°C to 1.7°C.
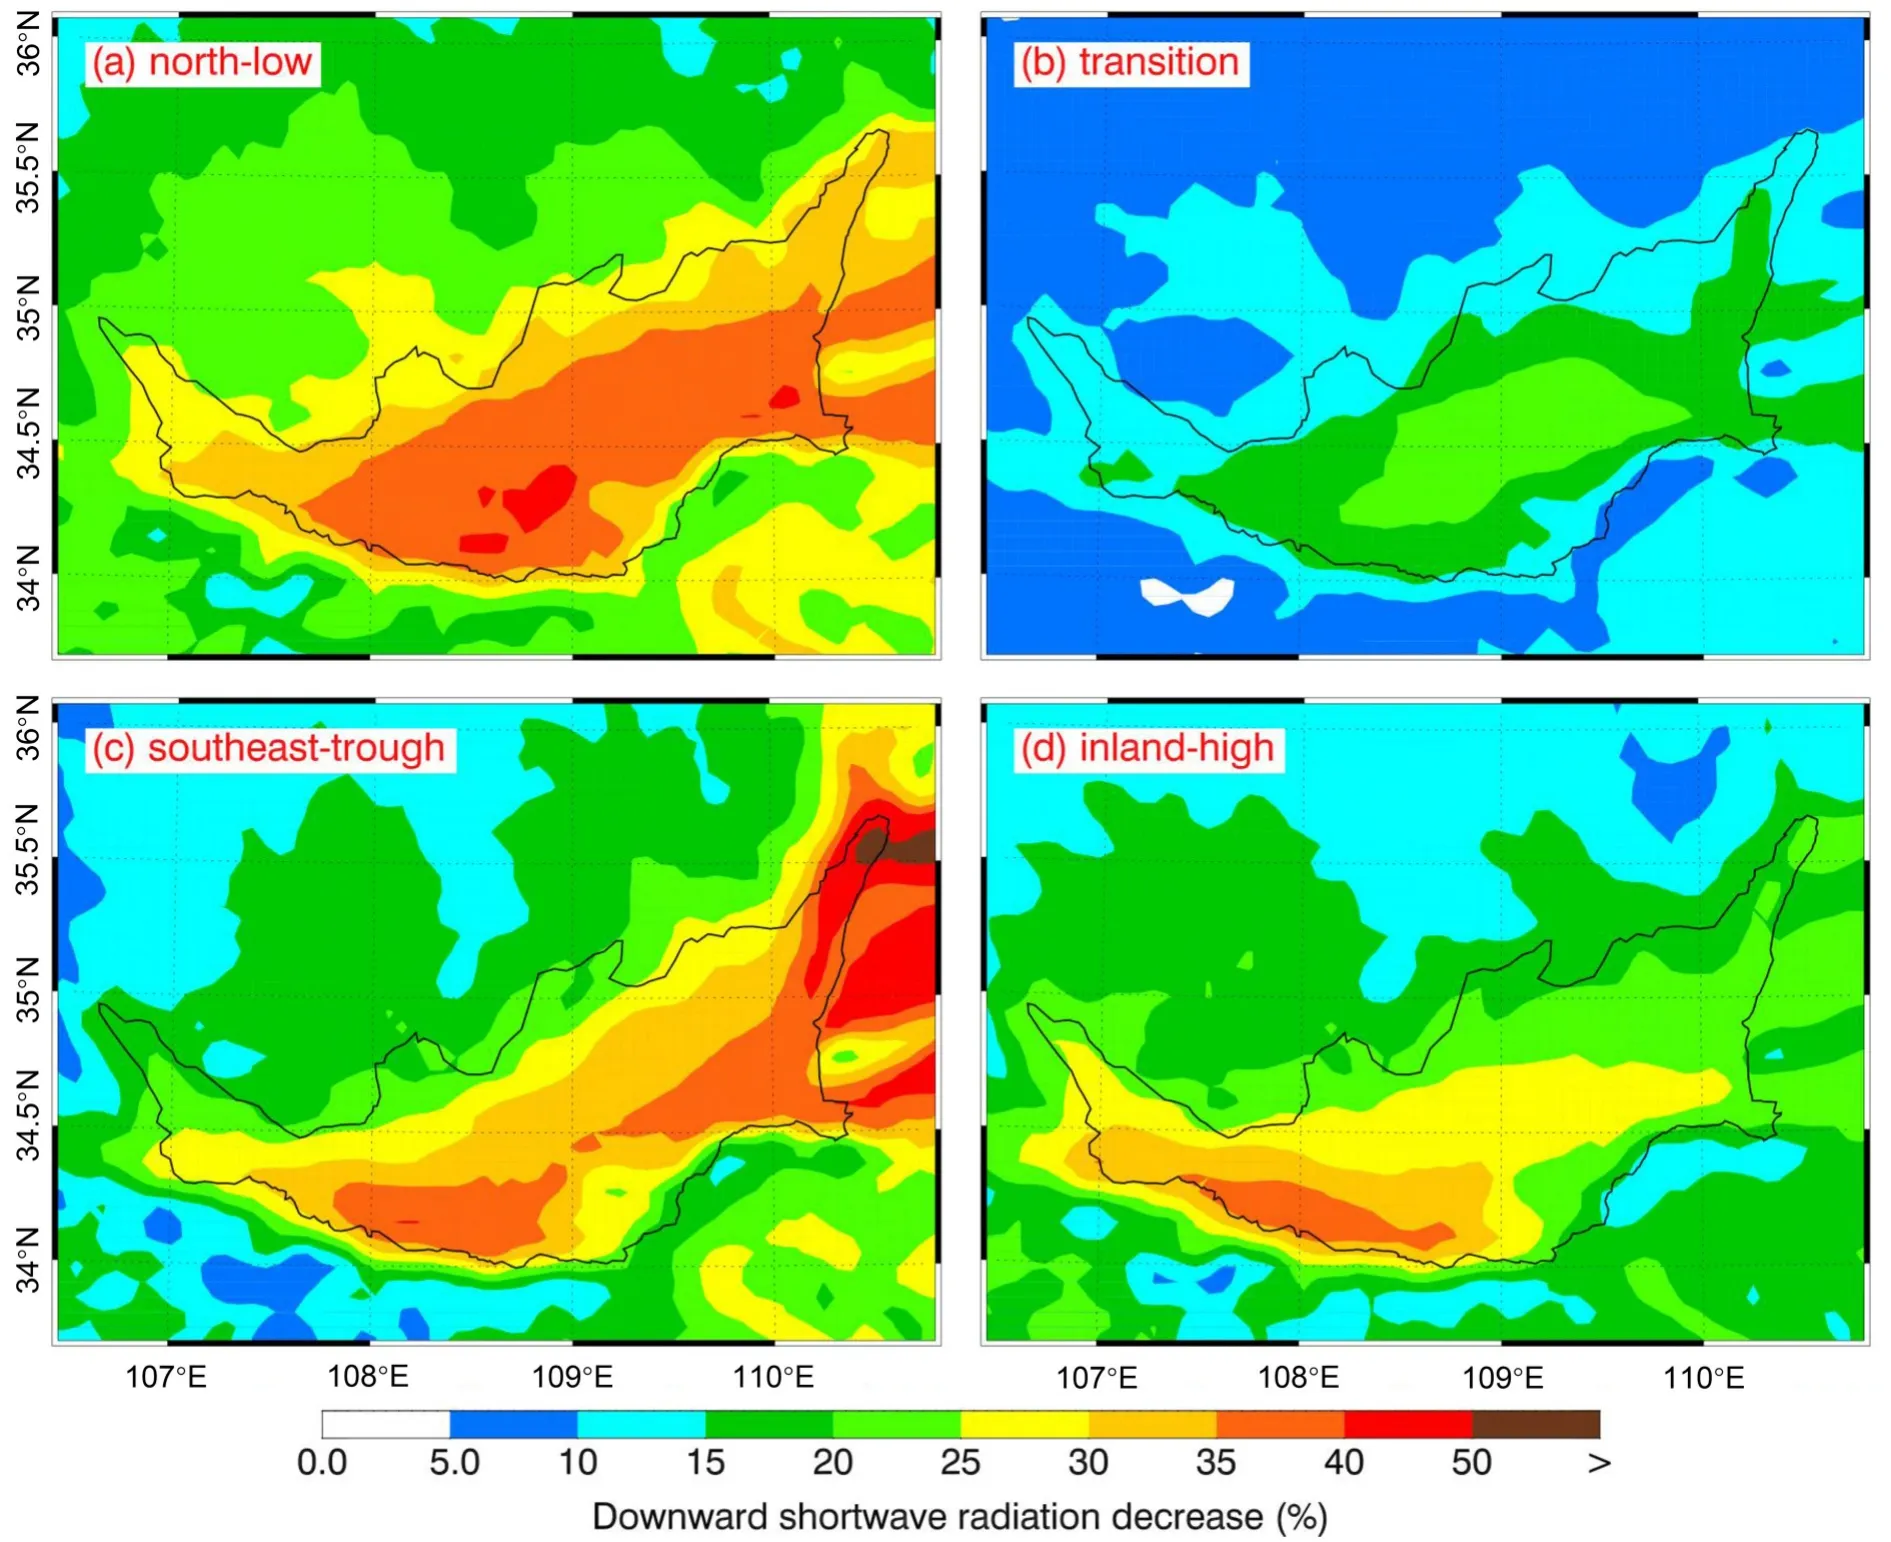
Fig. 2. Distribution of the average decrease of SWDOWN due to ARI under the synoptic pattern of (a) “north-low”, (b)“transition”, (c) “southeast-trough”, and (d) “inland-high”.
We further use an ensemble method to quantitatively verify the ARI effect on SWDOWN and TSFC, which cannot be reflected by the spatial variation of those variables.The daytime near-surface [PM] in the GZB under different unfavorable synoptic patterns in F_BASE is subdivided into 15 bins with an interval of 20 μg m. SWDOWN and TSFC in F_BASE and F_ARI0 in the same grid cell are aggregated as the bin [PM], respectively, and the average of variables in each bin is calculated. Figure 4 presents the SWDOWN reduction (%) induced by ARI as a function of bin [PM]. The reduction of SWDOWN generally increases linearly with increasing near-surface [PM], but exhibits large differences under the four synoptic patterns.In the case of the “north-low ” pattern, SWDOWN is reduced by about 20% due to ARI, with near-surface[PM] lower than 100 μg m. When [PM] increases from 100 to 300 μg m, the reduction of SWDOWN increases from 23% to around 40%. However, under the conditions of the “transition” pattern, when [PM] is lower than 20 μg m, SWDOWN is reduced by around 3.0%,much less than that under the “north-low” pattern. With[PM] increasing from 20 to 300 μg m, the reduction of SWDOWN increases from 4.6% to 30.8%. Wu et al. (2019)have evaluated the ARI effect on SWDOWN in the North China Plain during a haze event in winter using the WRFChem model. SWDOWN variations with [PM] under the conditions of the “transition” pattern in the present study are similar to those in Wu et al. (2019). However, the ARI impact on SWDOWN under the other three synoptic patterns is more significant than that in Wu et al. (2019) with the same near-surface bin [PM]. Additionally, the decrease in SWDOWN subsequently reduces the TSFC, and the TSFC reduction is usually proportionate to the near-surface [PM] under the conditions of the “transition” pattern(Fig. 5). A recent study by Rooney et al. (2020) has also reported 1°C–3°C reduction of surface temperature due to ARI during a major wildfire event in California, which is consistent with the findings in this study.
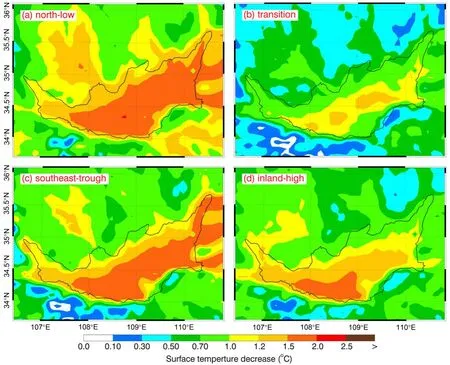
Fig. 3. Distribution of the average decrease of TSFC due to ARI under the synoptic pattern of (a) “north-low”, (b)“transition”, (c) “southeast-trough”, and (d) “inland-high”.
Apparently, the ARI effect on SWDOWN and TSFC exhibits large differences under the four unfavorable synoptic patterns with the same near-surface bin [PM]. For example, when the [PM] is between 40 and 60 μg m,the reduction of SWDOWN due to ARI is 20.4%, 8.1%,16.6%, and 10.0%, and the reduction of TSFC is 1.47°C,0.58°C, 0.83°C, and 0.72°C, respectively, under the conditions of the “north-low”, “transition”, “southeast-trough”,and “inland-high” patterns. It is worth noting that near-surface [PM] could not reasonably indicate the content of atmospheric aerosols in the whole vertical layer and the aerosol optical properties, such as aerosol optical depth (AOD)and single scattering albedo, which are also influenced by atmospheric moisture, aerosol constituents, mixing states,etc. Therefore, the variation of AOD with the same near-surface [PM] might cause the various impacts of ARI on SWDOWN and TSFC. Figure 6 shows the variations of AOD at 550 nm as a function of near-surface [PM] in F_BASE. With the same bin [PM], the AOD at 550 nm varies considerably under different synoptic patterns. Particularly, the AOD under the conditions of the “north-low” pattern is much higher than under the other synoptic patterns when [PM] does not exceed 100 μg m. In the case of the“north-low” pattern, the favorable dynamic conditions lead to humid air and enhanced occurrence of precipitation (Bei et al., 2016a), which not only facilitates hydroscopic growth of aerosols to increase the AOD, but also likely decreases PMconcentrations in the atmosphere by wet deposition.When [PM] is between 40 and 60 μg m, the AOD is 0.64, 0.19, 0.43, and 0.21, respectively, in the case of the“north-low”, “transition”, “southeast-trough”, and “inlandhigh” pattern, respectively, which is very consistent with variations of SWDOWN and TSFC. It is worth noting that the ARI effect not only relies on AOD and particle size, but it is also highly sensitive to the aerosol single scattering albedo(SSA). Figure S5 in the ESM shows the variations of the average SSA at 550 nm as a function of the near-surface [PM]under the four unfavorable synoptic patterns. In the case of the “southeast-trough” pattern, the SSA increases from about 0.82 to 0.85 with the near-surface [PM] increasing from 30 to 300 μg m. Under the conditions of the “transition” and “inland-high” patterns, the SSA fluctuates at around 0.85. In the case of the “north-low” pattern, the SSA is higher than it is for the other three patterns, particularly when the near-surface [PM] is low, which is mainly caused by the aerosol wet growth resulting from the humid situation. The simulated SSA in the study is similar to that in the North China Plain (Wu et al., 2020). Therefore, the difference of ARI effects on SWDOWN and TSFC under the four unfavorable synoptic patterns with the same near-surface bin [PM] can be mainly attributed to the AOD variation.
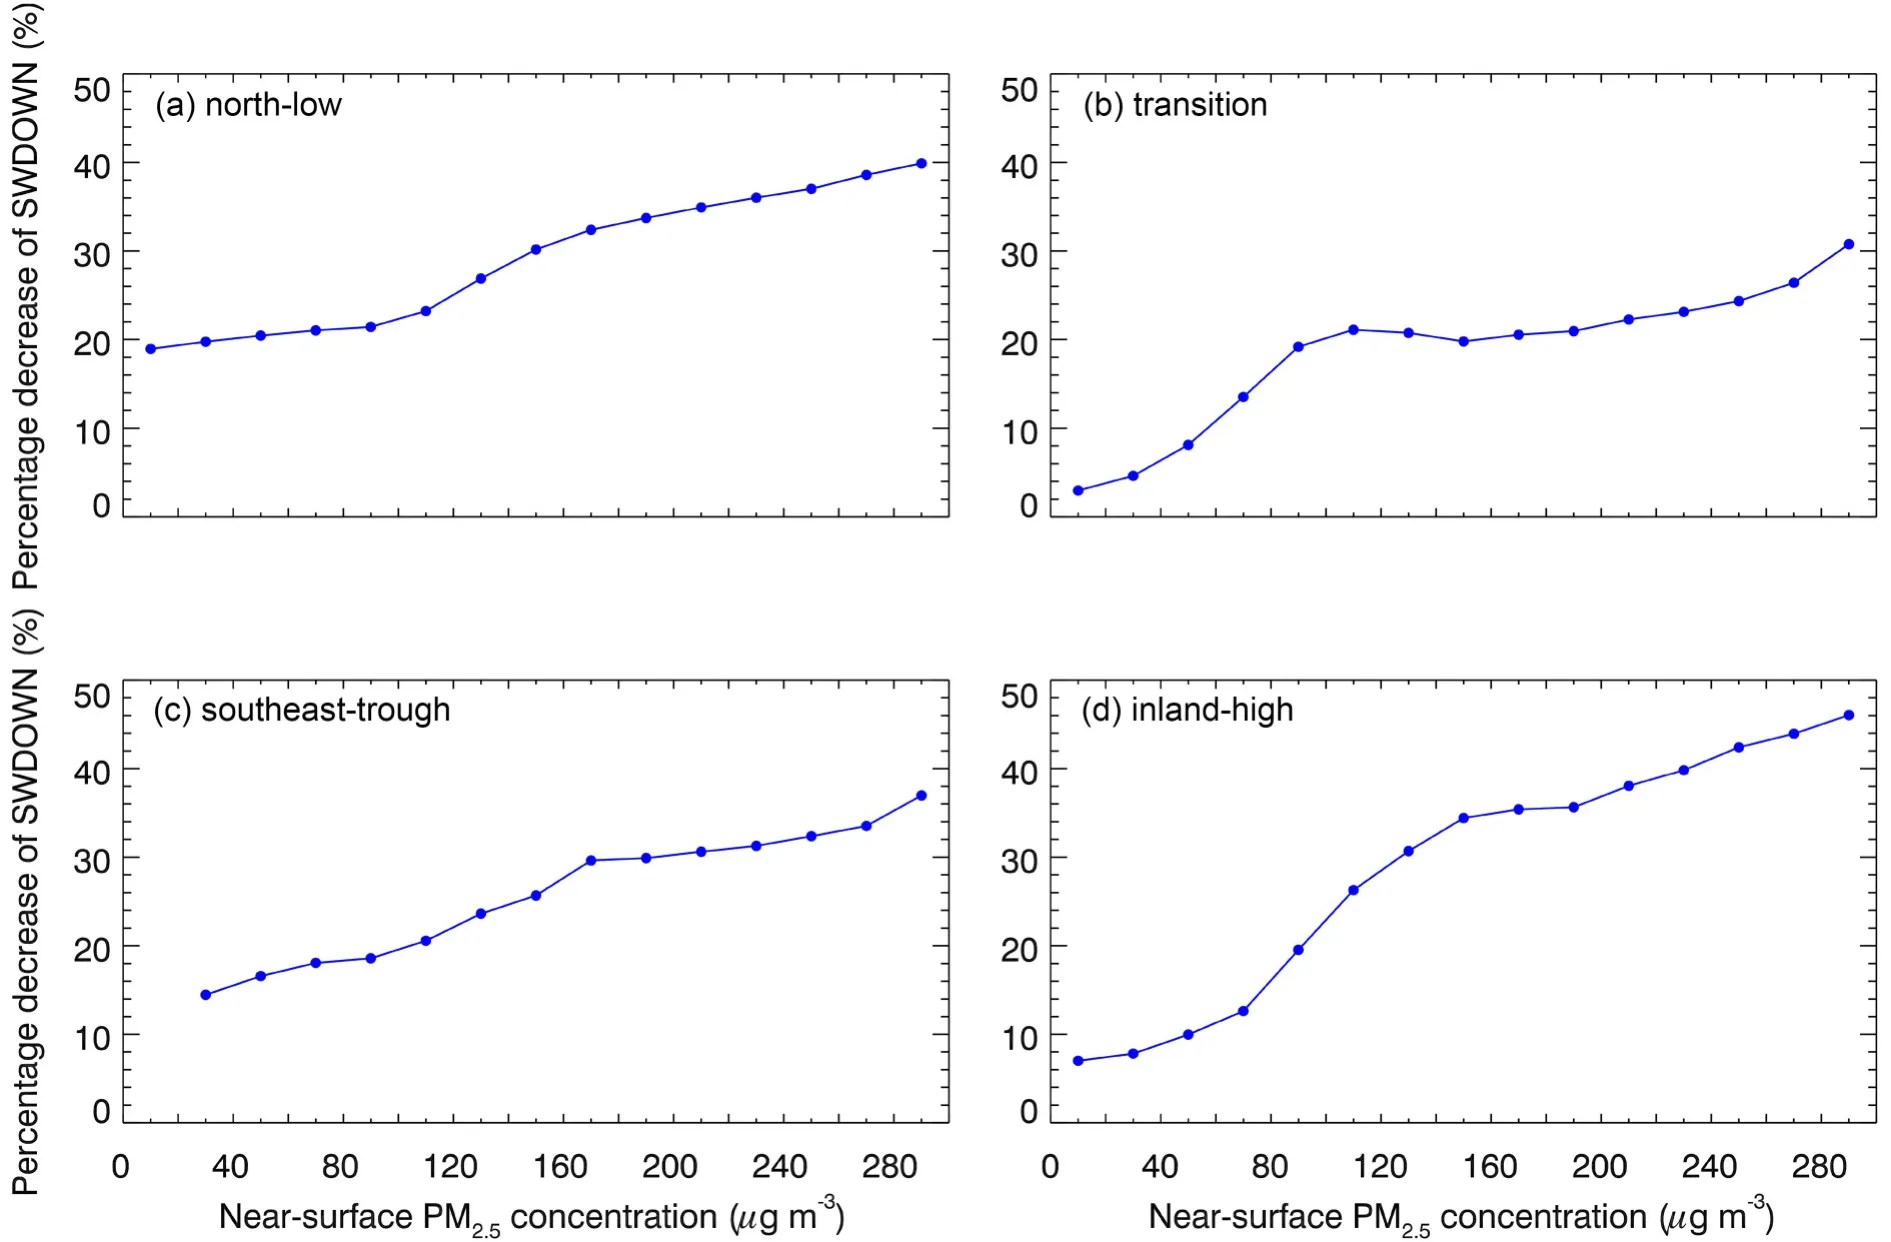
Fig. 4. Average percentage decrease of SWDOWN due to ARI as a function of the near-surface [PM2.5] in the GZB under the synoptic pattern of (a) “north-low”, (b) “transition”, (c) “southeast-trough”, and (d) “inland-high”.
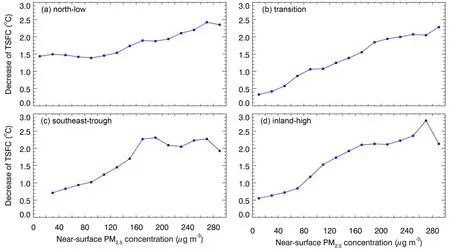
Fig. 5. Average decrease of daytime TSFC due to ARI as a function of the near-surface [PM2.5] in the GZB under the synoptic pattern of (a) “north-low”, (b) “transition”, (c) “southeast-trough”, and (d) “inland-high”.
Furthermore, ARI includes aerosol direct and semi-direct effects. Aerosols firstly alter the atmospheric temperature profile and then cause dynamic response, which would further influence the cloud formation. Therefore, the cloud variations induced by ARI also have potential to affect SWDOWN and TSFC. However, the exact impacts of ARI on clouds are uncertain. In the case of the “north-low” pattern, ARI decreases cloud fraction (CF) by 2.2% and increases cloud optical thickness (COT) by 3.4%, which is generally consistent with results found by Wu et al. (2020).Under the conditions of the “southeast-trough” and “inlandhigh” patterns, ARI facilitates cloud development, increasing the CF by 1.0% and 5.7% and the COT by 2.1% and 11.5%, respectively. Under the conditions of the “transition” pattern, the impact of ARI on clouds is insignificant due to lack of clouds. Figure 7 presents the variation of wind speed as a function of near-surface bin [PM]. Generally, ARI decreases wind speed in the GZB, via divergence induced by cooling. The reduction of wind speed is not significant in the case of the “north-low” and “transition” patterns, with decreases around 0.04 m s(1.5%) and 0.06 m s(2.3%), respectively. Under the conditions of the “southeast-trough” and “inland-high” patterns, the wind speed is reduced by 0.27 m s(6.7%) and 0.34 m s(7.8%), respectively. Figure S4 in the ESM shows the average vertical velocity below about 400 m in F_BASE and F_ARI0 as a function of near-surface bin [PM]. Apparently, the cooling effect caused by ARI generally induces net downward motion in the near-surface layer by constraining upward motion and accelerating downward motion.
Variations of TSFC and wind speed due to ARI affect development of the PBL, and PBLH is generally controlled by vertical wind shear and thermal conditions at the surface.Figure 8 shows the variation of PBLH as a function of nearsurface bin [PM] under the four synoptic patterns. ARI consistently reduces the PBLH, and the magnitude of the reduction of PBLH generally increases with an increase of near-surface [PM], but there are large differences under the four synoptic patterns. In the case of the “north-low” pattern,ARI substantially reduces PBLH from 23% to 44%, but the decrease of PBLH in the case of the “transition” pattern varies from 5.6% to 47.0% when [PM] increases from about 10 to 300 μg m. It is noted that the decrease of PBLH might not be very consistent with the variation of TSFC. In the case of the “inland-high” pattern with [PM] varying from 160 to 220 μg mand the “transition” pattern with[PM] ranging from 240 to 260 μg m, the reduction of TSFC is almost the same, about 2.1°C, but the reduction of PBLH is about 46.7% and 35.5%, respectively, showing the influence of synoptic patterns.
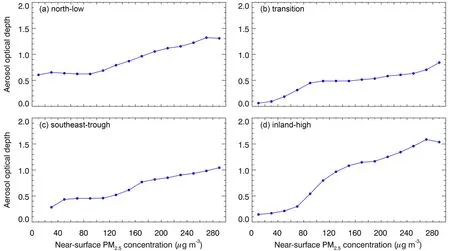
Fig. 6. Average daytime AOD in F_BASE as a function of the near-surface [PM2.5] in the GZB under the synoptic pattern of(a) “north-low”, (b) “transition”, (c) “southeast-trough”, and (d) “inland-high”.
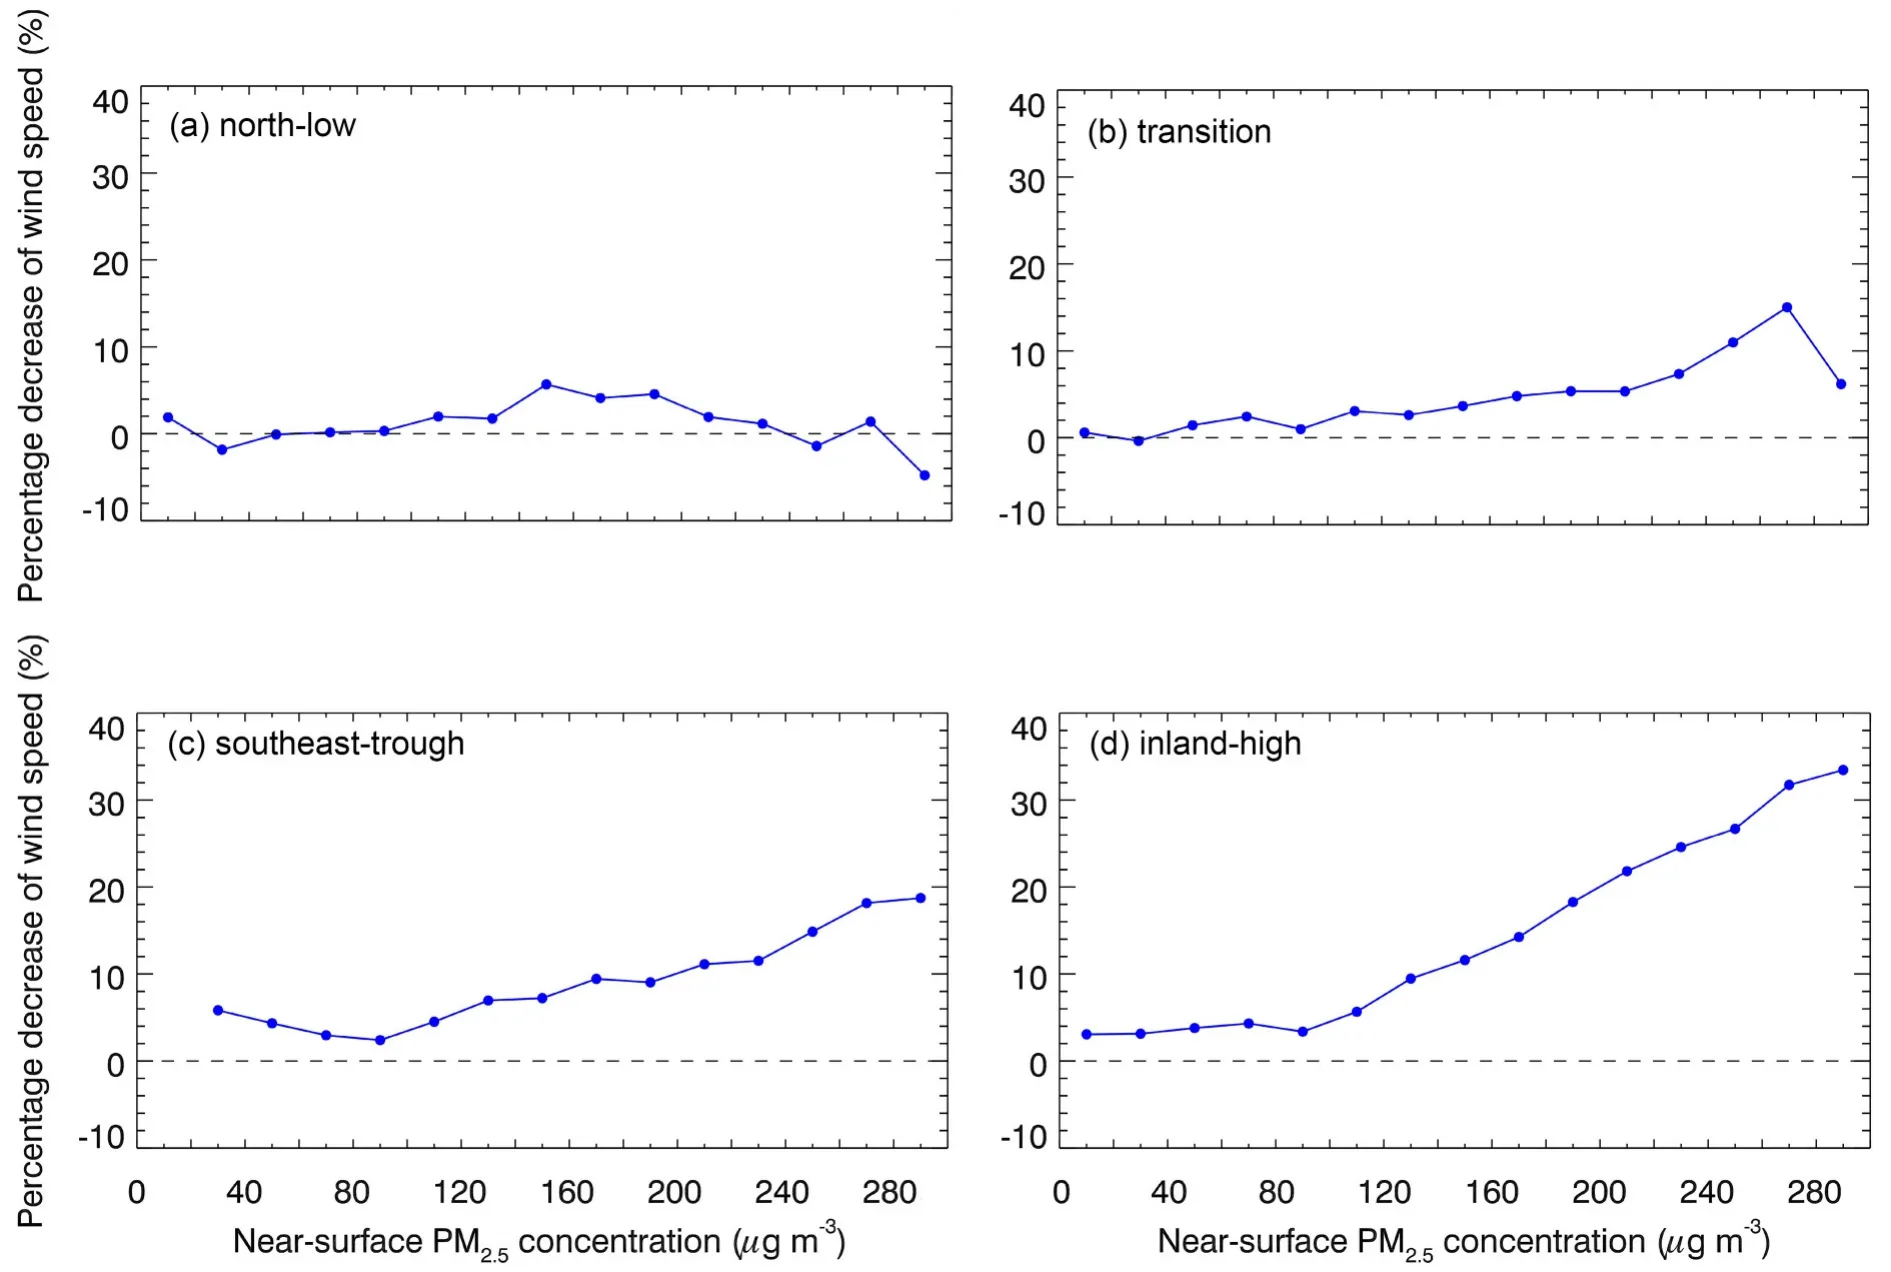
Fig. 7. Average decrease of daytime wind speed due to ARI as a function of the near-surface [PM2.5] in the GZB under the synoptic pattern of (a) “north-low”, (b) “transition”, (c) “southeast-trough”, and (d) “inland-high”.
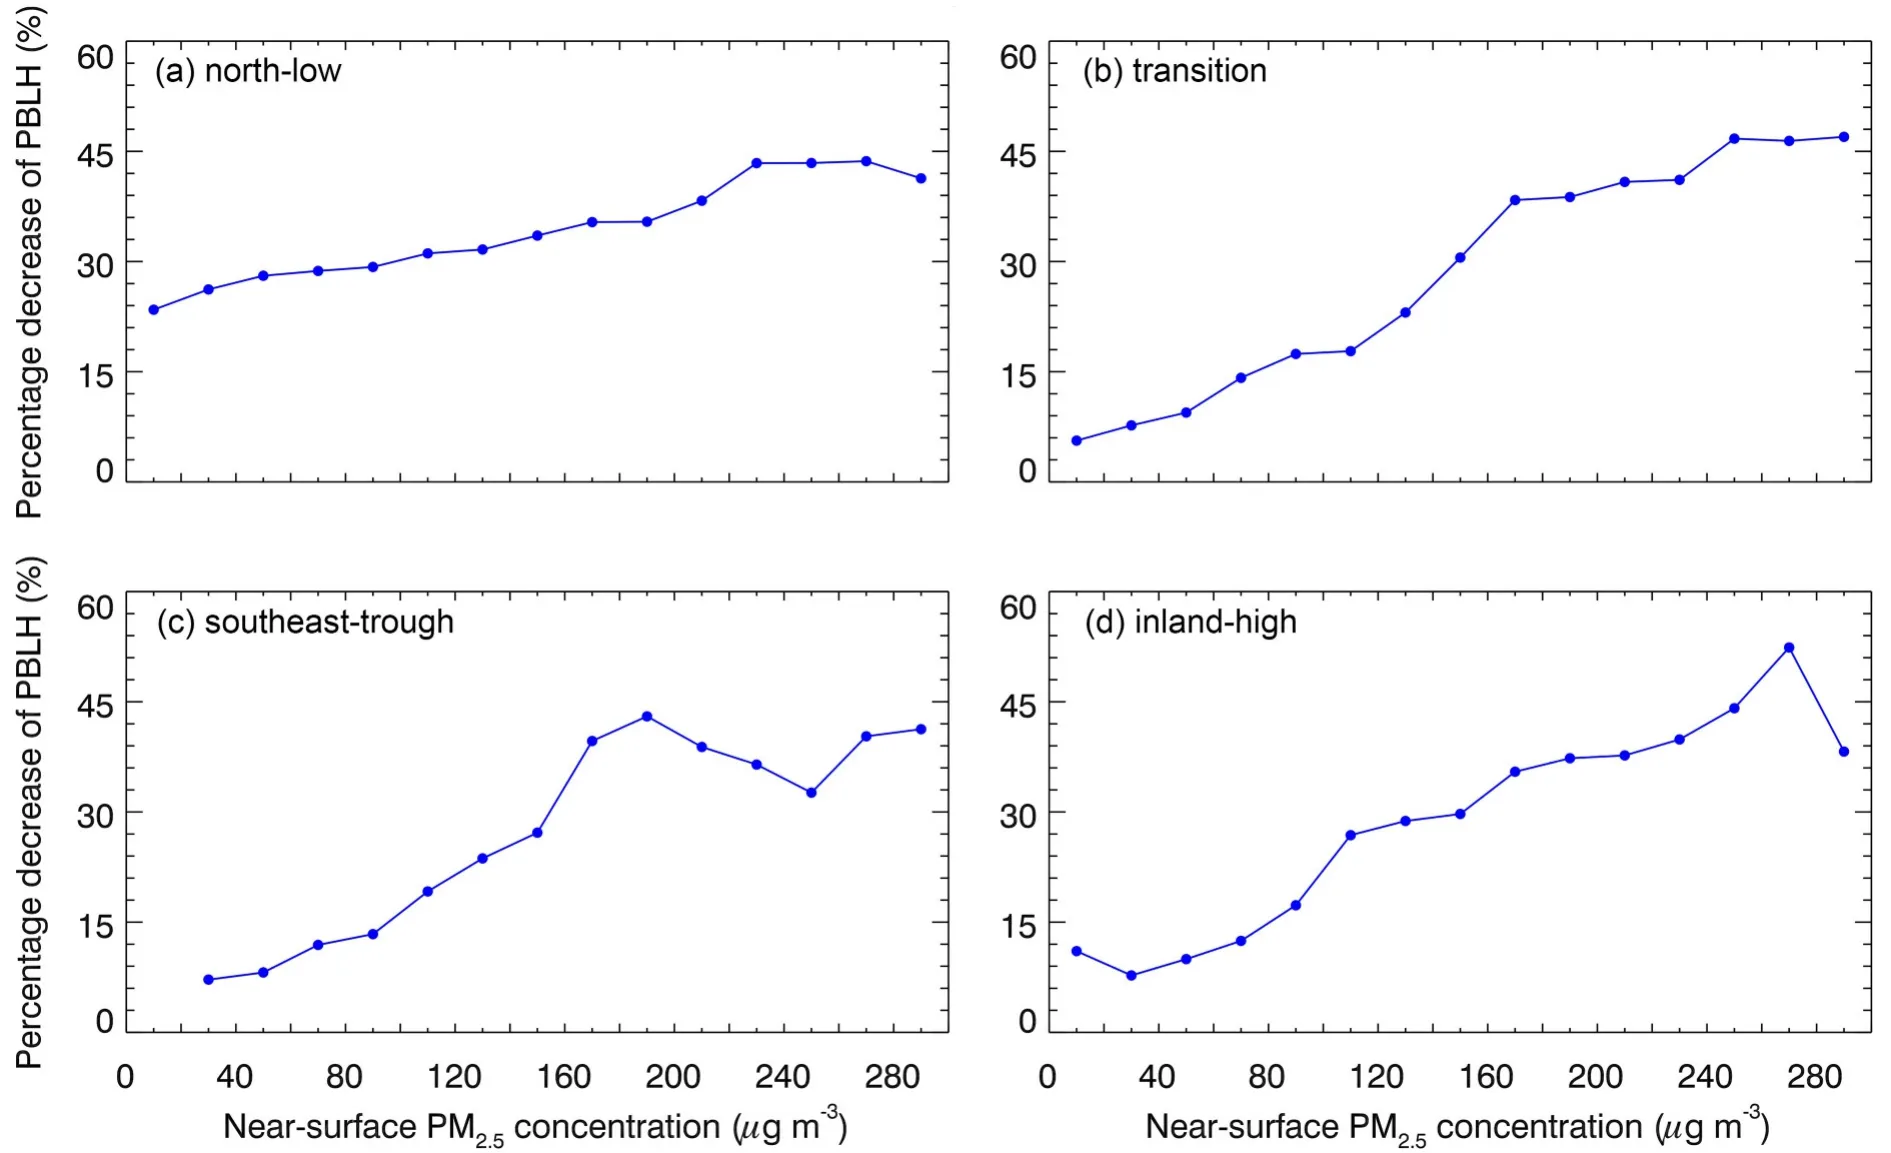
Fig. 8. Average percentage decrease of PBLH due to ARI as a function of the near-surface [PM2.5] in the GZB under the synoptic pattern of (a) “north-low”, (b) “transition”, (c) “southeast-trough”, and (d) “inland-high”.
3.2. ARI effects on PM pollution
ARI suppresses PBL development and lowers PBLH,facilitating air pollution accumulation in the PBL, as suggested by many previous studies (e.g., Wang et al., 2014a,2015; Gao et al., 2016; Zhang et al., 2018; Zhong et al.,2019; Li et al., 2020). Figure 9 shows distributions of the near-surface [PM] variations induced by ARI under the four unfavorable synoptic patterns. Although ARI consistently reduces PBLH, the ARI contribution to near-surface[PM] is not straightforward. ARI increases near-surface[PM] in the GZB most significantly in the case of the“north-low” pattern with an average PMcontribution of 13.5% (18.8 μg m), followed by 10.3% (11.5 μg m) for“inland-high”, 10.1% (15.2 μg m) for “southeast-trough”,and 8.5% (9.5 μg m) for “transition”. However, in some areas of the GZB, ARI reduces near-surface [PM] by 5–10 μg m.
Figure 10 presents the PMcontribution of ARI as a function of near-surface bin [PM] under the four synoptic patterns. Interestingly, when [PM] is more than a certain level (i.e., 80 μg min the case of the “north-low” pattern or 40 μg min the case of the “inland-high” pattern), ARI increases near-surface [PM], and the PMcontribution increases almost linearly with increasing [PM]. ARI contributes about 15%–25% of the near-surface [PM] when severe PM pollution occurs, with near-surface [PM] exceeding 250 μg m. However, when [PM] is less than a certain level ranging from 40 to 80 μg munder the four synoptic patterns, ARI reduces near-surface [PM] with decreased PBLH. In general, areas with increasing [PM]or high [PM] are controlled by convergence, and the opposite is true for divergence. There are two possible reasons for the negative effect ARI has on near-surface [PM]. Firstly,if the dynamic perturbation induced by ARI could not alter the regions of convergence and divergence, the ARI induced cooling effect accelerates the downward movement in the divergence area, increasing transport of clean air from the upper levels to the surface and therefore reducing near-surface [PM]. Secondly, if the ARI effect changes an area from convergence to divergence, this also causes air pollution dispersion in the area.
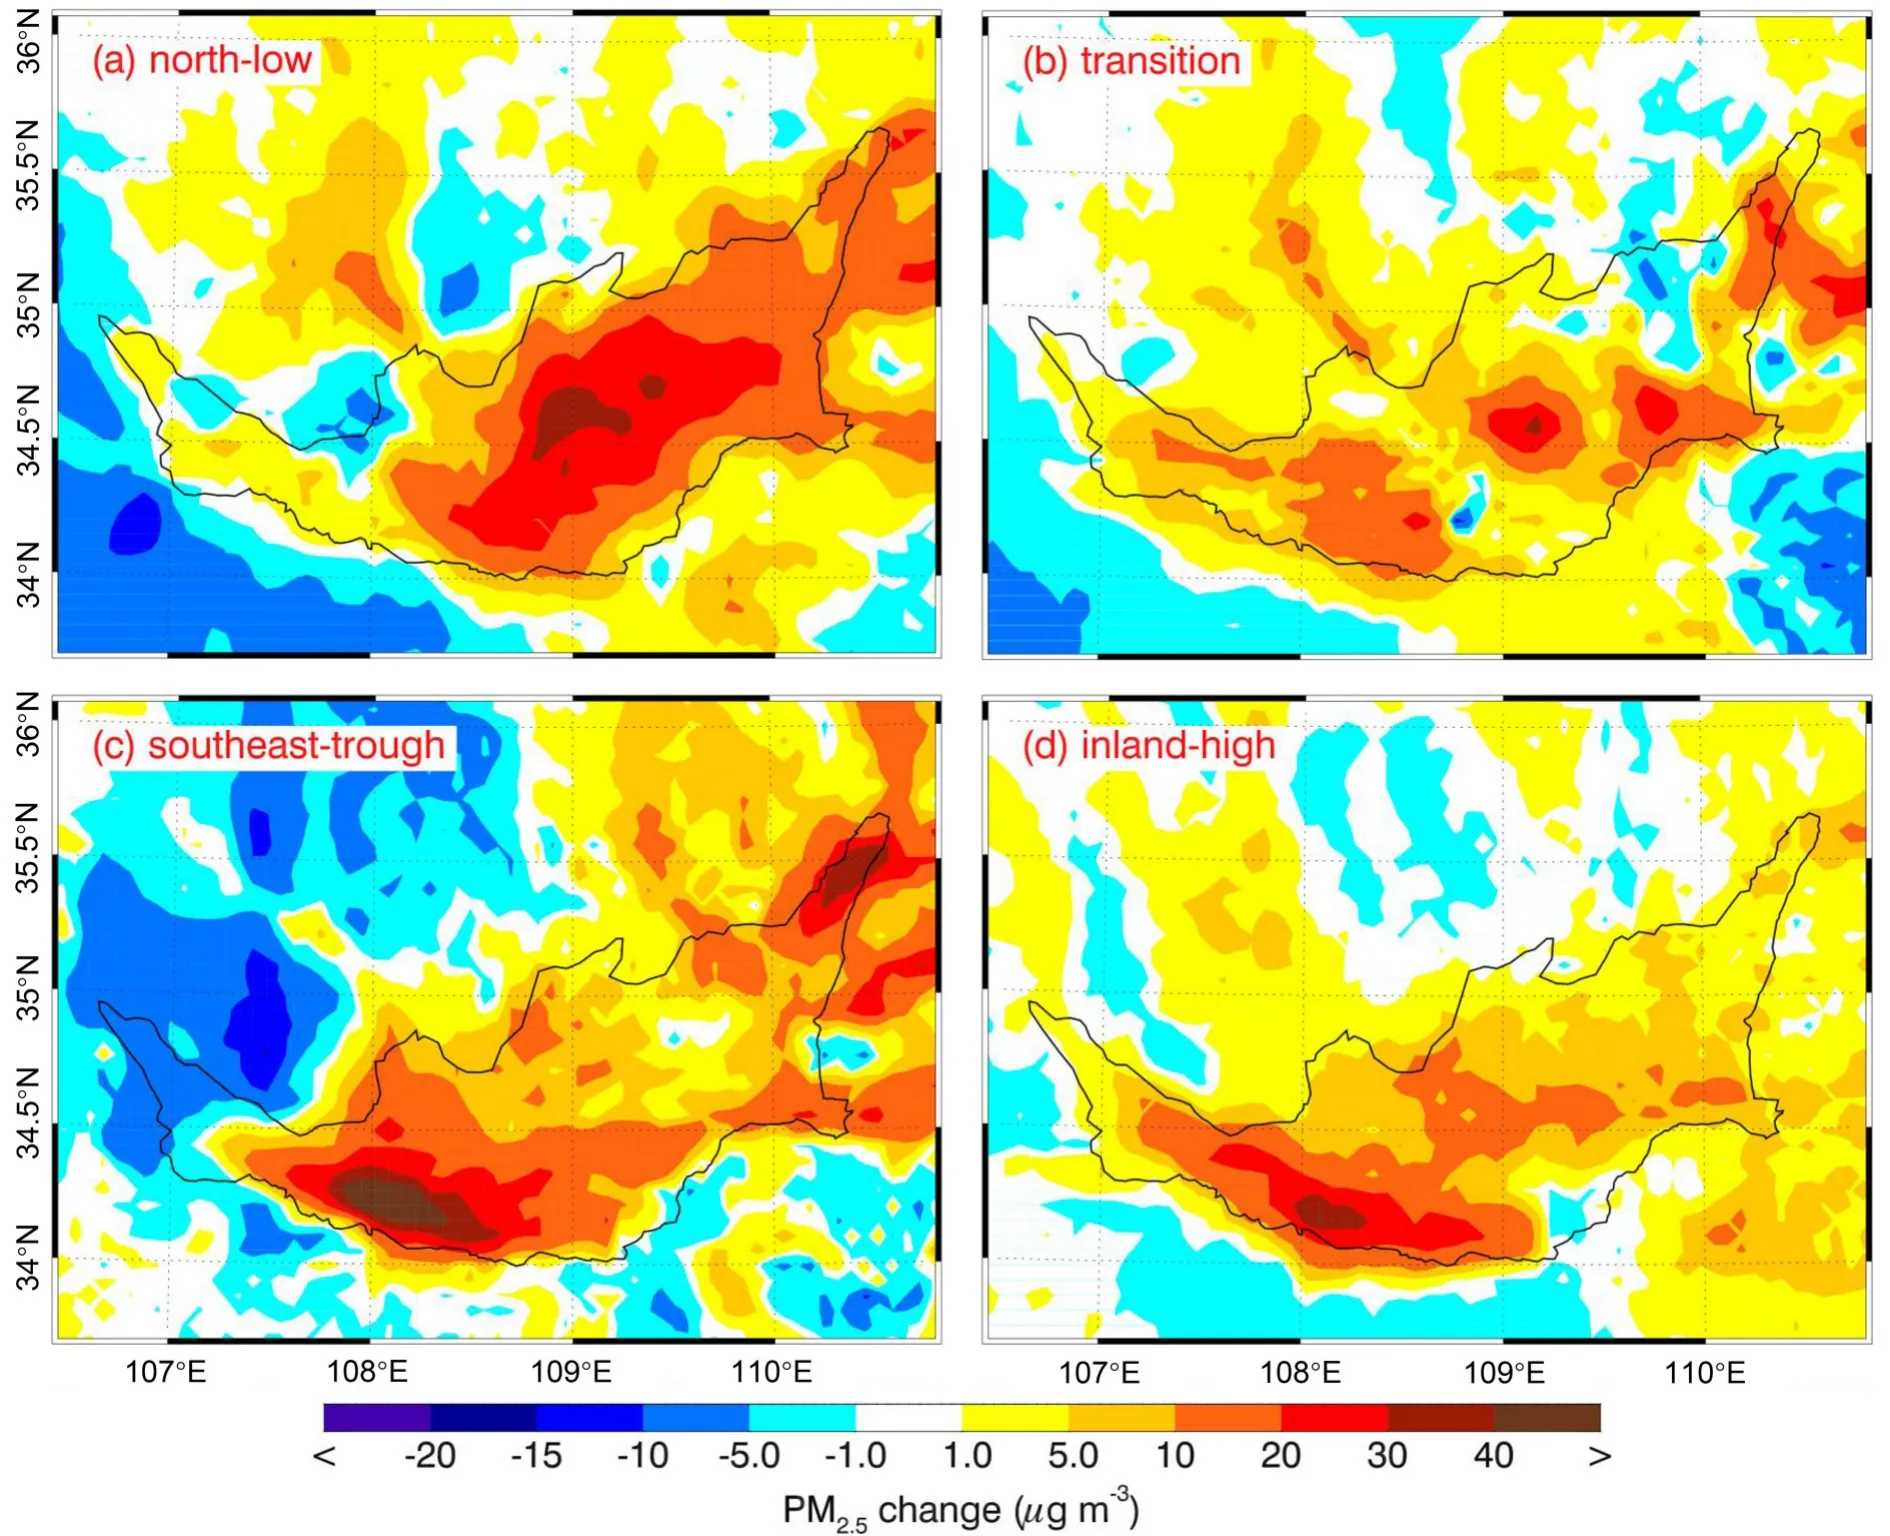
Fig. 9. Distribution of the average variation of near-surface [PM2.5] due to ARI under the synoptic pattern of (a) “north-low”,(b) “transition”, (c) “southeast-trough”, and (d) “inland-high”.
During the simulation period, organic aerosols are the major chemical component of PMin the GZB, with POA and SOA accounting for 18.7% and 14.9%, respectively(Fig. S6 in the ESM). Nitrate aerosols have played an important role in PM pollution in the GZB, with a PMcontribution of 22.2%. Ammonium, sulfate, and black carbon (BC)aerosols contribute 10.7%, 9.1%, and 6.2% of the [PM],respectively, and the remaining 18.2% is from unspecified species (mainly dust aerosols). To further evaluate contributions of the ARI effect of aerosol species to near-surface[PM] under the four synoptic conditions, two more sensitivity simulations are conducted by excluding main absorbing aerosols (including BC and brown carbon) and scattering aerosols (including sulfate, nitrate, ammonium, and SOA), when calculating the aerosol properties. Compared with the F_BASE, the near-surface PMcontribution from the ARI effect of the main absorbing aerosols is 2.4%, 1.5%, 1.1%,and 1.8% under the conditions of the “north-low”, “transition”, “southeast-trough”, and “inland-high” patterns, respectively. The PMcontribution induced by the main scattering aerosols is 4.1%, 3.3%, 3.0%, and 3.6% under the four synoptic conditions, respectively, which are more than those by absorbing aerosols, suggesting that the scattering aerosols play a more important role than the absorbing aerosols in the ARI effect on PM pollution.
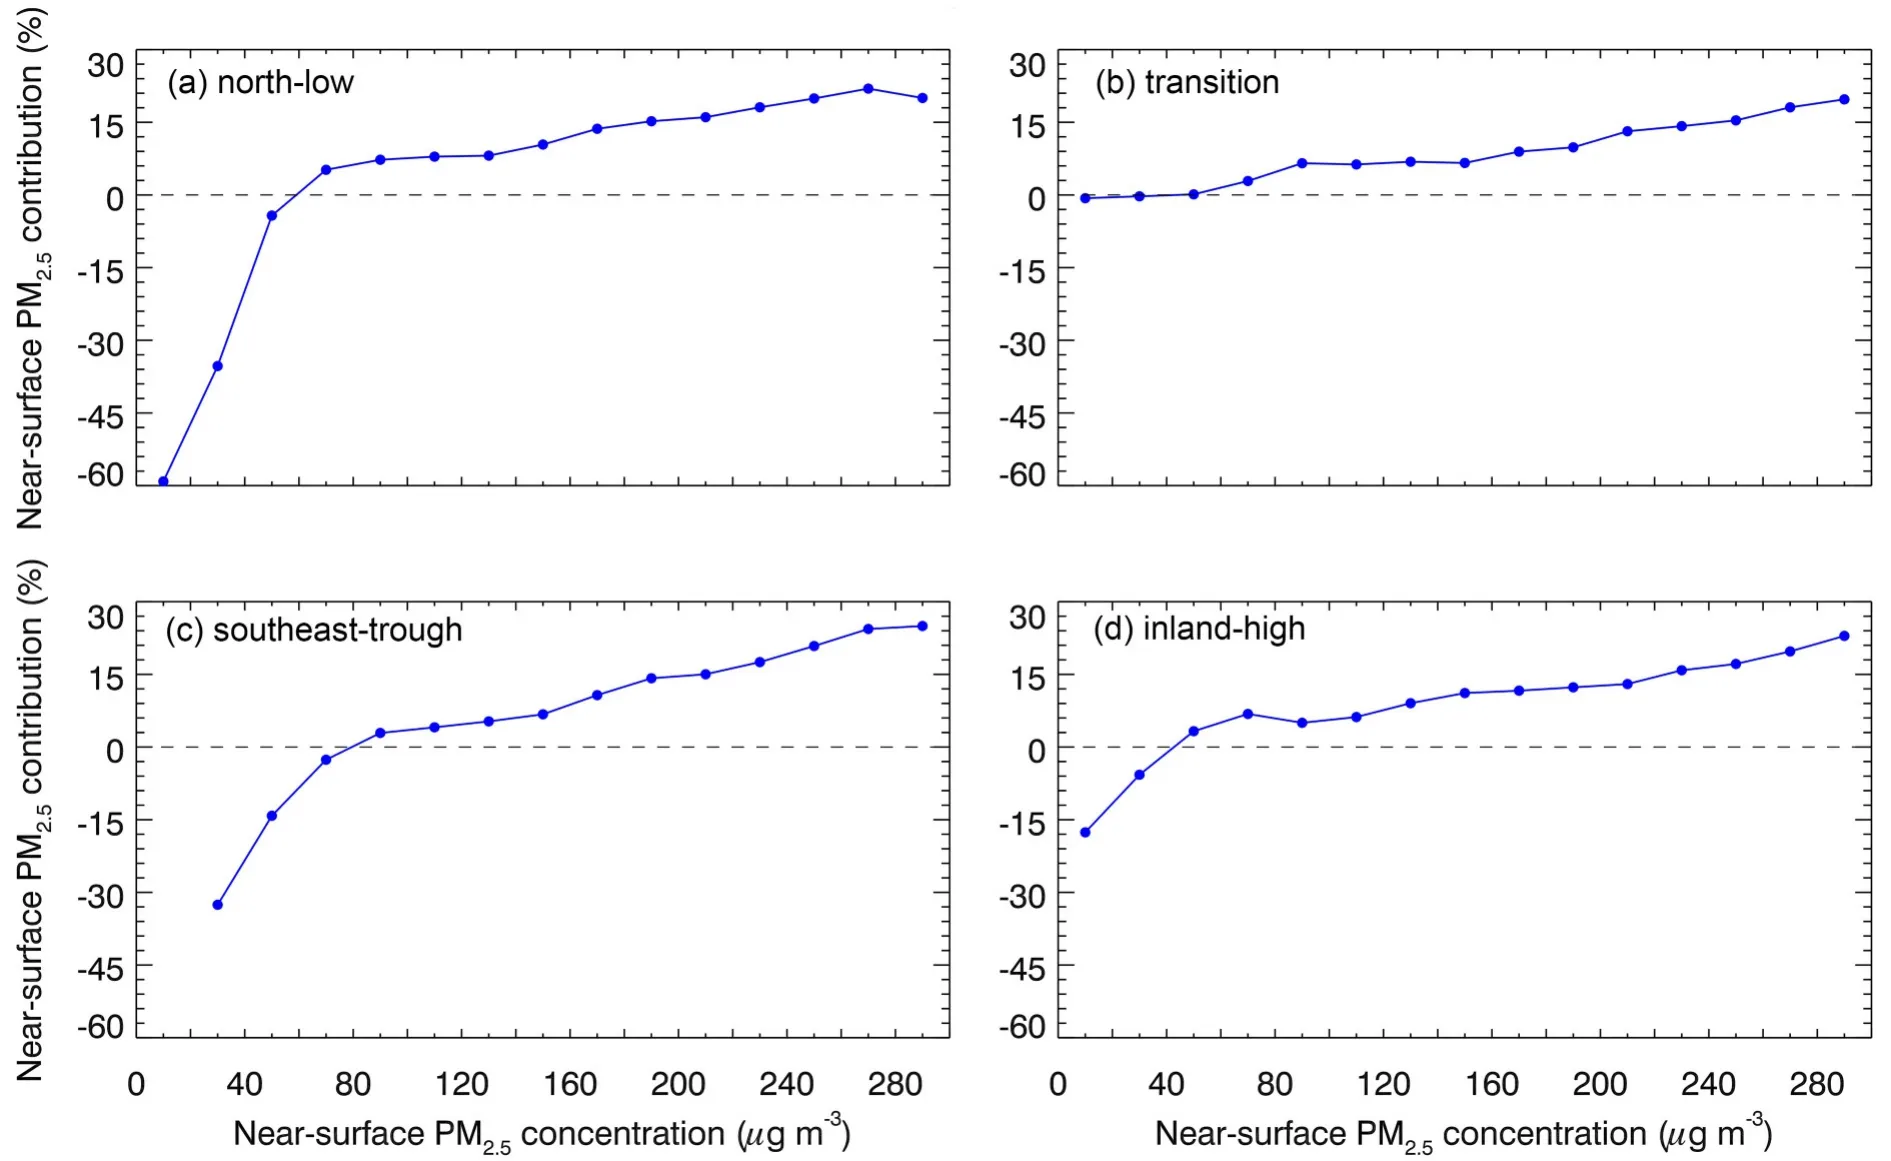
Fig. 10. Average daytime PM2.5 contribution due to ARI as a function of the near-surface [PM2.5] in the GZB under the synoptic pattern of (a) “north-low”, (b) “transition”, (c) “southeast-trough”, and (d) “inland-high”.
4. Summary and conclusions
In this study, the ARI effect on local meteorological conditions and PM pollution is evaluated using the WRF-Chem model under four unfavorable synoptic patterns, including“north-low”, “transition”, “southeast-trough”, and “inland-high”. Persistent and heavy PM pollution from 29 December 2018 to 29 December 2019 in the GZB is simulated. Generally, the spatiotemporal variations of air pollutants are well reproduced by the model when compared to observations at monitoring stations in the GZB. The calculated sulfate, nitrate, and ammonium mass concentrations are also in good agreements with measurements in Xianyang and Baoji.
As proposed by previous studies, ARI consistently decreases SWDOWN and TSFC in the GZB, but there exist large differences under the four unfavorable synoptic patterns. ARI decreases SWDOWN and daytime TSFC in the GZB most significantly in the case of the “north-low” pattern with average reduction of 26.7% and 1.69°C, respectively, followed by 24.8% and 1.62°C for “southeasttrough”, 21.5% and 1.34°C for “inland-high”, and 15.2%and 1.04°C for “transition”. Ensemble analyses also reveal that the magnitudes of the SWDOWN and TSFC reductions generally increase linearly with an increase of near-surface [PM]. Perturbation of air temperature induced by ARI also alters the wind fields. The divergence induced by the cooling effect due to ARI decreases the near-surface wind speed during daytime by 1.4% for “north-low”, 2.3%for “transition”, 6.8% for “southeast-trough”, and 7.8% for“inland-high” on average, respectively. Additionally, the cooling effect also induces a downward motion in the near-surface layer.
ARI consistently decreases the PBLH under the four synoptic patterns, which is in agreement with results from previous studies (e.g., Wu et al., 2019), with the average reduction of 32.0% for “north-low”, 18.7% for “transition”,26.1% for “southeast-trough”, and 21.5% for “inland-high”during daytime. However, the near-surface [PM] variation does not correspond well to that of PBLH. The daytime PMcontribution of ARI is 12.0%, 8.1%, 9.5%, and 9.7% under the abovementioned four synoptic patterns,respectively. Additionally, scattering aerosols play a more important role in the ARI effect on the PM pollution than absorbing aerosols. Furthermore, ensemble analyses show that when [PM] is less than a certain level ranging from 40 to 80 μg munder the four synoptic patterns, ARI decreases near-surface [PM] with decreased PBLH,which is caused by enhanced divergence or transition from divergence to convergence in the area.
The WRF-Chem model generally exhibits reasonably good performance in air pollutants and aerosol species simulations, but uncertainties in meteorological conditions, emission inventory, and chemical mechanisms could still potentially influence the assessment of ARI effects on meteorological fields and PM pollution. It is worth noting that it is impossible to disentangle the PMcontribution of the aerosol direct and semi-direct effect since the semi-direct effect is the result of the direct effect. In the present study, we mainly focus on evaluation of the PMcontribution of the ARI effect. Future studies need to be conducted to verify the PMcontribution of the ACI or aerosol indirect effect during haze days, considering that ACI also alters temperature and moisture profiles and precipitation, potentially influencing PM pollution. A recent study also shows that the photolysis rate modifications induced by the absorbing or scattering aerosols (API effect) in the atmosphere also affect PM formation, which could counterbalance the ARI effect on PM pollution (Wu et al., 2020). Future research needs to be conducted to explore the ACI and API effects on PM pollution in the GZB.
Acknowledgements
. This work is financially supported by the National Key R&D Plan (Grant No. 2017YFC0210000), the Strategic Priority Research Program of Chinese Academy of Sciences(Grant No. XDB40030200), the National Natural Science Foundation of China (Grant No. 41975175), and the Fundamental Research Funds for the Central Universities of China.Electronic supplementary material
: Supplementary material is available in the online version of this article at https://doi.org/10.1007/s00376-020-0329-7.杂志排行
Advances in Atmospheric Sciences的其它文章
- Anthropogenic Effects on Biogenic Secondary Organic Aerosol Formation
- Spatial and Temporal Distributions and Sources of Anthropogenic NMVOCs in the Atmosphere of China: A Review
- Characteristics of Chemical Speciation in PM1 in Six Representative Regions in China
- Characterization of Organic Aerosol at a Rural Site in the North China Plain Region: Sources, Volatility and Organonitrates
- Particulate Amines in the Background Atmosphere of the Yangtze River Delta, China: Concentration, Size Distribution, and Sources
- Analysis of the Effect of Optical Properties of Black Carbon on Ozone in an Urban Environment at the Yangtze River Delta, China
