Effi ciency of phosphorus accumulation by plankton,periphyton developed on submerged artificial substrata and metaphyton: in-situ observation in two shallow ponds*
2021-06-15MarijaPESlaanaPOPOVIVesnaMILUTINOVIGordanaSUBAKOVSIMIIvanaTRBOJEVIDraganaPREDOJEVI
Marija PEĆIĆ , , Slađana POPOVIĆ , Vesna MILUTINOVIĆ ,Gordana SUBAKOV SIMIĆ , Ivana TRBOJEVIĆ , Dragana PREDOJEVIĆ
1 Institute of Botany and Botanical Garden‘Jevremovac’, Faculty of Biology, University of Belgrade, Belgrade 11000, Serbia
2 Institute of Chemistry, Technology and Metallurgy, Scientific Institution, National Institute, Center for Ecology and Technoeconomics, University of Belgrade, Belgrade 11000, Serbia
3 Institute of Public Health of Belgrade, Belgrade 11000, Serbia
Abstract Phosphorus overenrichment of shallow ponds prevailing in wetlands leads to their eutrophication causing the collapse of those vulnerable habitats. The potential of phosphorus accumulation by periphyton developed on artificial substrata has been investigated in two shallow ponds (Baračka and Široki Rit) in northwest Serbia and compared to the same ability of plankton and metaphyton. The periphyton substrate carrier has been submerged from May to October. Both continuously (CS) and monthly developed (MS)periphyton were sampled. Autotrophic component of all investigated communities has been qualitatively assessed. Maximum accumulation of only 14.7 mg TP/m 2 was recorded in three-month exposed periphyton CS. MS exposed from July to August reached maximal 12.7 mg TP/m 2. Plankton community that was characterized by more diverse and abundantly developed algal component was more eff ective in phosphorus accumulation (0.7 mg/g dry weight) in comparison with dominantly inorganic and diatom-dominated periphyton in Baračka. Unstable conditions caused by recent revitalization (dredging organic matter and mud from pond basin—redigging) as well as rapid desiccation of Široki Rit disabled making an unambiguous conclusion about the effi ciency of phosphorus accumulation among diff erent communities, but suggested slight potential of phosphorus harvesting by metaphyton in this pond. Due to the shorter exposure time that brings the reduced risk of unpredictable changes in the ecosystem, as well as the considerable amount of accumulated phosphorus, large-scale application of one-month exposed periphyton developed on artificial substrates would be more advisable for phosphorus harvesting in nutrient aff ected shallow ponds.
Key word: periphyton; phosphorus accumulation; shallow ponds; (phyto)plankton; metaphyton;eutrophication
1 INTRODUCTION
The last decades of the 20thcentury faced us with the eutrophication—extensive nutrient overenrichment of aquatic ecosystems. Regarded as the limiting nutrient in most freshwater ecosystems,phosphorus represents one of the key factors promoting this process (Carpenter et al., 1995).Consequently, eutrophication leads to the water impairment reflected in the occurrence ofintense and frequent harmful algal and cyanobacterial blooms and consequential anoxia followed by biodiversity loss(Jöbgen et al., 2004). This phenomenon aff ects all types of ecosystems, including lakes (deep and shallow), reservoirs, streams, rivers, estuaries and coastal waters, as well as wetlands.
Shallow stagnant waters, prevailing in the wetlands,such as shallow lakes, ponds, and ditches have been considered as the most susceptible to eutrophication(Janse, 2004). The dominance of macrophytes regarded as main primary producers in natural(unaff ected) shallow ecosystems is usually collapsed during the eutrophication. It is, further, directly related to the drastic changes in the algal, invertebrate and fish communities leading to the ecosystem degradation (Janse, 2004). Additionally,eutrophication is magnified in shallow ecosystems by intense sediment-water contact that implicates much of the phosphorus that has been absorbed by the sediment during the eutrophication can be released to the water column later. This phenomenon can cause a delay in the water response despite the reduction of external loading (Scheff er, 2004).
Plenty of methods have been proposed to remove the phosphorus from the water so far: physical (e.g.reverse osmosis membranes, electrocoagulation (Pratt et al., 2012), hypolimnetic aeration/oxygenation,hypolimnetic withdrawal, sediment dredging(Bormans et al., 2016)), chemical (e.g. filtration by chemically reactive substrates, adsorption by polymers and nanomaterials, struvite precipitation(Pratt et al., 2012)) and biological (e.g. periphyton bioreactors (Wu et al., 2010; Sukačová et al., 2015),hybrid floating treatment bed (HFTB) method (Liu et al., 2016), algae scrubbers (Sindelar et al., 2015)).The last mentioned ones are recognized as environmentally friendly, sustainable, more acceptable for public, highly effi cient and low cost,making them promising in the processes of potential aquatic ecosystem restoration and remediation(Jöbgen et al., 2004; Roeselers et al., 2008; Wu et al.,2010; Liu et al., 2016; Sukačová and Červeny, 2017).
Periphyton refers to the complex community of attached autotrophic and heterotrophic microorganisms on some substrate in water, including associated non-attached organisms and detritus (Azim et al., 2005). Due to its important role in nutrient cycling and production in aquatic ecosystem,especially in shallow ones, as well as easy manipulation of developed biomass (artificial substrate introduction, easy harvesting, and biomass use), it was considered as a suitable protagonist of biological method employed in aquatic ecosystems(Dodds, 2003; Jöbgen et al., 2004; McCormick et al.,2006; Drake at al., 2012).
High periphyton eff ectiveness in phosphorus accumulation has been reported in natural water ecosystems (Adey et al., 1993; Jöbgen et al., 2004;Périllon et al., 2017), mesocosm experiments(Drenner et al., 1997; Lu et al., 2016; He et al., 2017)and particularly wastewater treatment (Guzzon et al.,2008; Cao et al., 2014; Kesaano and Sims 2014;D’Aiuto et al., 2015) suggesting this method as an eff ective ecotechnology for large-scale nutrient removal from polluted wastewater. Simulating natural system, Lu et al. (2016) revealed periphyton capacity not only to capture phosphorus from water column,but also from the sediments, buff ering phosphorus release and precipitation between sediments and water. It is also revealed that the communities with higher species diversity take greater advantage of the niche opportunities in an environment that further implies the diverse systems can capture a greater proportion of biologically available resources(Cardinale, 2011). Jöbgen et al. (2004) envisioned several serious diffi culties during the large-scale insitu employment of periphyton in aff ected ecosystems addressing technical problems, human interference and most important, unpredictable changes in the ecosystem caused by unprecedented periphyton growth.
Considering the extreme importance of shallow aquatic ecosystems, harmful consequences of their eutrophication, the advantages of the employment of biological methods in the aff ected ecosystems as well as the relation between nutrient accumulation and diversity of employed communities, the current study had several aims:
1) To conduct qualitative and quantitative characterization and diversity estimation of algal component of periphyton, plankton, and metaphyton in two ponds diff ering in nutrient concentration and anthropogenic impact;
2) To evaluate and compare the effi ciency in temporal accumulation and storage of soluble phosphorus between one-month and several months exposed periphyton developed on the artificial substrates;
3) To compare it with the same ability of diff erent communities (metaphyton and plankton) present in the investigated ecosystems with a particular emphasis on their autotrophic component.
1.1 Description of the study area
The investigation was performed in two localities named Baračka and Široki Rit in northwest Serbia,Vojvodina province, in one of the best-preserved wetlands in the Danube River Basin—Special Nature Reserve ‘Gornje Podunavlje’ (Fig.1).
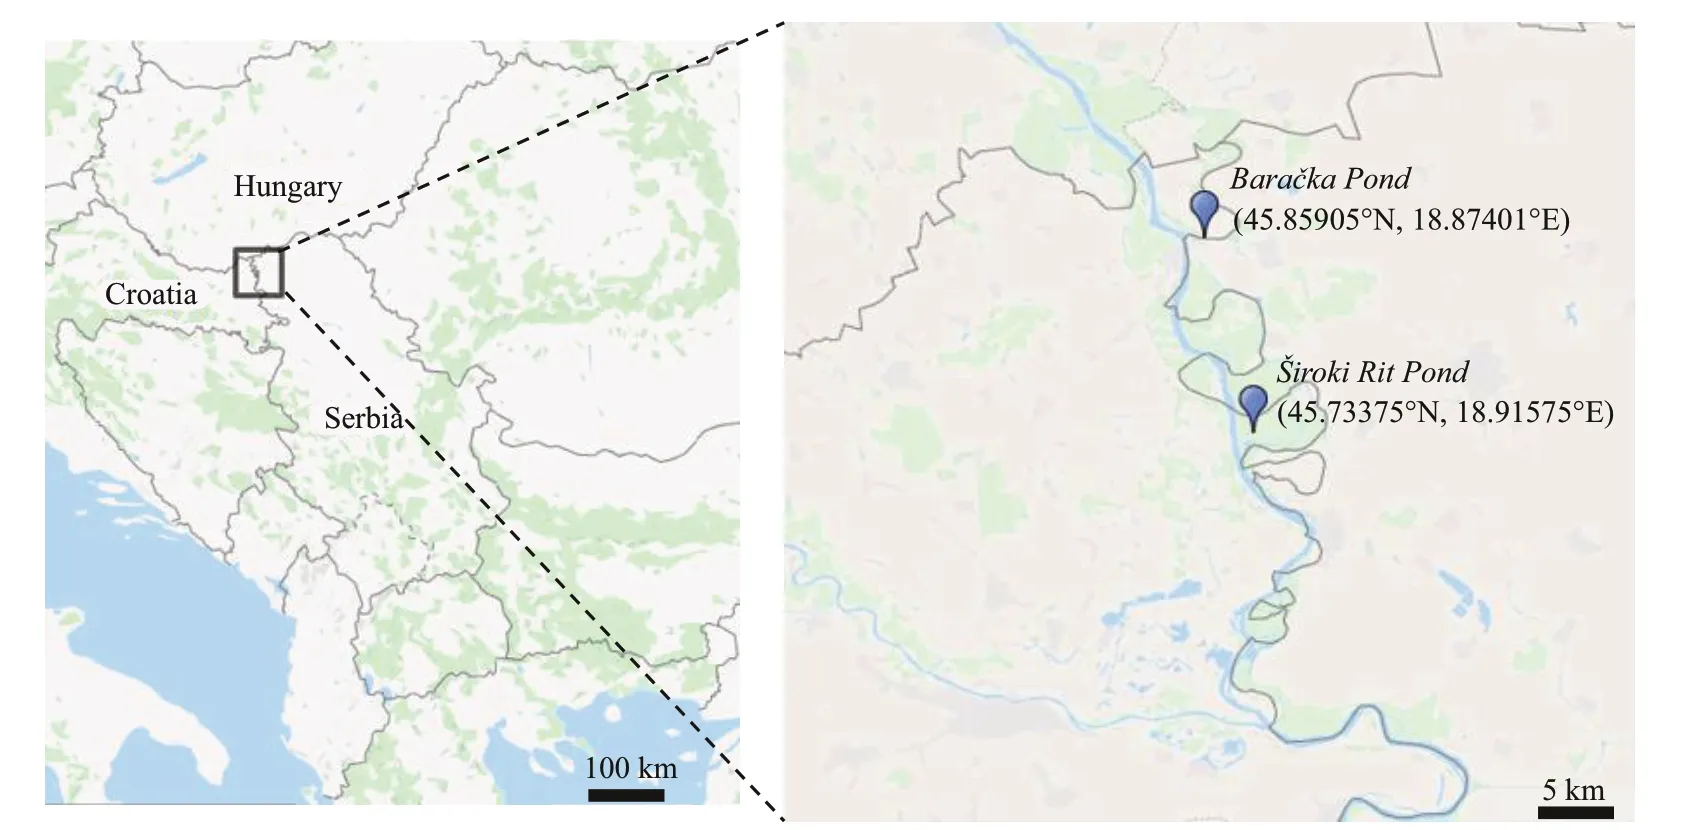
Fig.1 Location of experimental ponds in Special Nature Reserve ‘Gornje Podunavlje’
‘Gornje Podunavlje’ Reserve continues in ‘Kopački Rit’ Nature Park along the neighboring Croatian Danube bank, while in the north it borders with the Hungarian ‘Danube-Drava’ National Park creating together one of the largest swamp surfaces known as Europe’s Amazon. A complex mosaic of aquatic,swamp and terrestrial ecosystems with native and rare lowland forests represent habitats and sanctuaries for a very large number of species, including nationally or internationally threatened ones, define the Reserve as an area with exceptional natural values (Trbojević et al., 2019).
The first locality—Široki Rit is category II protected pond (IUCN and WCMC, 1994) revitalized in 2016, with permanently prohibited fishing. Due to its isolated position, there is reduced pressure of human activities on this aquatic ecosystem. The second one—Baračka, however, is a large pond located in the former part of Danube riverbed, known as significant recreational area famous for swimming,rowing, fishing, and ecotourism (Stojanović at al.,2014). Both ecosystems are connected with Danube by channels that feed them with river water—Široki Rit is supplied from the main Danube stream, and Baračka from the Danube bayou.
Although the Reserve is of great importance and proclaimed as a protected area at the national and international level (Ramsar Site, IBA (Important Bird Area), IPA (Important Plant Area), PBA (Prime Butterfly Area) and part of UNESCO Transboundary Biosphere Reserve Mura-Drava-Danube), it is also located in the area that has been strongly influenced by fishing, forestry, and particularly intensive agriculture activities (Stojanović and Savić, 2013).All of those leave visible traces including extensive use of pesticides and especially mineral fertilizers that are identified as a key factor of potential eutrophication of those ecosystems.
The investigation was conducted for five months(May–October 2018) with monthly sampling that started in June. During the investigation period, Široki Rit was completely dried out in August, so the subsequent sampling was not possible in this pond.
2 MATERIAL AND METHOD
2.1 Measurement of the physical and chemical water parameters
Water temperature, pH value, and water conductivity were measured with probes Eutech Instruments Oakton R7, and the concentration of dissolved oxygen and oxygen saturation in water samples were measured by YSI ProODO instrument.All of the aforementioned water parameters were measured in situ, once in the month. The depth of the investigated ponds was measured by Erchang portable depth sonar. Additional chemical parameters of the sampled water were analyzed by the Institute of Public Health of Belgrade, using standard methods(APHA, 1995) as follows: ammonium (NH4+)—ion chromatography method SRPS EN ISO 14911 (2009);nitrate (NO3ˉ), orthophosphate (OP) and nitrite (NO2ˉ)—ion chromatography method EPA 300.1; total nitrogen (TN)—oxidation method SRPS EN 12260(2008); total phosphorus (TP)—ammonium molybdate spectrometric method SRPS EN ISO 6878(2008) and total permanent hardness (°dH) by complexometric titration internal method P-V-22/A.

Fig.2 Artificial substrate carrier before exposure (a), after five months of exposure (b)
2.2 Sampling procedure
2.2.1 Periphyton: artificial substrate carrier and sampling program
For the periphyton sampling, an artificial substrate carrier was established in each pond. The carrier was constructed as a system of plexiglass substrata in the form of plates (12 cm×5 cm×0.3 cm) that were strung on the threaded rods made of chemically and biologically inert stainless steel (Fig.2). The distance between two plates in the carrier was 3 cm. Each of the five rods carrying the plates was bolted in the metal frame. Such construction was anchored with the attached iron weight, submerged 20 cm below the water surface and fixed to four empty water jars that prevented it from sinking.
Two types of periphyton samples were collected:continuously and monthly developed ones that diff ered in the exposure time. Each of the continuously developed samples (CS) was harvested after an exposure of 2, 3, 4, or 5 months, while monthly developed ones (MS) were harvested after one-month incubation with a start of exposure at diff erent time(in May, June, July, August, and September). The carrying rode renovation for MS was made each month during the investigation. Thus, e.g. CS harvested in August was exposed from the beginning of substrate carrier installation (May) until August (3 months incubated sample), but for MS sampled in August incubation started in July. The periphyton sample harvested in June is MS and CS at the same time. The CS are thought to contain a greater amount of accumulated phosphorus, while monthly developed ones are expected to give us an insight into the dynamics of this process that is also expected to be correlated with the changes of the algal component of this community.
Both CS and MS plates with the developed biofilm on it were carefully removed from the carrier and placed in the sterile plastic container using laboratory tweezers. The biofilm from both sides of the plate was peeled off using a stainless steel scraper and 100-mL distilled water. Such containers with the suspended periphyton material were transported to the laboratory in a mobile freezer, sheltered from the sunlight. In the laboratory the periphyton suspension was homogenized with a hand blender and divided into subsamples for the further analyses.
2.2.2 Plankton sampling
Plankton samples in Baračka were taken from a boat, in the immediate vicinity of the place where the substrate carrier was submerged. The samples for the qualitative analysis of phytoplankton were taken by phytoplankton net (diameter of mesh pore 22 μm) and the ones for quantitative analysis by submerging a bottle on depth of about 20 cm in the same water layer where the substrate carrier was set up. The phytoplankton samples for qualitative analyses in Široki Rit were taken in the same manner as above mentioned, while the ones for quantitative analyses were collected by telescoping sampling pole from the shoreline. The phytoplankton samples for both qualitative and quantitative analyses were preserved in Lugol’s solution (ratio 1:100) according to the European standard en 15204 (CEN, 2008).Additionally, plankton samples for chlorophylla(CHL), TP concentration, and dry weight (DW)estimation were collected in the same way as they were collected for quantitative analyses of phytoplankton.
2.2.3 Metaphyton sampling
According to Francoeur et al. (2013), a coring tube(10 cm in diameter) was used for the improvement of quantitative sampling of metaphyton. The tube was placed at the water surface to define the sampling area. Thereafter, metaphyton was cut along the outer edges of the tube with sharp scissors, while at the same time the tube was gently extended downwards all the way near to the bottom, not disturbing benthic community. The material (metaphyton) retained in the tube was stored in the plastic jar and transported to the laboratory.
2.3 Laboratory analyses of the observed communities
2.3.1 DW, CHL, and TP estimation
Periphyton and metaphyton samples were homogenized, divided into subsamples, and thus prepared for further laboratory analyses: DW, CHL,and TP concentration—the same ones that were employed on the plankton samples. All of the analyses were done by triplicates.
DW of all the investigated communities was determined according to standard methods for water and wastewater analyses (APHA, 1995). The known volume of each community subsample was filtered by filtration apparatus (Buchner flask, funnel, and vacuum pump), using a Fioroni Grade 263 0.7-μm glass fiber filters pre-ashed at 550 °C for organic matter removal. Such filters were transferred to a disposable aluminum weigh pan, dried in Binder EC 53 oven to a constant weight at 105 °C, cooled in a desiccator to room temperature and weighed.
Ash free dry weight (AFDW) was additionally measured only for periphyton samples (APHA,1995). After a DW has been obtained, the filters were transferred to pre-numbered and pre-ashed silica crucible and thereafter ashed at 550 °C for 4 h in a muffl e furnace. After cooling and measuring to the constant weight, the mineral content was determined based on the mass after ashing. The obtained values were used to determine the percentage of ash content, which further was employed to estimate the quantity of organic material present in the periphyton samples according to the Lakatos classification system (Lakatos, 1989).
All the three communities were analyzed for CHL and TP concentrations using spectrophotometric methods.
The estimation of CHL concentration was conducted according to Arar (1997) and Lanza et al.(2017). The known volume of each community subsample was filtered by filtration apparatus(Buchner flask, funnel and vacuum pump), using a Fioroni Grade 263 0.7-μm glass fiber filter. Such filters with the algal material were soaked and ground in the 90% acetone for maximum 24 h for the chlorophyll extraction. The filter slurry was centrifuged for 20 min at 3 000 r/min to clarify the solution. The absorbance of supernatant was measured at four wavelengths: 750, 664, 647, and 630 nm. The samples absorbance was also measured at 750 and 664 nm before and after acidification with 0.1 mol/L HCl to determine pheopigment-corrected CHL.Pheophytin-awas calculated using Lorenzen (1967)equation, while CHL concentration was calculated using Jeff rey and Humphrey (1975) equations.
To estimate the TP concentration present in the periphyton, plankton, and metaphyton, algal subsamples were filtered as previously described and thereafter dried at 65 °C for 24 h. Dried material was digested with nitric and sulphuric acid wet digestion method (Analytical Methods Committee, 1960) and boiled in the laboratory water bath to convert all phosphate forms to orthophosphate. After the samples cooled, the acid mixture of 0.05 mol/L HCl and 0.05 mol/L H2SO4was added to the mark and centrifuged for 10 min at 3 000 r/min. A 5% ammonium molybdate and 11% sodium sulfate solutions were added to such samples for the colored reaction together with 0.5% hydroquinone solution as a reduction agent. After about one hour standing in the dark for color production, the phosphate concentration was measured spectrophotometrically (Briggs, 1922),as a function of absorbance plotted against the previously prepared calibration curve.
Since both CHL and TP concentrations are expressed as milligram per milliliter of the filtered sample, the obtained values for periphyton were recalculated referring to the square meter of the substrate. For the purpose of comparison among communities, the aforementioned concentrations were finally expressed as milligram per gram of DW for each sample. Additionally, the rate of phosphorus net accumulation by periphyton was calculated as an amount of accumulated phosphorus (mg) per day.
The obtained values of CHL, TP, and TN from water column were employed to estimate Carlson’s Trophic State Index (TSI) that assesses the trophic status of the investigated ponds (Carlson, 1977).
2.3.2 Qualitative and quantitative analyses of algal component of the observed communities
Qualitative analysis of phytoplankton, algal component of periphyton, and metaphyton community structure was performed using Carl Zeiss AxioImager M.1 microscope equipped with digital camera AxioCam MRc5 and AxioVision 4.9.1 Software.Standard taxonomic literature was used for the particular taxa identification (Starmach, 1974, 1983,1985; Ettl, 1978; Huber-Pestalozzi et al., 1983;Popovský and Pfiester, 1990; Komárek and Anagnostidis, 1998, 2005; Lange-Bertalot et al.,2013; Komárek, 2013).
The Utermöhl’s method (1958) was applied for the quantitative assessment of algal component of all the three investigated communities. Hydro-Bios plankton chambers were used for the sedimentation of diff erent volume of samples, and the individuals and cell number were estimated using an inverted-microscope Leica DMIL. The obtained values were expressed as a number of algal cells per milliliter for plankton and metaphyton and number of algal cells per square centimeter for periphyton. Biovolume of each algal taxon was calculated by geometric approximation(Hillebrand et al., 1999). Phytoplankton and metaphyton biomasses were estimated and expressed in a certain volume of water, while the same parameter was expressed referring the surface area of substrate for periphyton. Also, the number of both algal cells and biomass (wet weight) were calculated per gram of DW for all the three communities in both ponds.
To determine the diversity, Shannon index(Shannon, 1948) was calculated based on algal composition for three investigated communities. In purpose of additional periphyton characterization,Autotrophic and Lakatos indices were estimated for this community (APHA, 1995; Lakatos, 1989).
2.4 Data analyses
2.4.1 Statistical analysis
Prior to analyses that included comparison among certain groups taking into account diff erent parameters, normal distribution of (Shapiro-Wilks test) and homogeneity of variance (Levene’s test)were evaluated. If data followed normal distribution and homogeneity of variance was met, Student’st-test or one-way analysis of variance (ANOVA) were performed, depending on the number of groups that were compared (Student’st-test was used for two groups, and one-way ANOVA for three or more groups). Together with one-way ANOVA, the pairwise comparison option that run Tukey’s Honestly Significant Diff erence (HSD) test was applied. If data were not normally distributed and non-homogeneity was observed, non-parametric tests were chosen.Mann Whitney U test was used for the comparison of two groups, while Kruskal-Wallis one-way analysis of variance was used for three or more groups,whereas Dunn’s multiple comparison test was performed, additionally. A threshold ofP<0.05 was applied for all tests. All of the aforementioned analyses were performed using Microsoft Excel and the statistical package XLSTAT (Addinsoft, 2020).
One-way analysis of variance (ANOVA) with Tukey’s HSD test was used to explore if significant diff erences in CHL concentration existed among communities (phytoplankton, periphyton CS, and periphyton MS) in Baračka.
Mann Whitney U test was used to observe were there significant diff erences between the localities Široki Rit and Baračka when phosphorus accumulation per surface of substrate (mg TP/m2) from both periphyton CS and MS was taken into account. The test was based on data from June and July, since Široki Rit dried out in August.
The rates of daily phosphorus accumulation (mg/(m2·d)) by periphyton CS and MS in Baračka were compared and the diff erences were observed using Student’st-test.
When daily phosphorus accumulation (mg/(m2·d))by both periphyton CS and MS was related to sampling months—sampling time (data from Baračka included), one-way analysis of variance (ANOVA)with Tukey’s HSD test as well as repeated measurements ANOVA were performed to determine if there were significant diff erences among sampling months, in other words, is there significant eff ect of sampling time on daily phosphorus accumulation.
The eff ect oflocalities Široki Rit and Baračka on number of cells/cm2from both periphyton CS and MS was explored using Mann Whitney U test. Since Široki Rit was dried out in August, the test was based only on data obtained in June and July.
The diff erences among communities(phytoplankton, periphyton CS, and periphyton MS)were observed in relation to cell number per gram of DW for Široki Rit and Baračka separately. Kruskal-Wallis one-way analysis of variance with Dunn’s procedure was applied in both cases.
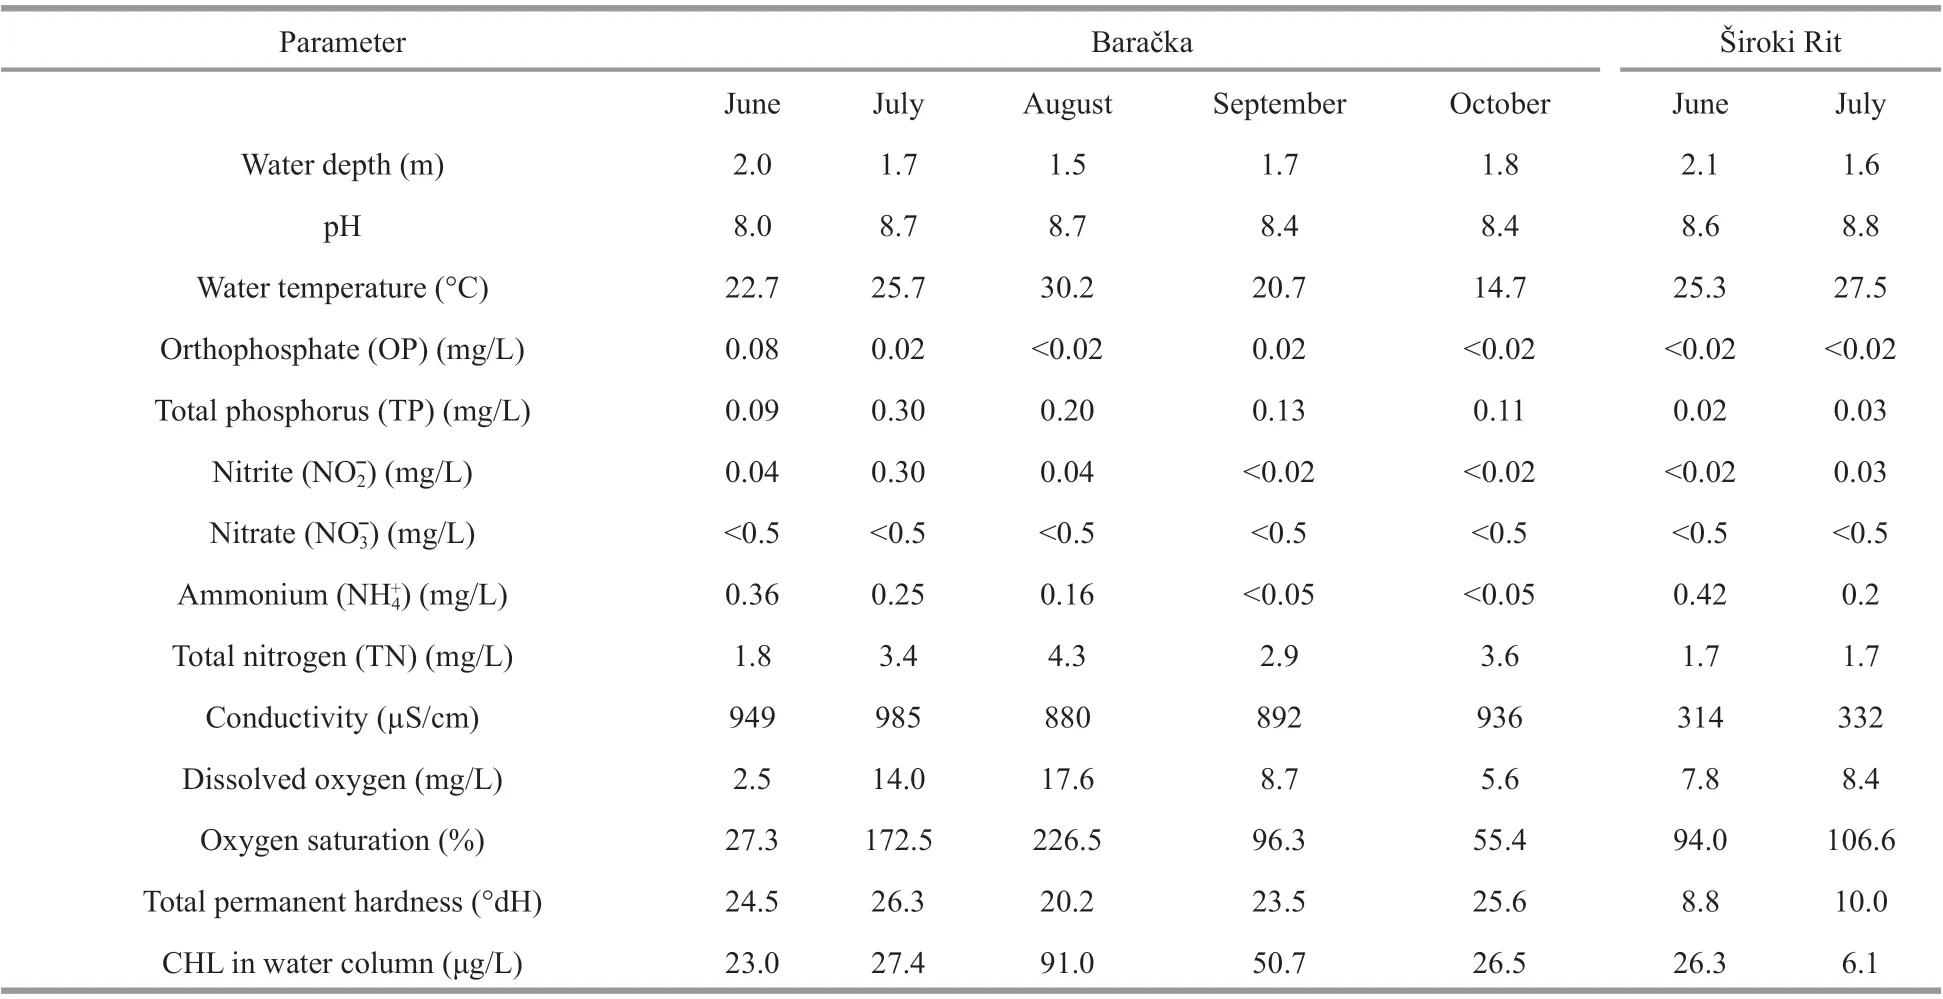
Table 1 The results of physical, chemical and biological measurements in both investigated ponds
The diff erence between communities(phytoplankton, periphyton CS and periphyton MS)in Baračka was assessed when the amount of accumulated phosphorus per gram of DW ((m(TP)/m(DW), mg/g)) was considered. Kruskal-Wallis oneway analysis of variance with Dunn's procedure was used.
2.4.2 Multivariate analysis
Canoco 5 software package (Ter Braak and Šmilauer, 2012) was used for statistical analyses. Two principal component analyses (PCA) were performed.
First PCA was used to illustrate the relationship between response variables—TP content in plankton,metaphyton and periphyton (MS and CS) and supplementary variables—nutrients (NH4+, NO2ˉ, TN,OP, TP) in the water column, sampling location(Baračka and Široki Rit) and sampling months. Linear method was used, since the gradient was 1.5 SD units long. As an addition, the correlation between response variables was observed using Pearson’s correlation coeffi cient.
The relationship between the content of TP in periphyton (MS and CS) and states of autotrophic index for both series ofincubation was also demonstrated using PCA, since the gradient was 0.7 SD units long. States of autotrophic index used in the analysis were dominantly autotrophic (DA),prevailing autotrophic (PA), autotrophic heterotrophic(AH), prevailing heterotrophic (PH), and dominantly heterotrophic (DH) community.
3 RESULT
3.1 Physical, chemical and biochemical water parameter s
The two investigated ponds partially diff ered in their physical, chemical, and biochemical parameters(Table 1). The depth measurements during the investigation period characterized both ponds as shallow ecosystems with maximal depth in the range from 1.5 to 2.1 m (Table 1). Well-established riparian vegetation with a dense cover of both submerged and emerged macrophytes characterized both localities,particularly Baračka where more than 60% coverage of the water surface by floating species (dominated byNupharlutea(L.) Sm.) was recorded in some months.TP concentration in the water column was slightly above 0.02 mg/L in Široki Rit and higher in Baračka reaching about 0.30 mg/L during the investigation period (Table 1). At the same time, OP in both ponds was low, in the range from 0.01 to 0.02 mg/L, with the exception of June in Baračka when the value of 0.08 mg/L was recorded. Water temperature of the observed ecosystems ranged within the interval of 14.7 to 30.2 °C (Table 1). Oxygen saturation in the same period was high in both ecosystems, mostly above 90%, even supersaturation was recorded in July and August in Baračka (Table 1). Phytoplankton CHL concentration in the water column of Baračka ranged from 23.0 μg/L in June to maximal 91.0 μg/L in August, while in Široki Rit was 26.3 μg/L and 6.1 μg/L in June and July, respectively (Table 1).
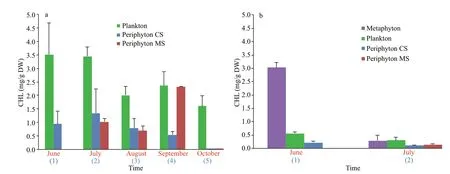
Fig.3 Concentration of CHL in diff erent communities in Baračka (a) Široki Rit (b)
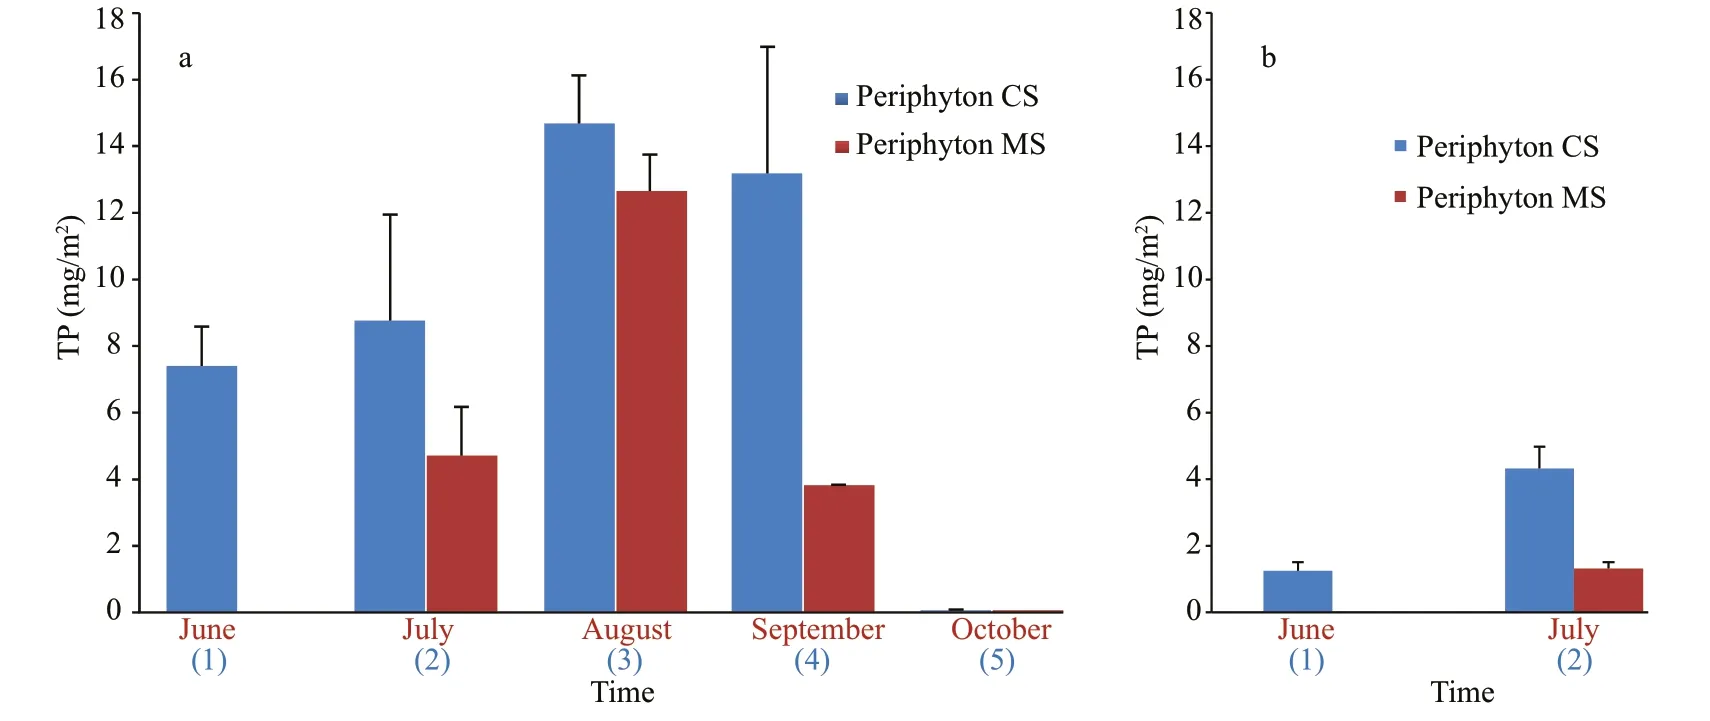
Fig.4 TP concentration in periphyton exposed for one month (MS) and from May onwards (CS) in Baračka (a) and Široki Rit (b)
3.2 Comparison of CHL and phosphorus concentration among the investigated communities
The estimation of CHL concentrations that has been expressed in mg/g DW (in purpose of comparison among diff erent communities), showed that the plankton contains the highest amount of CHL per gram of DW in almost all months at both localities.The only exception was recorded in Široki Rit in June when the concentration of CHL reached the maximum values in the metaphyton sample (Fig.3). One-way ANOVA (P=0.003) revealed that there is significant diff erence among phytoplankton, periphyton CS, and MS when CHL was considered. Tukey’s HSD test showed that significant diff erences were also observed between phytoplankton and periphyton CS (P=0.004),as well as phytoplankton and periphyton MS(P=0.018), implying that phytoplankton can be distinguished from other two communities and have significant eff ect on CHL in Baračka.
Maximum TP concentration in periphyton of Baračka reached 14.7 mg/m2after three-month exposure. The CS exposed for four months accumulated slightly less, but also a considerable amount (13.2 mg/m2), while these values did not increase further after five-month exposure. The amount of accumulated phosphorus in MS of Baračka was lower in comparison with CS, in general, but the sample exposed from July to August reached the noticeable maximum of 12.7 mg/m2(Fig.4).
The accumulated phosphorus by periphyton in both CS and MS of Široki Rit was very low in comparison to the same parameter in Baračka (Fig.4).Considering this parameter (June and July only), the significant diff erence between these two ponds(P=0.028) was confirmed by Mann Whitney U test.

Fig.5 The rate of daily phosphorus accumulation from the water column by both CS and MS periphyton in two investigated ponds
When the effi ciency of phosphorus accumulation by both CS and MS was expressed as the rate ofits daily accumulation, this value occurred to be generally higher in the case of the MS in our ponds with a maximum of 0.36 mg/(m2·d) reached in the August sample of MS in Baračka (Fig.5). Student’st-test showed no significant diff erences (P>0.05) between those rates in two types of periphyton incubation.Otherwise, the results of one-way ANOVA revealed that there was eff ect of sampling time (sampling months) on daily phosphorus accumulation (mg/(m2·d)) by both CS and MS (in Baračka) (P=0.049).Tukey’s HSD test revealed that significant diff erence exists between August and October sampling(P=0.028). The eff ect of time was also confirmed by repeated measurement ANOVA, showing the significance for the aforementioned months.
Further, the plankton community in Baračka expressed the highest ability in phosphorus accumulation (per gram of DW) from the water column in comparison with periphyton during the all investigation period (Fig.6a). When the same comparison among the communities was done in Široki Rit (additionally characterized by the presence of metaphyton), it was shown that metaphyton and periphyton were more eff ective in phosphorus accumulation than plankton (Fig.6b). Kruskal-Wallis one-way analysis of variance revealed existing diff erences among communities in Baračka when phosphorus accumulation per gram of DW was used as quantitative variable (P=0.007). Dunn’s procedure showed significant diff erence between phytoplankton and periphyton CS (P=0.007) as well as phytoplankton and periphyton MS (P=0.006), whilePvalue for combination periphyton CS and MS was above 0.05.The results obtained from statistical analyses implied that phytoplankton distinguish from the other two communities having significant eff ect on phosphorus accumulation per gram of DW in Baračka.
Based on TSI (Fig.7) calculated using TP, TN, and CHL in water column (Table 1), Široki Rit is defined as a mesotrophic to eutrophic freshwater pond, and Baračka as a eutrophic to hypereutrophic ecosystem according to the classifications given in Carlson(1977).
3.3 Qualitative and quantitative analyses of algal component in investigated communities
The qualitative analysis of algal component of periphyton revealed that the CS of both ponds was characterized by higher diversity in comparison with MS. Maximal of 77 recorded algal taxa was detected in Baračka, while in Široki Rit it was 55. The phytoplankton, however, showed even higher diversity with 152 identified taxa in Baračka and 74 in Široki Rit that could be classified into eight phyla(Cyanobacteria, Bacillariophyta, Chlorophyta,Chrysophyta, Cryptophyta, Dinophyta, Euglenophyta,and Xanthophyta), according to Reynolds (2006).The lowest diversity of 41 algal species among all observed communities was detected in metaphyton developed only in Široki Rit.
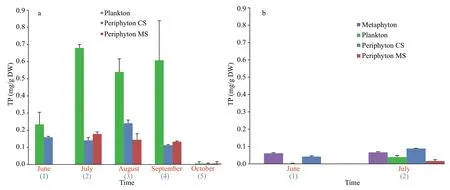
Fig.6 The amount of TP stored in diff erent communities in Baračka (a) and Široki Rit (b)
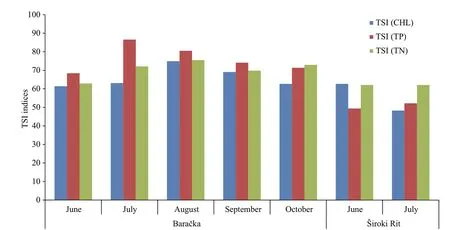
Fig.7 TSI indices calculated for the estimation of ecosystem trophy according Carlson (1977)
The quantitative analyses of algal component of the investigated communities; however, showed that larger cell abundance of periphyton calculated per surface of substrate was recorded in Baračka for both CS and MS with maximal values of 417.1×10⁴cells/cm2in CS and 261.7×10⁴cells/cm2in MS harvested in August and July, respectively (Table 2). In contrast to Baračka, the cell abundance in Široki Rit was drastically lower (up to 198 times ) and ranged from minimal 2.1×10⁴cells/cm2in July to 5.9×10⁴cells/cm2in June in CS, while the same value in MS harvested in July was almost similar to the one from June with 5.7×10⁴cells/cm2(Table 2). Statistical significance between those two ponds considering periphyton cell number per surface of substrate was also confirmed by Mann Whitney U test (P=0.028).Concerning phytoplankton, cell abundance in Široki Rit ranged from 0.2×10⁴cells/mL to 1.2×10⁴cells/mL in June and July, respectively, while in Baračka cell abundance ranged from 2.8×10⁴cells/mL in June to maximal 57.2×10⁴cells/mL in August (Table 2). The metaphyton cell abundance of 28.5×10⁴cells/mL and 16.9×10⁴cells/mL were recorded in June and July(Table 2), respectively.
Higher values of algal biomass in periphyton were obtained from Široki Rit CS in June and July with 8.5 mg/cm2and 10.6 mg/cm2, respectively (Table 2).Considerable value of the same parameter in periphyton of Baračka was noticed only in June when it reached 6.0 mg/cm2, while other values were very low (Table 2). Phytoplankton biomass in Široki Rit,however, ranged from 0.9 mg/L in July to 4.1 mg/L in June, while the same range in the Baračka was wider,from 4.3 mg/L in October to maximal 52.3 mg/L in August (Table 2). Despite the lowest diversity,metaphyton in Široki Rit was abundant with the high values of biomass with 35.7×10⁴mg/L and 35.1×10⁴mg/L in June and July, respectively.

Table 2 Algal cell number and biomass of the investigated communities

Table 3 The algal cell number (CN) and algal biomass (AB), both calculated per gram of DW in diff erent communities of investigated ponds
When the algal cell number in diff erent communities of both ponds was calculated per gram of DW, the obtained values for plankton in Baračka significantly overcame the values obtained for other communities in this pond (Table 3). Such a statement was confirmed by Kruskal-Wallis one-way analysis of variance that revealed significant diff erences among phytoplankton,periphyton CS and MS in Baračka considering this parameter (P=0.009). In addition, Dunn’s procedure also showed that significant diff erence exists between phytoplankton and periphyton CS (P=0.005) as well as phytoplankton and periphyton MS (P=0.001 2),whilePvalue for combination of periphyton CS and MS was not statistically significant (P>0.05). In Široki Rit, however, despite the slight tendency of the plankton to dominate over metaphyton and particularly periphyton in the cell number, the employment of Kruskal-Wallis one-way analysis of variance revealed no significant diff erence among those communities.
Also, algal biomass referred as mg of wet algal weight per gram of community DW confirmed phytoplankton most abundantly developed per gram of plankton DW in Baračka, with the highest values of this parameter in comparison with the algal biomass of other communities in this pond. Contrary, the same calculation in Široki Rit defined the phytoplankton biomass in this pond as very low, even the lowest compared to the other communities algal biomass.The highest values of algal biomass per gram of community DW were obtained for metaphyton in Široki Rit (Table 3).
Autotrophic component in periphyton was dominated by Bacillariophyta with a low share of Cyanobacteria and Chlorophyta in total biomass through the whole investigation period in both CS and MS in Baračka, with the exception of June in CS and September in MS when Chlorophyta dominated in total estimated biomass. In the periphyton community of Široki Rit, Chlorophyta dominated in both CS and MS during the whole period ofinvestigation.
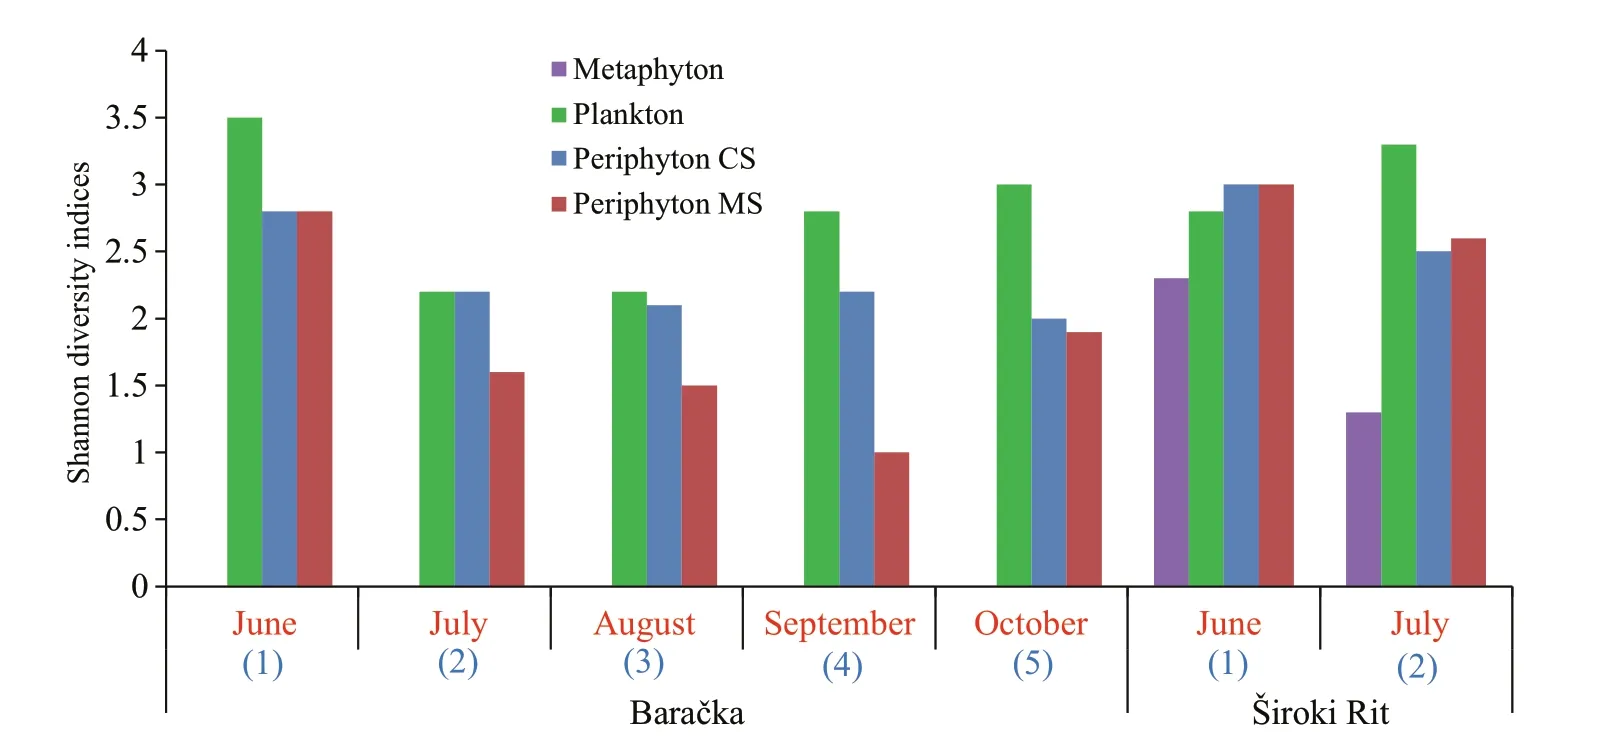
Fig.8 Shannon diversity indices of each community

Table 4 Percentage of ash content in periphyton and its characterization based on the results of Lakatos and autotrophic indices
Phytoplankton community of Baračka, however,was dominated by trichal Cyanobacteria in total algal biomass during the almost whole investigated period,while in Široki Rit codomination oflarge forms of euglenoids (Euglenaspp.,Phacusspp.,Trachelomonasspp.) and dinoflagellates (Peridiniumsp.) in June was replaced with the domination of cenobial (Pediastrumspp.,Scenedesmusspp.) and single-celled green algae(Monoraphidiumspp.,Tetraedronspp.,Closteriumspp.) in July. The most uniform community in the biomass composition, after all, was metaphyton with more than 99% of algal biomass that belonged to filamentous Chlorophyta (Mougeotiaspp.).
The obtained values of Shannon diversity index calculated for all of the three communities are presented in Fig.8.
Lakatos indices characterized CS in Baračka as abundantly developed with a high biomass during the almost all investigation period (Table 4). High biomass was characteristic for the most of the monthly developed periphyton with the exception of July and September when it was medium (Table 4). In the Široki Rit, only the CS in July had high biomass,while medium biomass was characteristic for periphyton in other months (Table 4).
Considering the ash content in all of the periphyton samples was above 75% of the DW, those communities could be described as inorganic, according to Lakatos(1989) (Table 4). Autotrophic indices additionally characterized the CS in Baračka as dominantly autotrophic after the one-month exposure (APHA,1995). In the following months, expansion of the heterotrophic component became dominant in the periphyton until the end of experiment (Table 4).
3.4 Principal component analysis
The results of principal component analysis reveal that phosphorus content in plankton (TPplank) and both MS and CS periphyton (TPperiMS and TPperiCS, respectively) are oriented toward the right side of the ordination diagram having their higher values in September, August, and July in Baračka,compared to phosphorus content in metaphyton(TPmeta) that was determined only in Široki Rit(Fig.9). Considering the relationship among response variables, it was observed that TPplank was positively related to TPperiMS better than to TPperiCS.Correlation between these response variables detected using Pearson’s correlation coeffi cient. The value of correlation coeffi cient (R) considering TPplank and TPperiMS was 0.853, while for TPplank and TPperiCS was 0.693. Positive correlation between TPplank and TPperiMS was statistically significant,P=0.015. When nutrients were taken into consideration, TPplank and TPperiMS show positive correlation with TN, TP, and NO2ˉ in the water column and TPperiCS with the same variables, but also with OP (Fig.9). It is also worth mentioning that TP has the highest positive correlation with the first PCA axis(R=0.837 2).

Fig.9 PCA showing the relationship among TP content in plankton (TPplank), metaphyton (TPmeta), MS and CS periphyton (TPperiMS, TPperiCS), nutrients(NH 4 +, NO 2 ˉ, TN, OP, TP) in water column, location(Baračka and Široki Rit) and sampling months
The relationship of TP amount in both MS and CS periphyton and states of autotrophic index is represented in Fig.10. Phosphorus content from both MS and CS periphyton were negatively correlated to DH, while slightly better correlation was observed with DA. The positive correlation was observed with AH, PH, and PA states, with AH showing the highest positive correlation to both TPperiMS and TPperiCS(Fig.10).
4 DISCUSSION
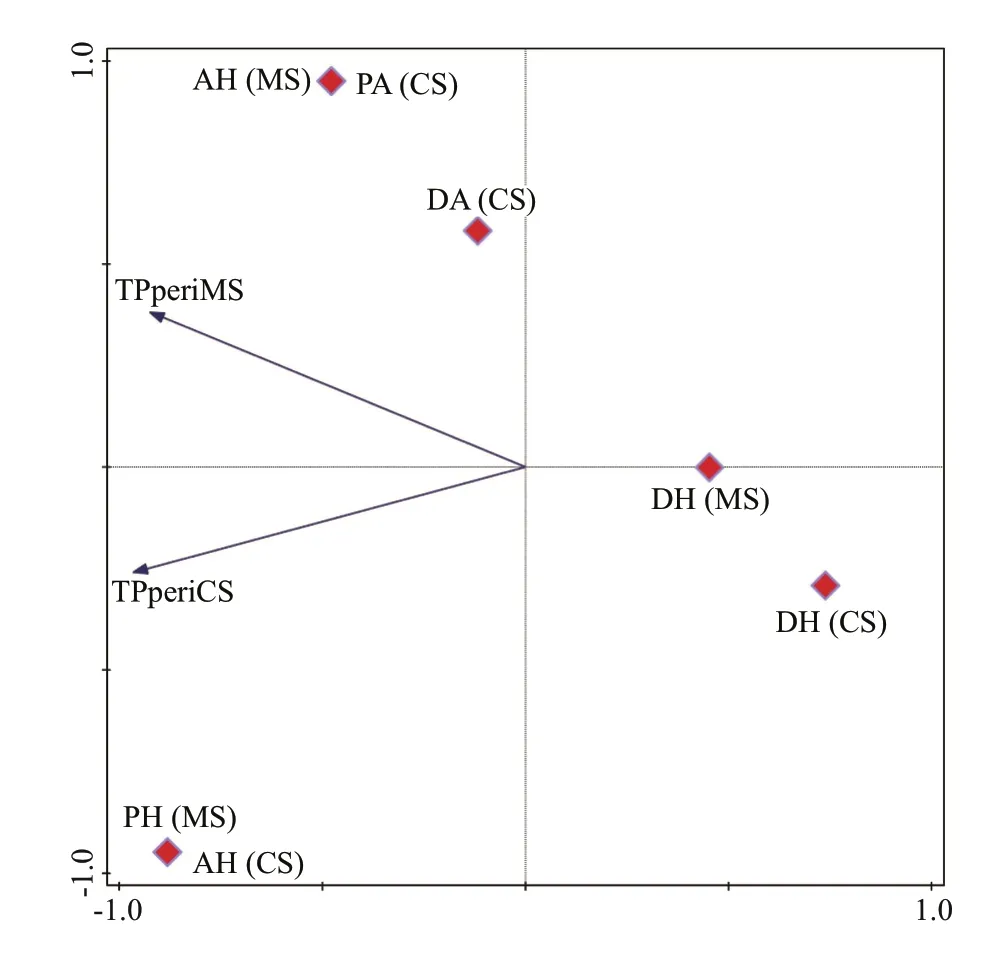
Fig.10 PCA showing the relationship between the content of TP in periphyton (MS and CS) and autotrophic states for both series ofincubation (dominantly autotrophic(DA), prevailing autotrophic (PA), autotrophic/heterotrophic (AH), prevailing heterotrophic (PH)and dominantly heterotrophic (DH))
Plenty of factors play a significant role in the phosphorus accumulation by diff erent aquatic communities (Panswad et al., 2003; Matheson et al.,2012; Kesaano and Sims, 2014). To explain the diff erence in the nutrient accumulation among the algal species, Dodds (2003) indicated high algal surface-area-to-volume ratio as the crucial factor and implied filamentous algae more eff ective than prostrate gelatinous forms. However, Cardinale(2011) reported that communities with higher diversity take greater advantage of the niche opportunities in an environment, resulting in accumulating biologically available resources to a greater extent. Also, Cao et al. (2014) found that the periphyton capacity for nutrient accumulation from the water column is less related to the surface-area-tovolume ratio and more strongly to biodiversity. The later findings support results obtained from Baračka:the highest values of Shannon diversity index among the investigated communities were recorded for the plankton all months (Fig.8), which exhibited the highest ability for phosphorus accumulation per gram of DW at the same time (Fig.6a). However, considering the qualitative structure of algal component among communities, it could be also noticed that those characterized as ‘most eff ective’ in phosphorus accumulation (per gram of DW), such as plankton in Baračka and metaphyton in Široki Rit were predominantly assembled of trichal individuals composed of small-size cells. On the other hand, ‘less eff ective’ ones such as CS and MS periphyton were generally dominated by large diatoms with gelatinous coating (in the form of envelopes, pads, stalks or tubes), which is in accordance with Dodds (2003).
Smaller cells in size were, further, found to have a faster phosphorus accumulation rate per μm3biomass than larger cells (Friebele et al., 1978). That also could explain that phytoplankton of Baračka with high algal cell number and biomass composed mainly of small unicellular and trichal individuals composed of small-size cells overcame the periphyton dominated by large diatoms in phosphorus accumulation.Although metaphyton in Široki Rit was characterized by even greater algal biomass than phytoplankton in Baračka, a small number of very large Chlorophyta cells that dominated in this community caused that metaphyton accumulated far less amount of phosphorus in comparison with plankton in Baračka.Otherwise, phytoplankton in Široki Rit was taken from the lately revitalized part of the pond. Dredging the pond basin to remove large loads of the organic matter and mud caused increased the amount of dispersed sediment (loess) particles and water turbidity that resulted in the sparse phytoplankton with a reduced number of taxa and low biomass(Table 2). Such a poor developed community adapted to the unstable new-formed habitat was less competitive for metaphyton and periphyton that contained greater amounts of TP per gram of DW in Široki Rit, but still lower than the communities in Baračka.
Concerning the diff erence in phosphorus accumulation among the communities, it is noteworthy that the characteristics of the autotrophic component could also off er the possible explanation for the supremacy of plankton in phosphorus accumulation(per gram of DW) among the other communities in Baračka. Well established autotrophic component in plankton reflected in the highest concentration of CHL, algal cell number and wet weight (all calculated per gram of DW) compared with the same values obtained for periphyton, suggest this community to be competitive for nutrients in a greater extent than abundantly developed but at the same time dominantly inorganic CS and MS periphyton with high values of ash content (Table 4). This further implies that the share of the autotrophic organisms capable of phosphorus catchment in periphyton is reduced in the gram of DW in comparison with phytoplankton. Such a periphyton inorganic 'architecture' could be more powerful reason of the relatively small amount of accumulated phosphorus with maximal 14.7 mg TP/m2than low concentration in the water, since even lower values of this parameter were measured in the similar investigations that achieved much higher periphyton effi ciency in phosphorus accumulation. For instance,Jöbgen et al. (2004) reported the phosphorus accumulation by periphyton of up to 100 mg TP/m2in the mesotrophic to slightly eutrophic lake with the TP epilimnion concentration of mostly below 0.02 mg/L and hypolimnion of more than 0.1 mg/L during the two-year survey. Périllon et al. (2017), further,recorded the periphyton effi ciency that reached up to 35 mg TP/m2in the oligotrophic to weakly mesotrophic lake with TP values from 0.01 to 0.014 mg/L.Concerning periphyton ‘architecture’, further,dominantly heterotrophic periphyton state occurred negatively correlated with the phosphorus content in both CS and MS. Unlike expected, although dominantly autotrophic state was correlated better than dominantly heterotrophic one, the highest positive correlation was observed between phosphorus content (in both CS and MS) and autotrophic/heterotrophic periphyton state.
Regarding the effi ciency of communities in Široki Rit, although the statistical analyses showed there was no significant diff erence in phosphorus accumulation among the investigated communities in this pond, stable and notable amounts of accumulated phosphorus in metaphyton (Fig.6b), could suggest its potential in phosphorus harvesting. Bearing in mind unstable conditions caused by recent revitalization and particularly limited scope ofinvestigation reflected in a small number of samples due to pond desiccation, previous statement needs much more research.
Although our results showed that dominantly inorganic periphyton can remove low amount of phosphorus from the water column, this method has been considered as primarily environmental benign and sustainable (Wu et al., 2014). If nevertheless chosen as a non-harmful supplementary activity against the pond eutrophication, large-scale employment of the monthly developed periphyton (in the months when highest phosphorus removal was recorded) in our ponds would be more advisable for several reasons.
One-month exposed periphyton in Baračka (July–August) exhibited the eff ectiveness in phosphorus removal (12.7 mg/m2) similar to the maximal one(14.7 mg/m2) achieved in the three-month continuously exposed samples (Fig.4). Although achieved rates of phosphorus accumulation per day in Baračka were generally higher in MS in comparison with the same rates in CS (Fig.5), such a diff erence was not confirmed by statistical analyses, and could also be the result of net phosphorus accumulation estimation where grazing losses (probably larger in CS) were not taken into consideration. On the other hand, the advantage in MS periphyton employment was shown by multivariate analysis which revealed that phosphorus accumulation in MS showed the closest correlation with the same (maximal)accumulation achieved by plankton (Fig.9). Such a recommendation is additionally supported by findings of McCormick et al. (2006), Cao et al. (2014) and Pei et al. (2015) that considered periphyton as a shortterm sink for phosphorus. Without mechanical harvesting (or grazing), periphyton communities exposed for a longer time may senesce and slough off ,returning nutrients to the water (Jacoby, 1987;Mulholland et al., 1991). Since there is only one MS in Široki Rit, such a comparison between MS and CS is not adequate. Since there is no statistical significance in rates of daily phosphorus accumulation between MS and CS, the employment of one-month exposed periphyton samples in the large-scale extent would bring the reduced risk of unpredictable change of environmental conditions due to extensive introduction of new-formed community in ecosystem such as water chemistry, hydraulic conditions, habitat availability, food web dynamics as well as the influence of existing biocoenosis (especially phytoplankton) reported by Jöbgen et al. (2004) and Larned (2010). Such an introduction of periphyton component in the pond would finally reduce phytoplankton competitiveness by entrapping part of available phosphorus. Partial and continuous harvesting ofintroduced periphyton after a shorter exposure time during the certain period would lead to the gradual reducing of the pond trophy, avoiding the drastic ecosystem changes by reducing large amount of this nutrient at once.
When the effi ciency of potential large-scale phosphorus removal by MS was illustrated in Baračka,not encouraging results were obtained. For example,if 25 000 m2of substrate under the periphyton coverage with maximal accumulation rate (from July to August) would be installed, the established construction would harvest only 316.5 g of TP.Considering the calculated approximate volume of water in the pond, the harvested amount of phosphorus would present only 0.7% of soluble phosphorus content in the whole pond. Compared to the findings of Jöbgen et al. (2004) who reported the removal of even 1.9 kg TP (16.7% of whole-lake TP) in a mesoeutrophic lake, our result suggests the same approach poorly eff ective in eutrophic ponds. Since both of our ponds were characterized by low TP concentrations in water column, similarly to the lakes where much higher periphyton effi ciency in phosphorus accumulation was reported (Jöbgen et al., 2004;Périllon et al., 2017), the possible explanation of such a diff erence could also lie in the number of developed communities competing for the phosphorus in these two types of ecosystems. The number of those is certainly greater in natural, stable and eutrophic ponds with the well-established macrophyte and riparian vegetation than in lakes that are characterized with a very few of them, particularly when it is about accumulations and artificial ones. Consequently, a large number of communities employ diff erent strategies to compete for the certain (limited) amount of available phosphorus from the water column,reducing its amount for the other ones at the same time. Concretely, the stable and dense population ofN. luteacovering the greatest part of the water surface in Baračka and containing 3–4.67 mg P/g DW (Ho,1979) according to literature data, could be considered as a major and probably most eff ective competitor for nutrients compared with other autotrophic communities in this pond. Similar conclusion about the relation between periphyton and submerged macrophyteVallisnerianatans(Lour.) dominating in shallow lake system was observed by Mei and Zhang(2015).
Great advantage in the employment of periphyton developed on artificial substrates in phosphorus removal, which makes it particularly ‘attractive’ for this purpose is the possibility of (easier) community manipulation. This means that artificial substrates for algal attachment could be installed anywhere in the ecosystem, as well as harvested periodically and removed together with the accumulated phosphorus at a particular time (Cao et al., 2014). This kind of applicability and possibility of manipulation could also be characteristic for potential metaphyton harvesting, but, unfortunately, not for the plankton that, according to our findings, was most successful among other communities in a competition for phosphorus. In the end, periphyton biomass harvested from the aff ected ecosystem could be further utilized in numerous ways. One of the particularly important purposes is soil fertilizing, as well as amelioration by algal biomass that have been previously reported by diff erent researchers (Metting et al., 1990; Metting,1996; Mulbry et al., 2005). Such a nutrient reusing in agriculture would ‘close the phosphorus circle’potentially reducing the excessive application of artificial fertilizers that occurred as a crucial reason for eutrophication of the aquatic ecosystems.
5 CONCLUSION
Although the excessive input of phosphorus is considered as the main cause of widespread eutrophication, this nutrient has been typically regarded as the limiting factor causing very intense competition, particularly in the pond ecosystems with well-established and numerous autotrophic communities. The results of our study elucidated that the phosphorus accumulation effi ciency from the water column by easy-to-harvest periphyton developed on artificial substrates was poor in the investigated ponds, with maximal accumulation in three-month exposed CS and MS, both harvested in August. Contrary, plankton showed higher effi ciency in phosphorus accumulation but is less easy to harvest.Taking into account all of the positive and negative eff ects, if phosphorus harvesting by periphyton is applied in ponds, large-scale approach with onemonth exposure during the summer months(particularly August) would bring the maximal benefit.
6 DATA AVAILABILITY STATEMENT
The datasets generated during and/or analyzed during the current study are available from the corresponding author on reasonable request.
7 ACKNOWLEDGMENT
The authors are grateful to PD Dr. Sabine Hilt for critical reading of the manuscript and constructive suggestions and comments. We gratefully acknowledge the employees of ‘Vojvodinašume’ who showed a warm welcome and spent time with us in the field. Many thanks to Mrs Ana Blagojević Ponjavić for technical support during the field and laboratory.We sincerely thank the anonymous reviewers for their careful reading of our manuscript and many insightful comments and suggestions.
杂志排行
Journal of Oceanology and Limnology的其它文章
- Steady increase in water clarity in Jiaozhou Bay in the Yellow Sea from 2000 to 2018: Observations from MODIS*
- Phylogenetic diversity and bioactivity of culturable deepsea-derived fungi from Okinawa Trough*
- Allelopathic eff ects of mixotrophic dinoflagellate Akashiwo sanguinea on co-occurring phytoplankton: the significance of nutritional ecology*
- Investigation of the decline of Ulva prolifera in the Subei Shoal and Qingdao based on physiological changes*
- Petroleum exploitation enriches the sulfonamide resistance gene sul2 in off shore sediments
- Mesoscale wind stress-SST coupling induced feedback to the ocean in the western coast of South America*
