Nitrate in the Changjiang diluted water: an isotopic evaluation on sources and reaction pathways*
2021-06-15ShanJIANGJieJINGuosenZHANGYanCHANGZhaoruZHANGMengZHOUXiaoluWANGJingZHANGYingWU
Shan JIANG, Jie JIN, Guosen ZHANG , Yan CHANG , Zhaoru ZHANG ,Meng ZHOU, Xiaolu WANG , Jing ZHANG,, Ying WU
1 State Key Laboratory of Estuarine and Coastal Research, East China Normal University, Shanghai 200062, China
2 School of Oceanography, Shanghai Jiao Tong University, Shanghai 200240, China
Abstract A cruise covering two transects in the Changjiang (Yangtze) estuary in July 2017 was conducted, aiming to explore the sources for riverine NO 3 ˉ and identify reactions involved in the NO 3 ˉ transformations along the transport of the Changjiang diluted water (CDW). In the river water, NO 3 ˉ was fundamentally contributed by chemical fertilizer leakage in the watershed according to isotope signals.Sewage discharge may also be significant on riverine NO 3 ˉ inventory, while the isotope signal was masked by nitrification. Together with the transport of the CDW, NO 3 ˉ production was observed in waters with low salinities (<20) and high turbidities. Nitrification resulted from the mineralization of riverine organic nitrogen; therefore, the high turbidity was linked to active production. In the outer plume, coupled with stratification, a significant decrease in NO 3 ˉ concentration was observed in the surface water. In parallel,enrichment in δ 15 N-NO 3 ˉ and δ 18 O-NO 3 ˉ was found, indicating biological consumption by phytoplankton.The diff erence in the stratification intensity between two transects led to variations in NO 3 ˉ concentrations and isotope compositions. In the benthic water, denitrification (sediment-water interface) and nitrification(bottom water) coexisted. Furthermore, accumulations of NH 4 + and dissolved organic nitrogen in the bottom water were observed, indicating that nitrification was constrained by oxidant (mainly dissolved oxygen)supplies.
Keyword: Changjiang diluted water (CDW); denitrification and nitrification; estuary; production and removal; stable isotope
1 INTRODUCTION
Nitrogen (N) is essential in the biosynthesis of DNA, protein, phospholipid, etc., with global storage of 2.2×10¹⁰Tg (Kuypers et al., 2018). Dissolved inorganic nitrogen (DIN) accounts for a small portion of total N inventory in the biosphere (Kuypers et al.,2018), but it is characterized by active cycling and transport. Biological and industrial nitrogen fixation introduces ca. 425 Tg N-DIN per year into the biosphere; while only 300 Tg N-DIN per year can be transformed to dinitrogen gas (Kuypers et al., 2018).Excessive DIN in terrestrial ecosystems, mainly nitrate (NO3ˉ), is transported by surface rivers into coastal oceans through estuaries (47.8 Tg N/a;Galloway et al., 2004). The enrichment ofland-borne NO3ˉ in coastal waters frequently triggers harmful algae blooms and subsequent hypoxia, causing significant economic losses (Justić et al., 2003).Therefore, evaluating the magnitude of riverine NO3ˉ fluxes and exploring the reaction pathways related with NO3ˉ concentration variations in estuaries have received great attention from coastal managers and researchers (Wong et al., 2014; Loken et al., 2016;Yan et al., 2017; Domangue and Mortazavi, 2018).
The Changjiang River, length of ca. 6 300 km,delivers 9.24×10¹¹m3/a river water to adjacent coastal oceans, ranking the fifth largest rivers on a global scale (Milliman and Farnsworth, 2011). In the 1980s,the Changjiang delivered ca. 6.0×10¹⁰mol NO3ˉ/a to the East China Sea and the Yellow Sea (Edmond et al., 1985). Afterwards, the NO3ˉ concentration in the Changjiang River water increased more than three folds, indicating a marked enhancement in riverborne NO3ˉ input. Land-use changes due to rapid urbanization, overuse of fertilizers and sewage discharge are deemed to be key contributors of riverine NO3ˉ (Dai et al., 2011). The Changjiang diluted water (CDW), consisting of the Changjiang River runoff and coastal saline water, could extend to more than 200-km distance from the river mouth and cover 104km2surface area (31‰ isohaline; Chang et al., 2014). A series of research projects have been launched to explore the spatial/temporal distribution of riverine NO3ˉ and reactions related to the concentration variation (Zhang, 1996; Yao et al.,2014; Yu et al., 2015; Liu et al., 2016; Yan et al.,2017). In the Changjiang estuary, nitrification,biological uptake, denitrification and anaerobic ammonium oxidation (Anammox) in the water column and/or benthic sediments have been determined (Song et al., 2013; Yan et al., 2017). These reaction pathways associated with NO3ˉ addition(nitrification) and removal (Anammox, denitrification,assimilation, etc.) fundamentally influence NO3ˉ concentration and the concentration-based impacts.Stable isotope compositions such as δ15N-NO3ˉ and δ18O-NO3ˉ are valuable for identifying reaction pathways of NO3ˉ. In estuaries, mineralization of pelagic organic matter and subsequent nitrification decreases both δ15N-NO3ˉ and δ18O-NO3ˉ. In contrast,biological consumption leads to an increase in δ15NNO3ˉ and δ18O-NO3ˉ. Theoretically, the ratio for the enhancement in δ15N-NO3ˉ and δ18O-NO3ˉ is 1:1(Granger et al., 2010). Denitrification in the water column could produce a similar enrichment in δ15NNO3ˉ and δ18O-NO3ˉ; while the enhancement in the isotope compositions caused by denitrification in the benthic sediment may not be observed if NO3ˉ is fully converted (Yan et al., 2017). Accordingly, the combination of NO3ˉ concentration and its stable isotope composition could improve our understanding of NO3ˉ production and removal in the CDW.
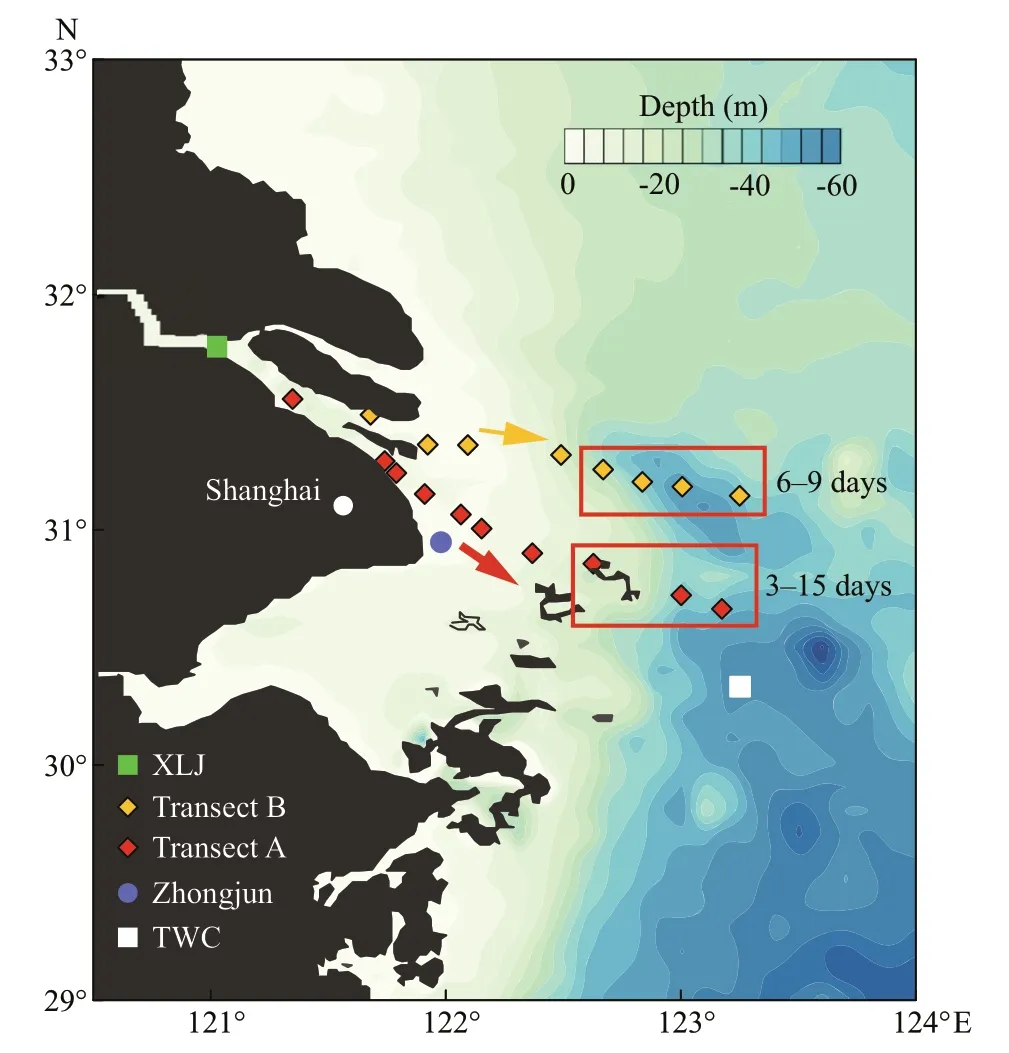
Fig.1 Sampling locations along two transects in the Changjiang estuary and Zhongjun station for the gauge of tidal amplitude
Environmental factors in the Changjiang estuary,such as salinity, total suspended matter (TSM), and dissolved oxygen (DO), are highly dynamic because of the co-variation of tidal amplitude and the Changjiang River discharge rate, as well as stratification (Zhang, 1996). In addition, there are several outlets for the Changjiang River runoff(Fig.1). Discharge rates, tidal amplitudes, and related water residence time among these outlets are significantly diff erent (Wu et al., 2010), which also deeply influences the related environmental parameters in the regions outside of these outlets.Biogeochemical reactions, including nitrification,denitrification, and assimilation are sensitive to the changes in these factors (Kuypers et al., 2018). Up-tonow, the published documents only revealed the variation of NO3ˉ concentration and its isotope compositions in surface water (Liu et al., 2009) or on a single transect (Yan et al., 2017) in the Changjiang estuary. However, studies on NO3ˉ distribution and reactions, as well as dynamic linkage between environmental factors and NO3ˉ production/removal based on a comparison between multiple transects with diff erent water depths are limited.
In the present study, a cruise (R/VZheyukeII) in the Changjiang estuary was conducted during summer 2017 when the Changjiang River discharge rate was high ((6–7)×104m3/s gauged at Datong Station; http://www.cjh.com.cn). The objectives of this study were(1) to identify NO3ˉ sources in the Changjiang River runoff prior to river-sea mixing; (2) to determine reactions with regard to NO3ˉ production and removal along the CDW pathway; and (3) to explore the relationship between the observed reaction pathways and environmental parameters, such as salinity, DO,and TSM in the estuary.
2 MATERIAL AND METHOD
2.1 Sample collection
The cruise in the Changjiang estuary was conducted on two transects (A and B) from 1stJuly to 8thJuly 2017, extending from river channels at the south branch (low salinity water) to the outer edge of the CDW as well as the Taiwan Warm Current (TWC)site (Fig.1). Besides, the river water at the Xuliujing(XLJ) site was obtained on 4thJuly 2017 (Fig.1). The tidal range gauged at the Zhongjun station (Fig.1)varied from 1.8 m on 4thJuly to 2.4 m on 8thJuly 2017. Transect A is the south outlet of Changjiang River runoff and adjacent to the deep-water channel,a channel for marine transport vessels. It has been surveyed in previous research projects related to NO3ˉ transport and transformation (Wang et al., 2017; Yan et al., 2017). Transect B extends from another outlet with relatively high discharge rate. It is separated with transect A by the Changxing Island and Hengsha Island. During the survey, phytoplankton bloom(dominant species,Skeletonemacostatum) was observed in the CDW outer plume on both transects (outlined in Fig.1). The water residence in these regions ranged from 3 to 15 days, estimated by drifters released in the river mouth at the beginning of the cruise.
Water samples during the cruise were collected from a CTD rosette sampler, equipped with 12-L Niskin bottles, a conductivity-temperature-depth(SBE 911, Sea-Bird Co.) unit and a fluorescence detector. In each site, 2–4 layers of the CDW, ranging from 3- to 53-m depth, were sampled. After collection,the measurement of DO concentration was immediately conducted using a detector (JENCO®,Model 9173). Approximately 1-L water was filtered through a polycarbonate membrane (pore size:0.4 μm, Whatman®) for the quantification of dissolved nitrogen content, δ15N-NO3ˉ and δ18O-NO3ˉ. The filtrate was stored at -20 ℃ until laboratory processing.Another fraction of water (0.3–3 L) was filtered by pre-combusted GF/F filter (average pore size: 0.7 μm,Whatman®). The solids retained on the filters were determined as the TSM concentration.
2.2 Laboratory analysis
Concentrations of DIN species (NH4+, NO2ˉ, and NO3ˉ) were determined on a flow injection analyzer(Skalar Analytical B.V., The Netherlands) using standard colorimetric procedures (Hansen and Koroleff , 1999). The method determination limit for these species was approximately 0.1 μmol/L. The analytical accuracy was approximately ±3%. The concentration of total dissolved nitrogen (TDN) was determined by the potassium peroxydisulfate (K2S2O7)digestion method with the determination limit of 0.2 μmol/L and method precession of ±3% (Ebina et al., 1983). The level of dissolved organic nitrogen(DON) was obtained as the diff erence between TDN and DIN concentrations. The δ15N-NO3ˉ and δ18O-NO3ˉ were determined by bacterial reduction method (NO3ˉ to N2O, usingPseudomonasaureofaciens, Sigman et al., 2001) following the procedure described by Weigand et al. (2016). NO2ˉ in samples was removed by the prepared sulfanilamide solution prior to bacterial reduction (Weigand et al., 2016). The generated N2O was purified and concentrated in a Finnigan Precon System (Thermo Fisher, USA).Subsequently, N2O and trace amount of CO2was separated by a chromatographic loop (GC Isolink;Thermo Fisher, USA). Afterwards, the δ15N and δ18O were analyzed in an isotope ratio mass spectrometer(Delta V; Thermo Fisher, USA). Measurements of δ15N were referenced to atmospheric N2and δ18O to Vienna Standard Mean Ocean Water (VSMOW) with standards of IAEA-NO-3, USGS-34, and USGS-35.The detection limit was approximately 1 μmol/L NO3ˉ with the analytical precession of 0.2‰ for δ15N-NO3ˉ and 0.4‰ for δ18O-NO3ˉ. The reproducibility of δ15NNO3ˉ and δ18O-NO3ˉ, based on long-run quality assurance tests, was ca. 0.22‰ and 0.51‰,respectively. The calibration of δ15N-NO3ˉ and δ18ONO3ˉ was done according to Casciotti and McIlvin(2007).
2.3 Data analysis
Apart from the Changjiang River runoff , the Changjiang estuary receives seawater from the Taiwan Warm Current that intrudes into the estuary along 50-m isobath and the Kuroshio Current from East China Sea surface (Zhu et al., 2004). Kuroshio waters are oligotrophic (Zhang et al., 2007) while the TWC waters contain regenerated nutrients.Consequently, a three-endmember mixing model was developed to estimate water sources in the CDW(identified by salinity and water temperature,Supplementary Fig.S1). Based on the identified water sources, calculation of the conservative distribution of NO3ˉ concentrations, isotopic compositions, as well as NH4+concentrations were conducted (more details in Yan et al., 2017). According to the diff erence in concentration or isotope compositions between the value derived from the model estimation and the observation, off sets for solute concentrations or isotope compositions were obtained. The positive off set for solute concentration indicates the production behavior, while a negative value is a mirror of removal. For isotope compositions, the positive reflects heavy isotope enrichment and vice versa. In the present study, the water parameters derived from the XLJ station (Fig.1), i.e. the upstream of both transects, were used to represent the Changjiang River water. For TWC water, the NO3ˉ concentration and related isotope compositions, as well as NH4+concentration were from the bottom of the southeast sampling site in the same cruise (Fig.1). For Kuroshio waters in the East China Sea, the NO3ˉ concentration was obtained from Wang et al. (2016) and NH4+concentration from Zhang et al. (2007). These values are outlined in Supplementary Table S1. Statistical analyses, such as regression and student’st-test, were carried out for the measurement of variables using Minitab 17.0 software (Minitab Inc., Pennsylvania State University). The significant level for all analyses was assumed to beα=0.05. The spatial distribution of parameters along each transect was plotted in Surfer 14.0 (Golden Software Inc., USA) and the dot plots were done in Sigmaplot 12.5 (Systat Software Inc.,USA).
3 RESULT
3.1 Water chemistry parameters
Salinities of the cruise samples ranged from 0.11 to 34.5 on transect A (Fig.2a). On transect B, a similar range (0.13–34.4) was observed (Fig.2b). The salinity increased from the surface to bottom water.Additionally, the salinity diff erence between the surface and bottom increased from the river mouth to the outer plume, reaching ca. 8 due to strong stratification. The temperature of the Changjiang River surface water was approximately 26 ℃ and decreased to 18.9 ℃ at bottom water in the CDW outer plume (Fig.2c). TSM concentration in the estuary water ranged from 9.0 to 75.6 mg/L. On transect A, TSM rapidly increased in the salinities of 5 to 10 regardless of seawater dilution. Afterwards,the TSM concentration sharply decreased, dropping to approximately 10 mg/L at the outermost site.Fluorescence intensities, an indicator of phytoplankton biomass, ranged from 0.34 to 12.8 μg/L in the estuary water. On both transects, fluorescence intensities were low when water salinities <20. In the outer plume, fluorescence intensities rapidly increased and the watercolor darkened due to enrichment of phytoplankton, while the bottom water was fluorescence deficient (Fig.2g–h). DO concentrations were ca. 6 mg/L at the inner sites (all depth). In the surface water, the DO concentration gradually increased and peaked at the sites with high fluorescence intensity. When water depth increased, the DO concentration in the saline CDW dropped (minimum 3.9 mg/L) (Fig.2i–j).
3.2 N species and isotopes
NO3ˉ was the major DIN species, and the concentrations of NO3ˉ at the starting site (in the river channel) on transect A was approximately 119 μmol/L(Fig.3a). Together with salinity increases, NO3ˉ decreased to ca. 5 μmol/L in the seawater surface(Fig.4a). On transect B, NO3ˉ concentrations were ca.108 μmol/L in river channels and dropped to 0.1 μmol/L in the outer plume (Fig.3b). At the starting site, NO3ˉ concentrations in the surface and bottom waters were similar. The vertical diff erence in the NO3ˉ concentration increased in the outer plume with enhanced stratification. In contrast to NO3ˉ, NH4+concentration in Changjiang River surface water was much lower (0.1–0.6 μmol/L). Concentrations of NH4+increased to a maximum of 6.3 μmol/L at the higher salinity water (Fig.3c–d).
For the distribution of NO2ˉ, its concentration on both transects was frequently below 1 μmol/L,indicating its instability (Fig.3e–f). The NO2ˉ concentration showed a peak near the river mouth on transect A (Fig.3e), while no significant enrichment was found on transect B (Fig.3f). The DON level varied between 5.5 and 42.6 μmol/L. In the Changjiang River runoff (salinity <2), DON concentration was<20 μmol/L (Fig.3g–h). In the surface water on transect A (3–5-m depth), an increase in DON concentration, followed with decreases, was found. A similar peak in DON concentration was observed at the bottom of saline water (Fig.3g). On transect B,three DON concentration peaks were identified,mainly occurred in the bottom water (10–40-m depth)(Fig.3h).
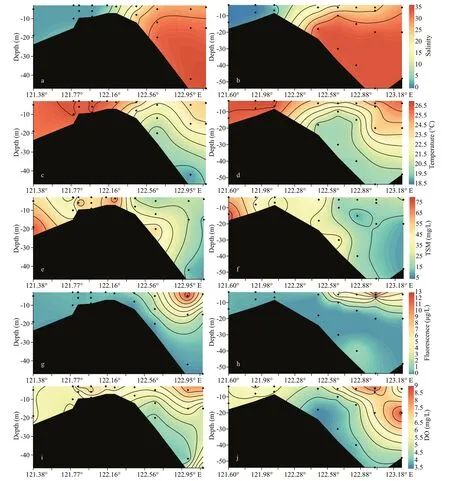
Fig.2 Profile of salinity (a & b), temperature (c & d), TSM (e & f), fluorescence (g & h), and DO (i & j) on both transects
Along transect A, δ15N-NO3ˉ ranged from 6.5‰ to 10.0‰ (Fig.5a). In the surface water, the elevation of δ15N-NO3ˉ along the salinity gradient from the river mouth to the off shore areas was observed (Fig.4a). In the outer plume of the CDW, δ15N-NO3ˉ decreased in the deeper water. The range of δ18O-NO3ˉ fell into-0.4‰ to 6.1‰ on transect A and displayed a similar trend along the salinity gradient as δ15N-NO3ˉ (Fig.5c).On transect B, δ15N-NO3ˉ in the Changjiang River runoff was 6.6‰. In the high salinity CDW, the surface water manifested a significant enrichment in heavy isotopes, reaching 17.4‰ for δ15N-NO3ˉ(Fig.5b). Nearly identical enrichment was found for δ18O-NO3ˉ, peaking at 14.7‰ (Fig.5d). Unlike the surface water, both isotope compositions decreased in the bottom layers from the estuary toward the ocean.On both transects, positive correlations between δ15N/δ18O-NO3ˉ and fluorescence intensity were observed(Fig.4c–d). For the correlation between isotope compositions and ln(NO3ˉ) (natural logarithm of NO3ˉ concentration), the surface and bottom water clearly separated into two clusters (Fig.4e–f), suggesting a stronger isotope fractionation in the surface water and regeneration in the bottom water. In addition, the slope oflinear regression based on the surface water samples was large on transect B (Fig.4f).
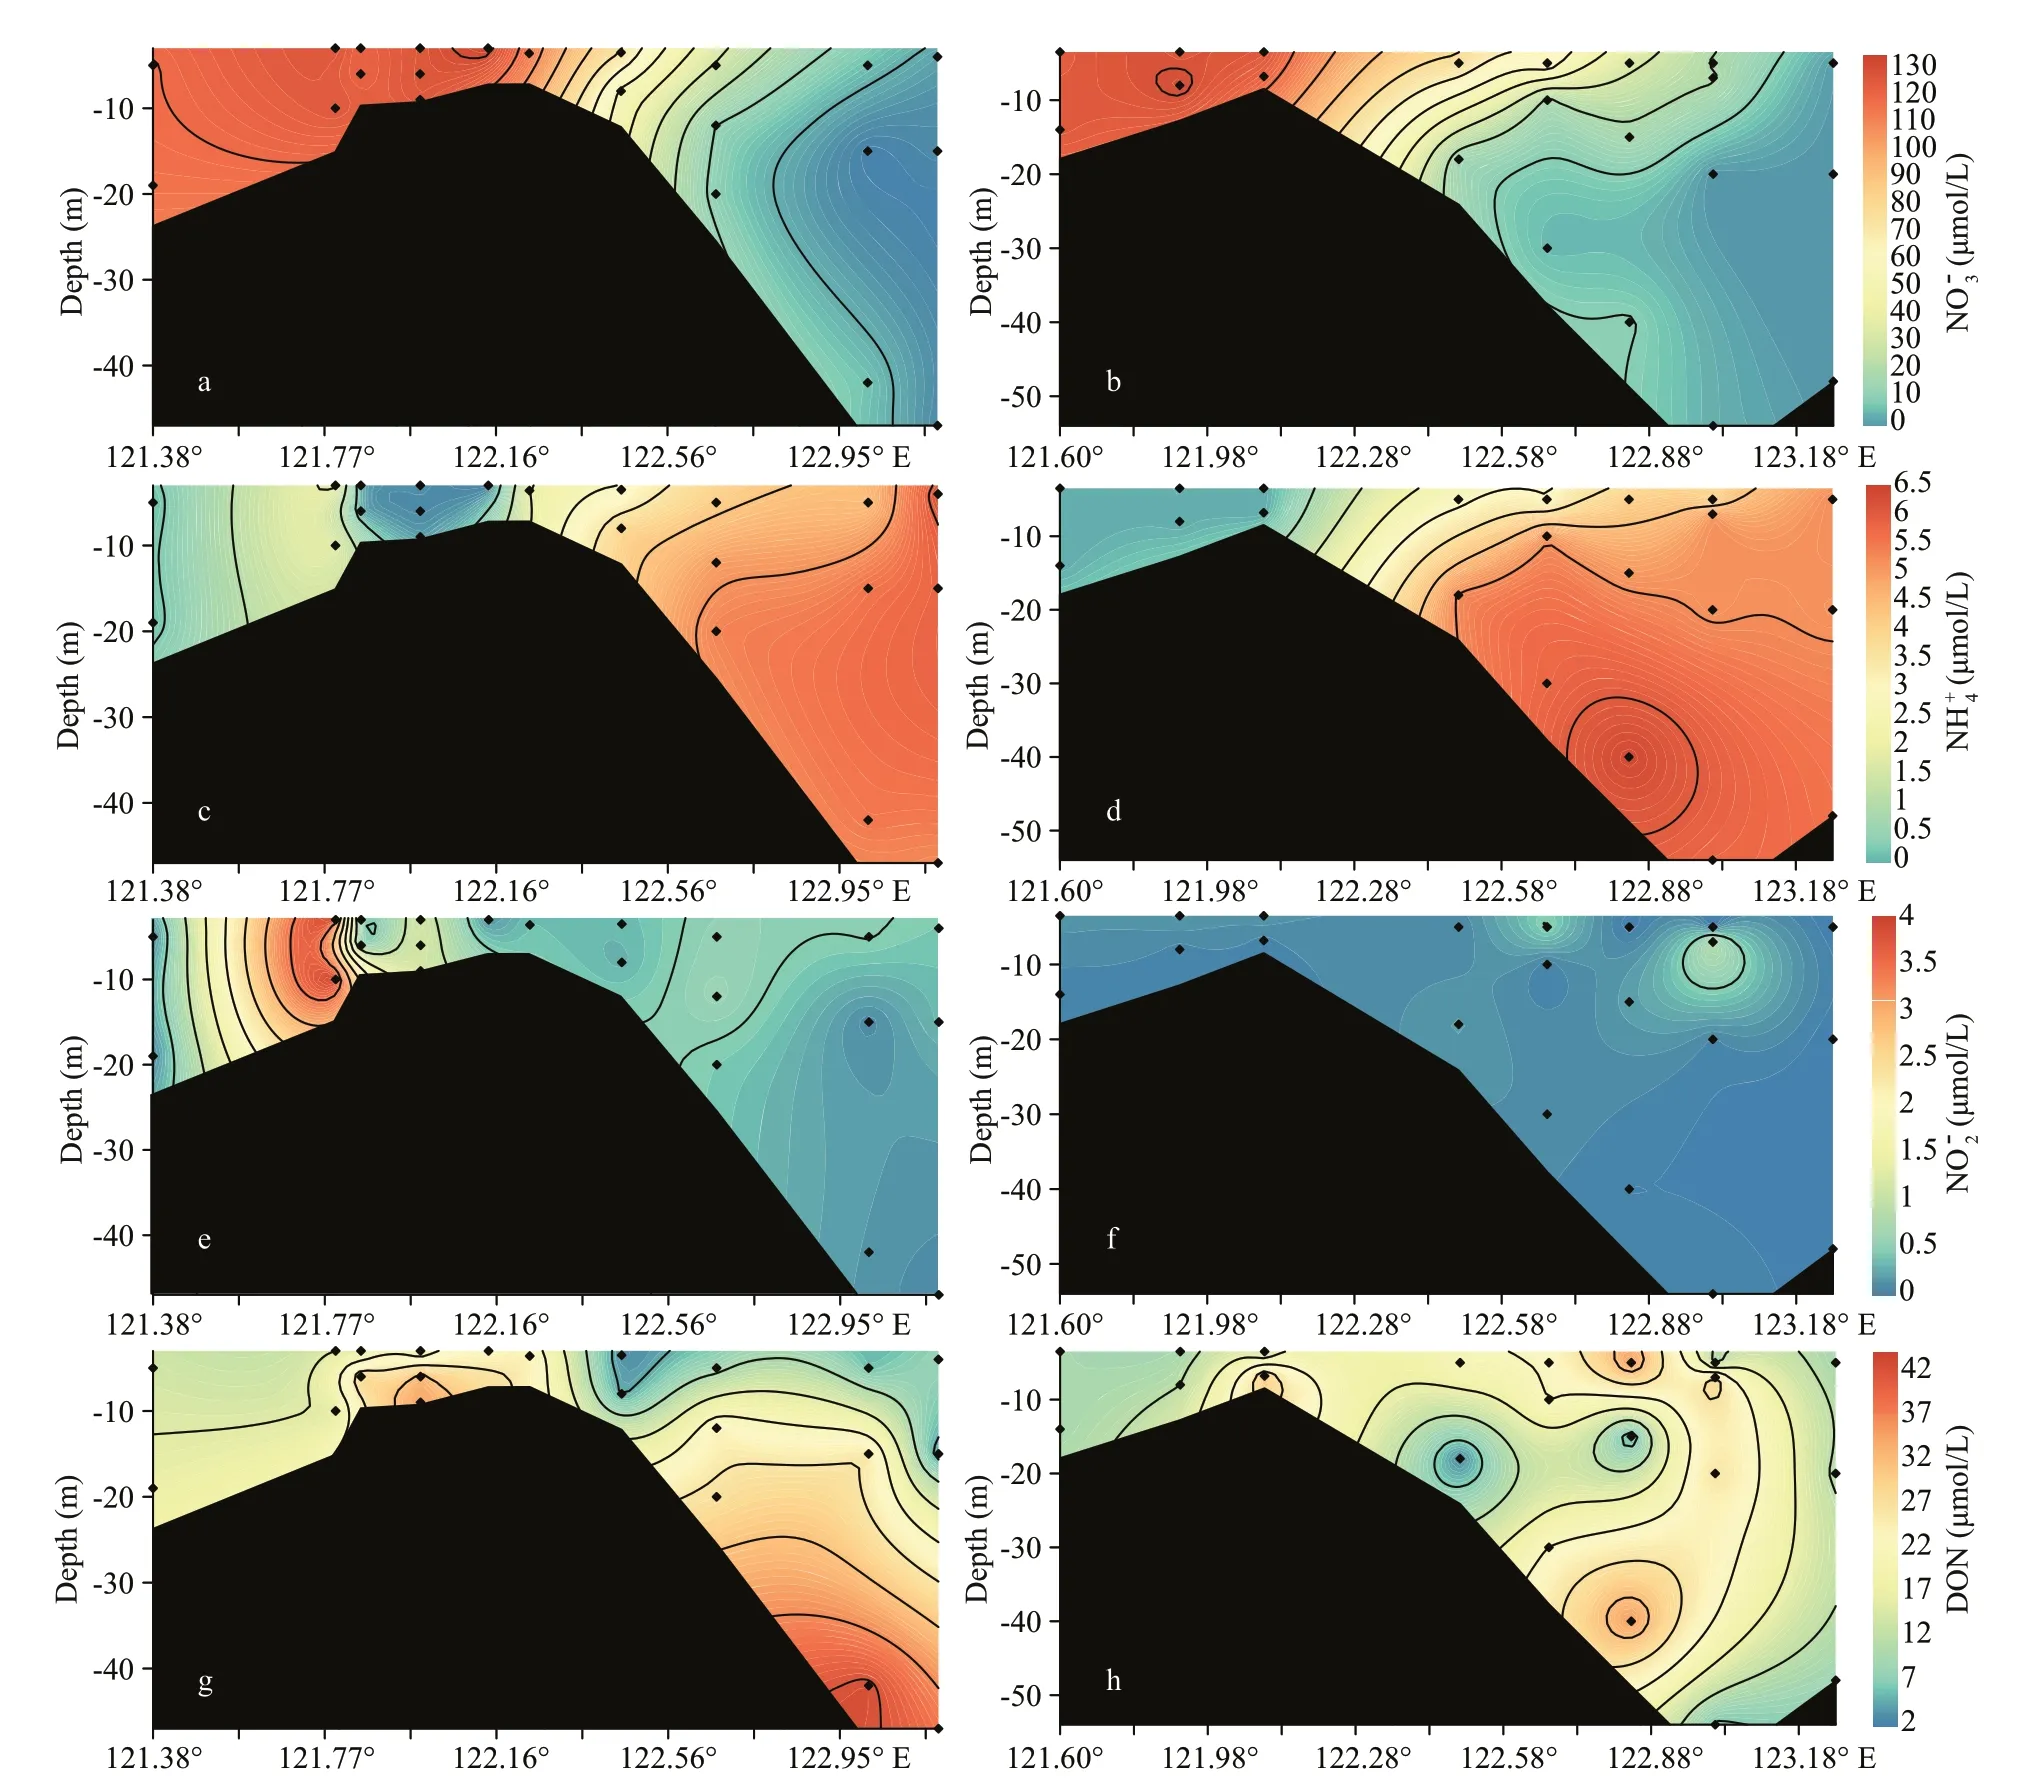
Fig.3 Profileof NO ˉ 3 (a & b), NH+ 4 (c & d), NO ˉ 2, (e & f), and DON (g & h) on transect A (left panel) and transect B (right panel)
3.3 Off sets for DIN and isotopes
The off set for NO3ˉ concentration, i.e. the diff erence in NO3ˉ concentration between the observed value and the values calculated from the three-endmember mixing model (Fig.6a), was outlined along the salinity gradient (Fig.6b, Supplementary Tables S2& S3). On transect A, an increase in NO3ˉ concentration off set was found at inner stations(high turbidity water). In the outer plume, the off set for NO3ˉ concentration in the surface water was negative, suggesting an active consumption. The bottom water (high salinity) showed a patchy distribution and both increase and decrease in the off set values were obtained. Along transect B, off sets of NO3ˉ concentration in low salinity water (ca. 0–20)were frequently smaller than values obtained from transect B. For NH4+(Fig.6c), positive off sets were found in the outer plume, while negative values were observed in the low salinity water, especially on transect A. For isotope compositions, the water with the salinity below 20 showed a slightly positive off set for both δ15N/δ18O-NO3ˉ (Fig.6d–e). In high salinity water, a positive off set in the surface was found while it decreased dramatically in the bottom water. The linear correlation between δ15N-NO3ˉ and δ18O-NO3ˉ was significant (slope=1.22,R2=0.90,P<0.05)(Fig.6f).
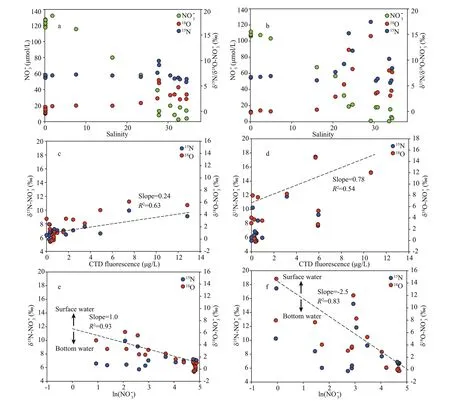
Fig.4 CorrelationsbetweenNOˉ 3concentrationandisotopecompositionswithsalinity (a&b);correlation between stable isotope compositionsin NO ˉ 3and fluorescence(c&d),andNO ˉ 3 concentration (logarithm,e &f)
4 DISCUSSION
4.1 NO 3 ˉ sources in the Changjiang River runoff
In the past forty years, NO3ˉ concentrations in the Changjiang River runoff have markedly increased. At Datong station (600-km distance upstream of the first site on transect A), the NO3ˉ concentration increased from ca. 30 to 120 μmol/L (cf. Fig.7a; data from Dai et al., 2011), accounting for the major component in the riverine DIN inventory (Fig.3a–b). In the current study, the NO3ˉ concentration at the start of both transects (A: 119 μmol/L; B: 108 μmol/L) are comparable with published records from Yan et al.(2017). Enhanced NO3ˉ inventory in the Changjiang River has been attributed to weak biological assimilation due to high turbidity (Zhang et al., 2007)and great contributions from multiple sources,including chemical fertilizer leakage from terrestrial aquifers, wastewater discharge, atmospheric deposition and degradation of terrestrial organic nitrogen (Li et al., 2010; Dai et al., 2011).
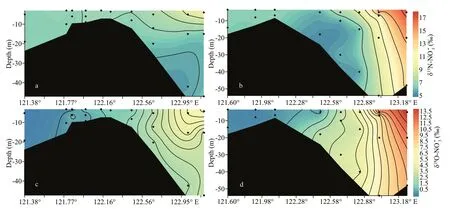
Fig.5 Profile of δ 15 N-NO 3 ˉ and δ 18 O-NO 3 ˉ on transect A (a & c) and transect B (b & d)


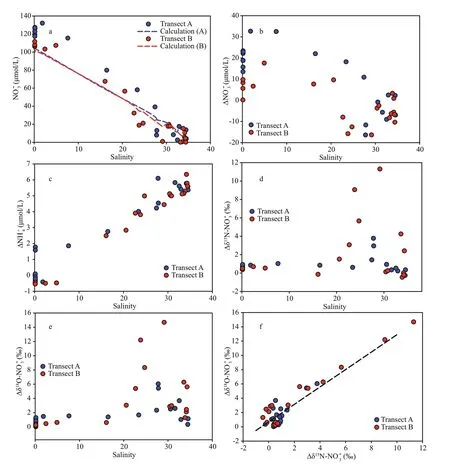
Fig.6 Diff erence between model calculated NO 3 ˉ concentration (dash line) and observation value (points) (a); distribution of NO 3 ˉ (b), NH 4 + (c), δ 15 N-NO 3 ˉ (d), and δ 18 O-NO 3 ˉ (e) off sets (Δ in the figure) along the salinity gradient; correlation between δ 15 N-NO 3 ˉ and δ 18 O-NO 3 ˉ off sets (f)
4.2 NO 3 ˉ production in the CDW

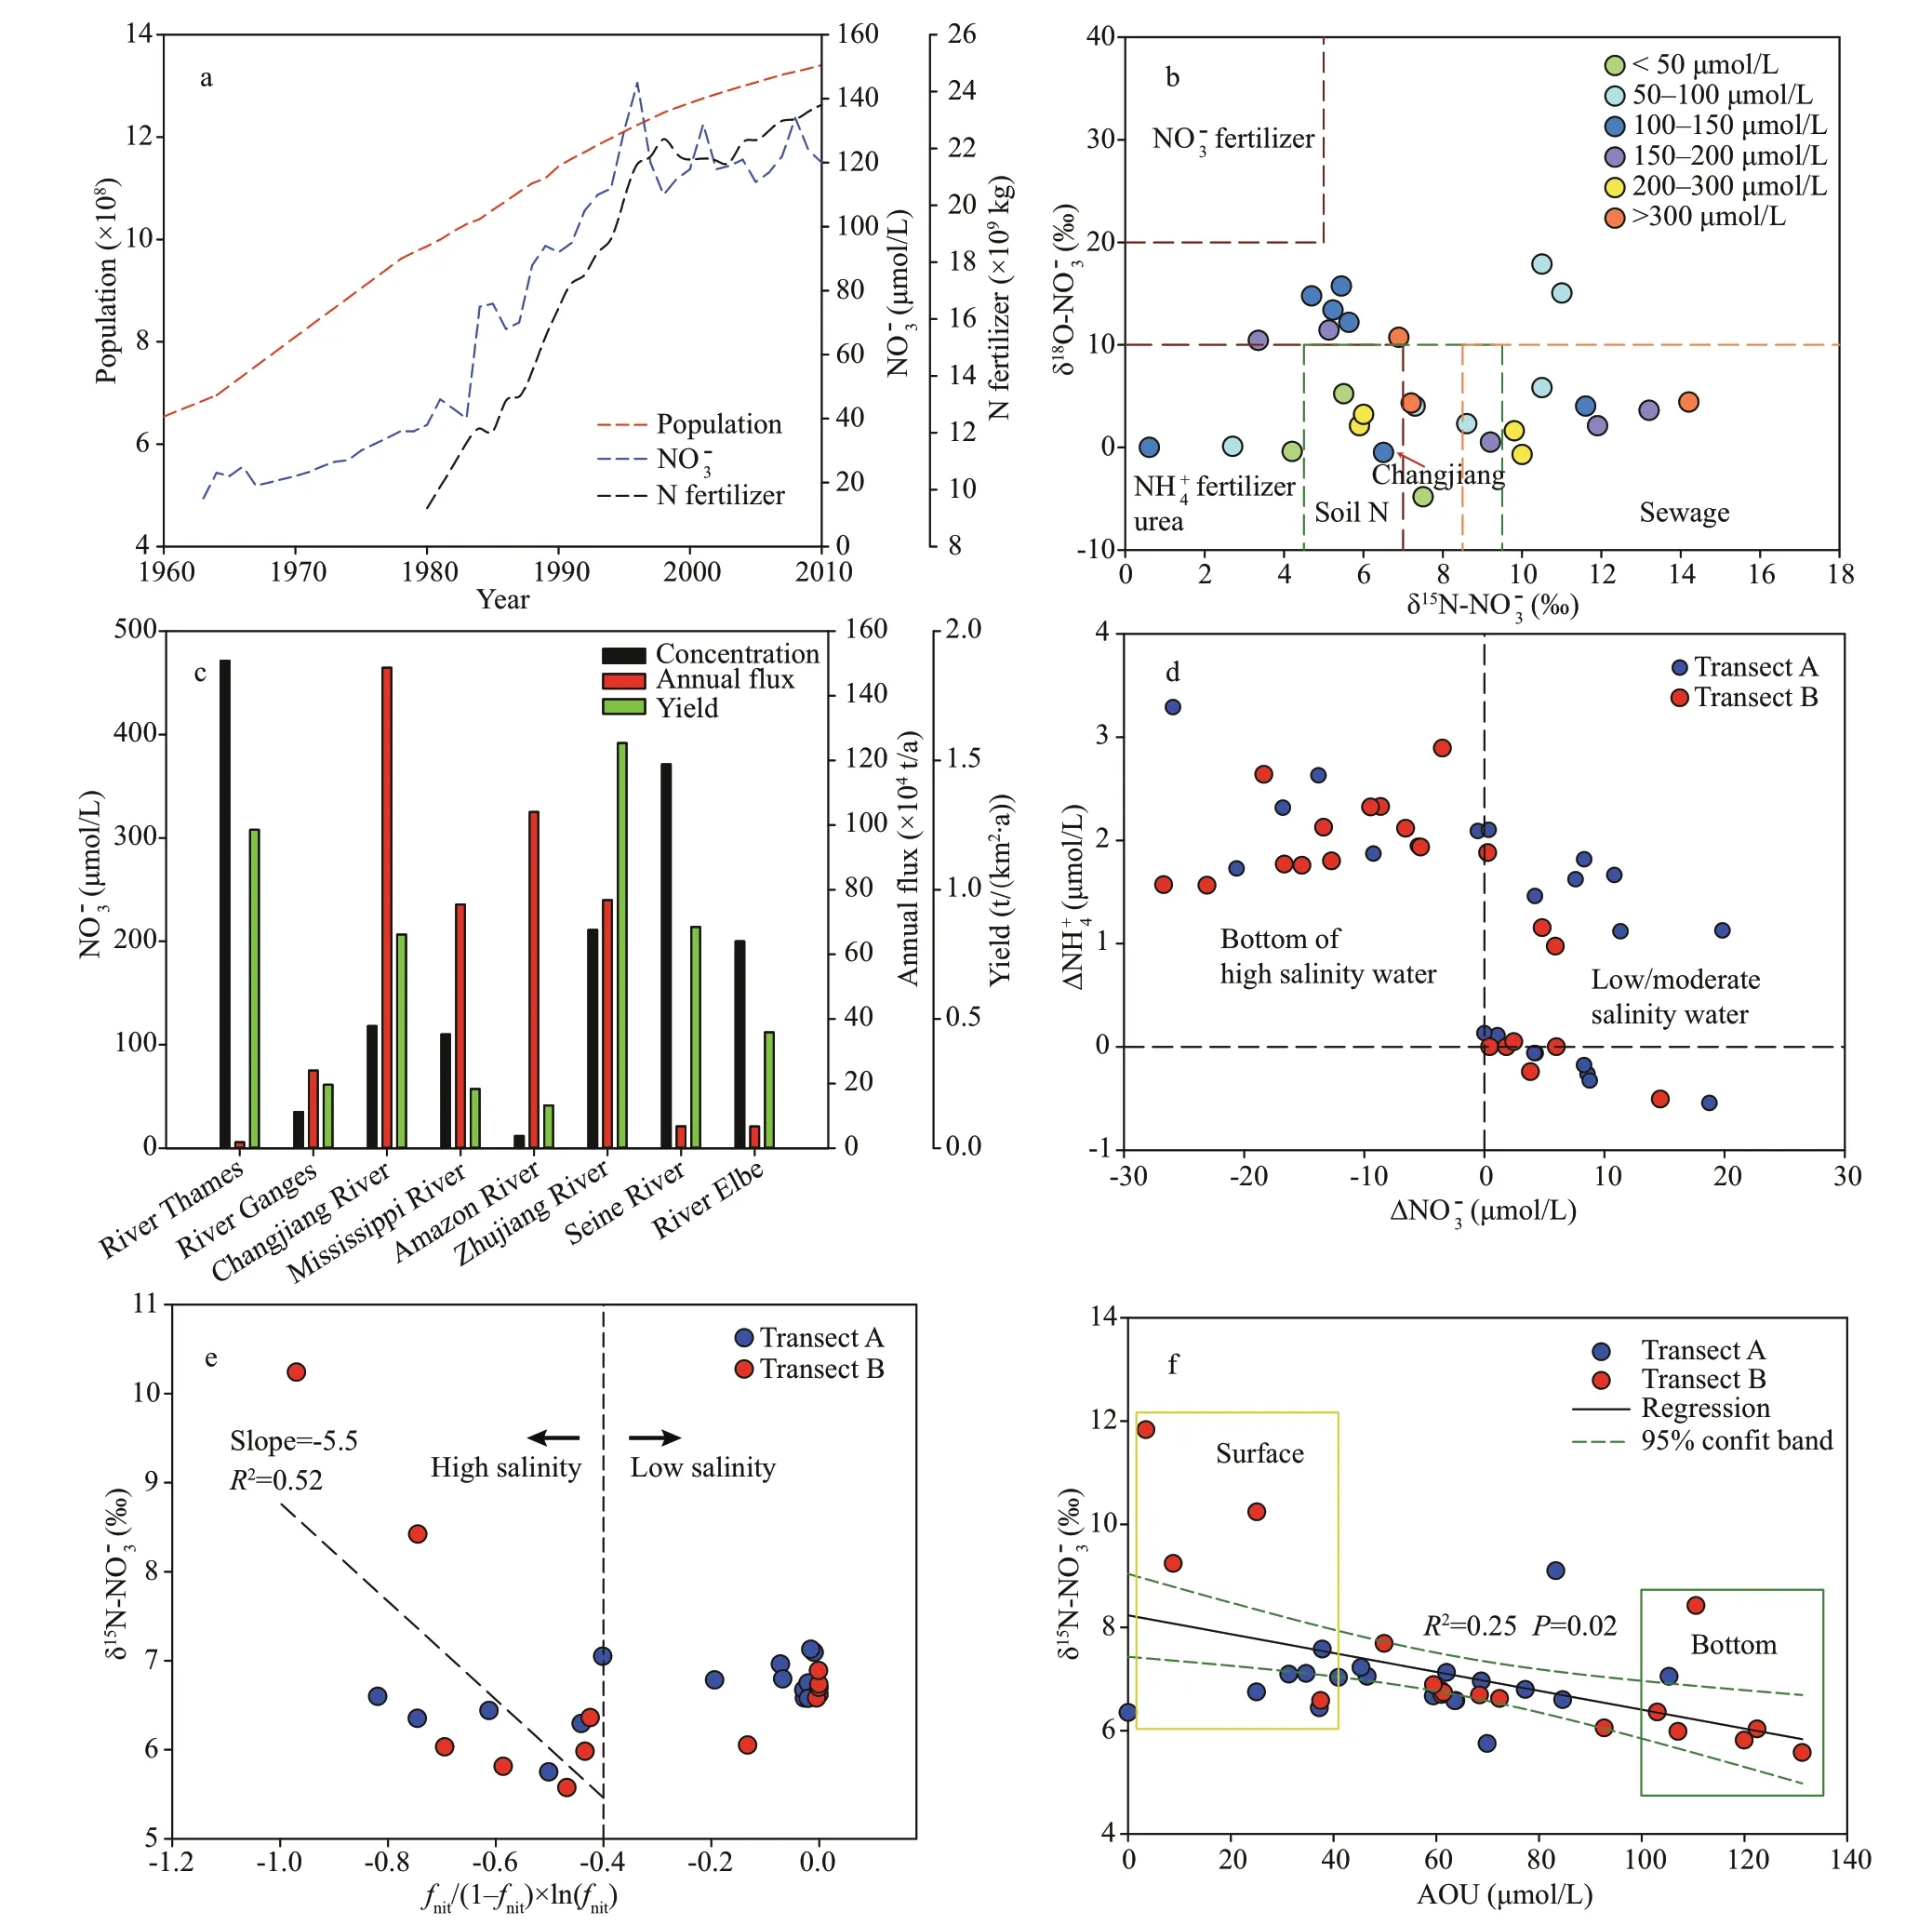
Fig.7 Growth of Chinese population and N fertilizer application (China National Bureau of Statistics, http://www.stats.gov.cn/) and NO 3 ˉ concentration in Changjiang River water mainly determined at Datong Station (data mainly from Dai et al. (2011)) (a); distribution of δ 15 N/δ 18 O-NO 3 ˉ in river water before discharge to estuaries (salinity <0.5) on a global scale (b); comparison of NO 3 ˉ concentration, annul flux, and watershed yield in diff erent rivers on the global scale (c);correlation between NO 3 ˉ concentration off set (Δ in the figure) and NH 4 + concentration off set (Δ in the figure) in both transects (d); correlation of δ 15 N-NO 3 ˉ in low salinity water (ca. salinity <20) and bottom of high salinity water (20–34)with f nit/(1– f nit)×ln( f nit) (e); correlation between δ 15 N-NO 3 ˉ and AOU (apparent oxygen utilization) in the CDW (f)
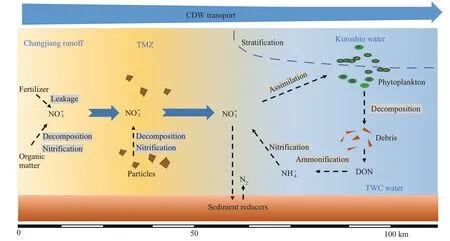
Fig.8 Sketch of NO 3 ˉ addition and removal in the CDW with a description of reaction pathways and water masses from the current cruise
Intriguingly, between two transects, the concentration of NO2ˉ, the intermediate product in the nitrification reaction chain, diff ered in the low/moderate salinity water. On transect A, the NO2ˉ concentration peak was observed near the river mouth(Fig.3e), while an enrichment in NO2ˉ was not observed on transect B (Fig.3f). Moreover, the peak value in positive NO3ˉ concentration off set obtained on transect A (ca. 32 μmol/L) was higher than the value on transect B (17 μmol/L). Apart from the bias introduced from the endmember selection, reasons for these diff erences may be linked to the TSM concentration.In particular, on transect A, TSM concentration markedly increased from the river water to brackish water (ca. salinity <20) (Fig.2e), and a large area of turbidity maximum zone (TMZ) was observed by a turbidity probe equipped on a towed system during the cruise, mainly due to relatively low discharge rate and strong tidal swash. The location of TMZ on transect A fits the historical observation (Yang et al.,2015). The marked increase in TSM concentration likely stimulates nitrification by providing substrates for remineralization (a positive link between TSM and NO3ˉ off sets in Supplementary Fig.S2). In addition,terrestrial particles in the TMZ were continuously suspended, prolonging the reaction time with oxidants, such as DO, in the water column. In contrast,a strong river plume rapidly injects and spreads in the East China Sea under the Coriolis force on transect B(Wu et al., 2010). Therefore, the typical TMZ along the transect was not captured during the cruise.Consequently, moderate NO3ˉ generation was observed because the particle-dependent nitrification may have been influenced by low concentrations of TSM.
Elevations in NO3ˉ concentration were also observed at the bottom of high salinity water (e.g. A9 and B6 in Supplementary Tables S2 & S3). Due to wide coverage of permeable sediments, it is possible to assume that submarine groundwater discharge may have contributed to this increase. Given the high concentration of NO3ˉ in groundwater, a small fraction could deeply change the NO3ˉ concentration in the receiving water (Moore, 2010). Generally,contaminated groundwater was enriched in δ18O-NO3ˉ due to continuous denitrification (15‰ to 90‰), as summarized by Xue et al. (2009). Those values are significantly higher than the records obtained in the present study, indicating that the high concentration of benthic NO3ˉ was not the result of groundwater injection. Alternatively, the increase in NO3ˉ concentration was triggered by bottom water nitrification (Fig.8), which was supplied by the algae debris from the upper layer (Yan et al., 2017; Li et al.,2018). Compared to the nitrification rate in low salinity water, accumulation of NH4+in the outer plume was found (Fig.7d). Nitrification is conducted by ammonia-oxidation archaea (AOA) and ammoniaoxidation bacteria (AOB) and the community structure in ocean water diff ers from that of terrestrial water (Martens-Habbena et al., 2009). Usually, the marine-derived AOA (the dominant contributor to nitrification) show a higher affi nity to NH4+(Kuypers,2017), indicating active nitrification at the high salinity CDW (Hsiao et al., 2014). Given the positive linkage between nitrification rate and NH4+concentration in the CDW (Wang et al., 2018), minor accumulation of NH4+should be observed, which is against the current observation. Moreover, the δ15NNO3ˉ fractionation was higher in the bottom of saline water than that in the low/moderate salinity CDW. In particular, the nitrification potential was introduced,which was defined as the slope between δ15N-NO3ˉ andfnit/(1–fnit)×ln(fnit), wherefnitis the concentration ratio between NH4+and DIN (Wang et al., 2017). This potential in the water column is positively linked to nitrification produced NH4+in the benthic waters under the same substrate condition. It also helps the identification of reactant sources for nitrification process. Clearly, the bottom water at outer plume showed a significantly positive correlation between δ15N-NO3ˉ andfnit/(1–fnit)×ln(fnit) (Fig.7e); whereas the trend in low salinity water was weak. The reason for such distribution can be attributed to the supply of oxidants. Near the river mouth, the shallow depth and extensive mixing lead to an active exchange of DO between the atmosphere and the estuary water. In the outer plume, stratification and enhanced water depth hampered DO exchanges, as evidenced by high values of apparent oxygen utilization (AOU) in the bottom water (Fig.7f). In the CDW, a linear correlation between δ15N-NO3ˉ and AOU was observed (Fig.7f),indicating the significance of DO in benthic nitrification. Furthermore, the suspended particles in the TMZ might contain high levels of trace metal,such as iron and magnesium, due to the adsorption and flocculation (Zhu et al., 2018). These metals could also act as the electron acceptor during nitrification (Hsiao et al., 2014); while the concentration is usually low in pelagic debris and saline water (Zhu et al., 2018). In summary, the DO supply and reactive trace metals constrained the nitrification rate in the bottom of saline water though reaction potentials can be high.
4.3 NO 3 ˉ removal in the CDW
The NO3ˉ removal appeared in two regions in the outer plume (Fig.8). In the surface water, turbidity decreased at seaward of the TMZ, which resulted from stratification, reduced turbulence and vertical mixing, benefiting the light availability for phytoplankton. It agrees with the observed phytoplankton bloom in the CDW front (Gao and Song, 2005). Hence, the NO3ˉ consumption coupled with utilization by primary producers was observed,as depicted by the significantly positive correlation(R2>0.54) between fluorescence intensity and δ15NNO3ˉ (Fig.4c–d). In the present study, marked increases in NO3ˉ isotope compositions occurred at the 20 isohaline (Fig.4a–b), which was identical to the value from Zhang et al. (2015) on δ30Si enrichment in the estuary. Consequently, 20 isohaline can be treated as a starting boundary for the rapid uptake of nutrients by primary producers. As previously mentioned(Section 2.1),Skeletonemacostatumwas dominant in the outer plume on both transects. This assimilation increased isotope compositions, leading to strong correlations between NO3ˉ concentration and δ15N/δ18O-NO3ˉ in surface water (Fig.4e–f).
Though with identical phytoplankton species, NO3ˉ depletion (below 1 μmol/L) was observed on transect B (Fig.4b). In comparison, approximately 5 μmol/L NO3ˉ still existed at the surface of transect A. Moreover,the correlation slopes of δ15N/δ18O-NO3ˉ to ln(NO3ˉ) in the surface water were higher on transect B (Fig.4f),indicating strong isotopic fractionation during the consumption of NO3ˉ. The surface water is usually limited in denitrification carriers due to high DO content (Wong et al., 2014). Moreover, the fluorescence intensity and water residence time on both transects were similar. Adding these together, the diff erence in the stable isotope composition between transects A and B in this study likely results from strong stratification outside of the TMZ. The potential energy anomaly, an indicator of stratification, displays a peak on transect B (Supplementary Fig.S3),indicating a slow water exchange between the surface and bottom. Such strong stability is beneficial for the growth of phytoplankton in the surface water, which may have resulted in the continuous utilization of NO3ˉ and elevation of δ15N/δ18O-NO3ˉ in the CDW plume. Interestingly, the enhanced NO3ˉ utilization bySkeletonemacostatumdid not trigger a significant increase in biomass, as outlined by the similar CTD fluorescence intensity between transects A and B(Fig.2g–h). One reason is that strong currents in the Changjiang River plume had flushed the phytoplankton off shore. More importantly, this phenomenon may be linked to density eff ect, which suggests that algae concentration could not continuously increase;whereas algae communities, especially for the nutrient-sensitive species, such asSkeletonemacostatum(Li et al., 2018), could continuously accumulate nutrient from ambient environment into cells (luxury consumption). Collos et al. (1992)revealed that intracellular accumulation of NO3ˉ inSkeletonemacostatumreached 17 mmol/L, i.e.several orders of magnitude higher than the ambient NO3ˉ concentration. The excess N may be stored in the vacuole of the algae as amino acids or protein(Ketchum, 1939). When N concentration in the ambient environment decreases, the stored N could sustain the cell function and algae biomass, leading to a continuous bloom in the CDW. In the benthic water,decrease in NO3ˉ concentration was also observed(Fig.3a–b). The concentration decrease mainly results from denitrification sinceSkeletonemacostatumcannot actively move to the bottom water due to lack of flagellates (Li et al., 2018). Denitrification could occur in both the water column and sediments (Yan et al., 2017). Usually, 2 mg/L DO concentration was assumed to be the highest level that denitrifiers could bear in seawater (Codispoti and Christensen, 1985).The DO concentration in the present study was higher than this threshold. Therefore, sediments are the major rector for denitrification. In the Changjiang estuary, high denitrification potential in benthic and intertidal sediments, especially in cohesive sediments(muddy sediment), has been reported (Song et al.,2013). Coupled with exchanges between sediment porewater and overlying water, a significant fraction of NO3ˉ was injected into sediments, especially the permeable sediments. Compared with the biological assimilation, denitrification in the sediment may not significantly alter stable isotope values (<0.5‰ here)because of the completed transformation (Yan et al.,2017). Moreover, sediment denitrification might be coupled with nitrification (Fig.8), eff ectively removing the produced NO3ˉ and hence preventing the transport of NO3ˉ from the deep water to surface water.
5 CONCLUSION
In the present study, the source of NO3ˉ in the Changjiang River runoff before the river-sea mixing was mainly attributed to inputs from chemical fertilizer (based on δ15N/δ18O-NO3ˉ values), indicating the importance of management on fertilizer application and reforestation in the watershed.Sewage-related NO3ˉ may also be important to the riverine inventory while nitrification alters the isotope compositions. In the coastal zone that receives the Changjiang River runoff , when salinities <20, positive off sets for NO3ˉ concentration were obtained, likely due to the strong nitrification supplied by remineralization of N on particles and DON. The NO3ˉ production peaked at the TMZ because of resuspension of particles and high levels of DO. In the high salinity CDW (salinity >20), the surface water became a sink for NO3ˉ due to diatom assimilation. Consequently, 20 isohaline can be regarded as a boundary for the rapid uptake of nutrients by primary producers, benefiting the predication of algae bloom in coastal management.Compared with transect A, the strong stratification at the outer plume of transect B markedly stimulated phytoplankton utilization. The boost in the biological assimilation did not increase diatom biomass,therefore the assimilation may be linked to phytoplankton luxury consumption. In the bottom water, denitrification and nitrification coexisted.Nitrification was supplied by the degradation of algae debris, which increased NO3ˉ concentrations but decreased stable isotope compositions. Denitrification likely occurred at the water-sediment interface that continuously removed NO3ˉ, but without significant alternation on NO3ˉ due to completed transformation.The production and removal for NO3ˉ in the CDW should be taken into consideration by coastal managers and modeling workers. Furthermore,microorganism analyses and incubation experiments to quantitatively determine the dynamic between environmental drivers and NO3ˉ addition/removal rates are necessary.
6 DATA AVAILABILITY STATEMENT
The data used in the present study are available from the corresponding author upon request.
7 ACKNOWLEDGMENT
Technical support by Prof. GAO Yonghui, Prof. LI Bo, Ms. ZHENG Wei, Dr. ZHU Xunchi, Ms. QI Lijun, Mr. LIU Zhengbo, Ms. CAO Wanwan, Ms.JIANG Shuo, Mr. ZHU Kun, Mr. DAI Jinlong, and the R/VZheyukeIIcrew during the cruise are acknowledged. The authors also appreciate the great assistance from Prof. YU Zhiming at the Institute of Oceanology, Chinese Academy of Sciences for the assistance in stable isotope analyses. Thanks are also due to the editor and anonymous reviewers, whose comments helped to improve the original manuscript.
杂志排行
Journal of Oceanology and Limnology的其它文章
- Steady increase in water clarity in Jiaozhou Bay in the Yellow Sea from 2000 to 2018: Observations from MODIS*
- Phylogenetic diversity and bioactivity of culturable deepsea-derived fungi from Okinawa Trough*
- Allelopathic eff ects of mixotrophic dinoflagellate Akashiwo sanguinea on co-occurring phytoplankton: the significance of nutritional ecology*
- Investigation of the decline of Ulva prolifera in the Subei Shoal and Qingdao based on physiological changes*
- Effi ciency of phosphorus accumulation by plankton,periphyton developed on submerged artificial substrata and metaphyton: in-situ observation in two shallow ponds*
- Petroleum exploitation enriches the sulfonamide resistance gene sul2 in off shore sediments
