A wearable real-time telemonitoring electrocardiogram device compared with traditional Holter monitoring
2021-06-05QinShenJianqingLiChangCuiXingyaoWangHongxiangGaoChengyuLiuMinglongChen
Qin Shen, Jianqing Li, Chang Cui, Xingyao Wang, Hongxiang Gao, Chengyu Liu,Minglong Chen,✉
1Department of Cardiology, the First Affiliated Hospital of Nanjing Medical University, Nanjing, Jiangsu 210029,China;2School of Biomedical Engineering and Informatics, Nanjing Medical University, Nanjing, Jiangsu 211166, China;3School of Instrument Science and Engineering, Southeast University, Nanjing, Jiangsu 210096, China.
Abstract Arrhythmias are very common in the healthy populations as well as patients with cardiovascular diseases.Among them, atrial fibrillation (AF) and malignant ventricular arrhythmias are usually associated with some clinical events. Early diagnosis of arrhythmias, particularly AF and ventricular arrhythmias, is very important for the treatment and prognosis of patients. Holter is a gold standard commonly recommended for noninvasive detection of paroxysmal arrhythmia. However, it has some shortcomings such as fixed detection timings, delayed report and inability of remote real-time detection. To deal with such problems, we designed and applied a new wearable 72-hour triple-lead H3-electrocardiogram (ECG) device with a remote cloud-based ECG platform and an expertsupporting system. In this study, 31 patients were recruited and 24-hour synchronous ECG data by H3-ECG and Holter were recorded. In the H3-ECG group, ECG signals were transmitted using remote real-time modes, and confirmed reports were made by doctors in the remote expert-supporting system, while the traditional modes and detection systems were used in the Holter group. The results showed no significant differences between the two groups in 24-hour total heart rate (HR), averaged HR, maximum HR, minimum HR, premature atrial complexes(PACs) and premature ventricular complexes (PVCs) (P>0.05). The sensitivity and specificity of capture and remote automatic cardiac events detection of PACs, PVCs, and AF by H3-ECG were 93% and 99%, 98% and 99%, 94% and 98%, respectively. Therefore, the long-term limb triple-lead H3-ECG device can be utilized for domiciliary ECG self-monitoring and remote management of patients with common arrhythmia under medical supervision.
Keywords: wearable ECG device, Holter, real-time, remote ECG monitoring
Introduction
Cardiac arrhythmias is highly prevalent in the healthy population as well as in patients with cardiovascular diseases. The prevalence of atrial fibrillation (AF) is reported to be 0.65% in the general Chinese population, 0.7% in patients with hypertension and 2.6% in patients with coronary artery diseases[1−2].It is age-adjusted, increasing to 7.5% in people over 80 years. AF, which accounts for one-third of all hospitalized arrhythmias, increases the risk of ischemic stroke and systemic arterial embolization,with an annual incidence of 1.92% and 0.24%,respectively[3]. The prevalence of AF in patients of New York Heart Association (NYHA) functional class Ⅰ is less than 10% and that in patients of NYHA functional class Ⅳ up to 55%[4]. It has been reported that the prevalence of PVCs in general population is from 40% to 75% when detected by a 24-hour or 48-hour dynamic electrocardiogram (ECG)[5−6].Malignant ventricular arrhythmias, accounting for 5%of ventricular arrhythmias, are associated with some serious clinical events. More recent studies have shown that PVCs play a role in triggering fatal ventricular arrhythmias such as ventricular tachycardia or ventricular fibrillation. Thus, early diagnosis of PVCs and AF is important for the improvement of clinical outcome, particularly in patients with acute myocardial infarction and heart failure.
At present, Holter is one of the most common 24-hour noninvasive monitors and has been recognized for its reliability in detecting paroxysmal arrhythmias in China[7−9]. However, it has some limitations such as its cumbersome size, fixed recording timings, and delay in the diagnosis. In addition, Holter with traditional software system does not provide real-time ECG signals tele-transmission or capture of cardiac events, which significantly reduces the sensitivity of Holter monitors. According to previous research, a 24-hour Holter monitoring can only diagnose about 15% to 39% of palpitation[10−12],and often fails to detect the culprit of the arrhythmias in patients[13]. In a word, the traditional multiple-lead Holter, though commonly used, is depreciated by its limitations such as low diagnostic sensitivity and minor evidence capture ability in arrhythmias.
Comparative studies show that the single-lead Omron HeartScan and triple-lead ZioPatch devices can detect more cases of symptom-associated arrhythmias than the Holter monitor does[14−15]. By contrast, wearable long-term single-lead or multi-lead remote ECG device affords a potential choice to monitor the health condition. Unfortunately, these wearable remote devices also have some bottlenecks:the risk of packet loss in remote data transmission,high noise of ECG signals, and unstable automatic detection algorithms,etc.
In this study, we investigated the sensitivity and specificity of remote capture and automatic detection system for cardiac events, and compared the 24-hour synchronous detection between Holter and H3-ECG.Then, we analyzed the pros and cons of the two devices. Finally, we explored the feasibility of H3-ECG for domiciliary ECG self-monitoring and remote management of patients with common arrhythmia under medical supervision.
Materials and methods
Study participants and experiment protocol
From October to November 2018, 31 patients with cardiovascular diseases (CVD) aged from 22 to 83 years old were recruited from Department of Cardiology, the First Affiliated Hospital of Nanjing Medical University. Patients with pacemaker or abdominal skin lesions were excluded. The recruited patients, wearing the Holter and H3-ECG simultaneously, undertook their usual activities except shower. At the same time of the next day, patients in the Holter group returned to the hospital to remove Holter, while patients in the H3-ECG group removed H3-ECG by themselves at home, and ECG signals were transmitted to the cloud-based platform through the base. All patients gave written informed consent before participation in this study.
ECG signal collection
Holter monitoring
Holter (SEER Light Holter monitor, GE Healthcare,USA) is a chest three-lead (CM1–3) dynamic digital ECG monitor, consisting of seven electrodes with color-coded lead wires, which can continuously record ECG signals for 24 hours. Before ECG recording, we replaced the battery in the recorder, wiped the patient"s chest skin with alcohol, buckled 3M red dot 2570 (3M HealthCare, Canada) on the buttons of the electrode wire, placed it in the corresponding chest position,then, turned on the switch, and waited for the power indicator to flash indicating the normal operation of the device. After recording, the patients went home for undertaking usual activities. They returned to hospital at the same time of the next day to remove Holter.
H3-ECG monitoring
H3-ECG is a new smart limb-wearable triple-lead ECG device developed by the Wearable Heart-Sleep-Emotion Intelligent Monitoring Lab from Southeast University, which can continuously record ECG signals for 72 hours. The recording parameters of H3-ECG are as follows, sampling rate: 400 Hz, ECG bandwidth: 0.05 to 40 Hz, calibration voltage: 1 mV(error <±5%), amplitude range: 0 to 10 mV, and input impedance: >10 MΩ. All performance indices comply with the medical industry standards (YY 0885-2013).The device consists of a signal acquisition belt and an integrated kernel for data storage and connection of the left and right subclavian electrodes. The signal acquisition belt has two strip-shaped straps that connect to the wet electrodes. During recordings, the signal acquisition belt was fastened to the patient"s waist, and the left and right subclavian electrode wire and two-strip-strap button clipped 3M electrode patch were in direct contact with the skin, positioned at the left and right subclavian and abdominal walls respectively. The power indicator flashed when the device was running normally. The patient carried a smartphone with the installed application software and the smartphone was kept less than 3 to 4 meters from the H3-ECG device. The details for illustrating the H3-ECG were shown inFig. 1. After paring the mobile application with the H3-ECG, ECG signals can be sent to the mobile phoneviaBluetooth. When the patient had uncomfortable symptoms, they clicked the screen of smartphone and then 10-second or longer ECG data, as well as the result of software intelligent detection were instantly sent to the ECG cloud-based platform. The cardiologist manually reviewed and interpreted the results on the expert-supporting system of the cloud-based platform and sent them back to the patient. Meanwhile, the 24-hour ECG data were stored in the H3-ECG box, and patients were instructed to remove H3-ECG at the same time of the next day, and put it on the base of H3-ECG at home for remote online transmission of ECG signals to the cloud-based platform (Fig. 1).
ECG data transmission and analysis
The 24-hour ECG signals recorded by Holter were transmitted through a wired connector into the MARS analysis system (GE-Marquette, USA) installed in the hospital computer for systematic analysis. The patients" files were in MARS system, which were automatically classified as "N" (normal sinus-rhythm),"V" (ventricular-beat), "S" (supraventricular-beat),and "X" (artifact) by the detection software.Cardiologists manually checked and corrected the false detection while confirming the results.
The 24-hour ECG data recorded by H3-ECG were transmitted to the ECG analysis system of the remote cloud-based platform in real-time online or offline.The system software algorithms, like Holter,automatically detected and classified the ECG data into "N", "V", "S", and "X". On expert-supporting system of the cloud-based platform, cardiologists immediately manually checked and corrected the false detection of the 24-hour or symptom-associated ECG data and confirmed the results.
Statistical analysis
To analyze the strength and consistency of the linear relationship between the two devices, Pearson correlation analysis was performed for the two data sets on total and mean HR, as well as the Bland-Altman plots.
GraphPad Prism version 5 was used for the statistical analysis and graphs drawing. Age was expressed as mean and standard deviation (i.e.,), clinical characteristics as percentages. Pairedt-tests were used for between-group comparisons.P>0.05 was considered to be not significant statistically. The results of automatic detection of symptom-associated ECG data were calculated with specificity and sensitivity.
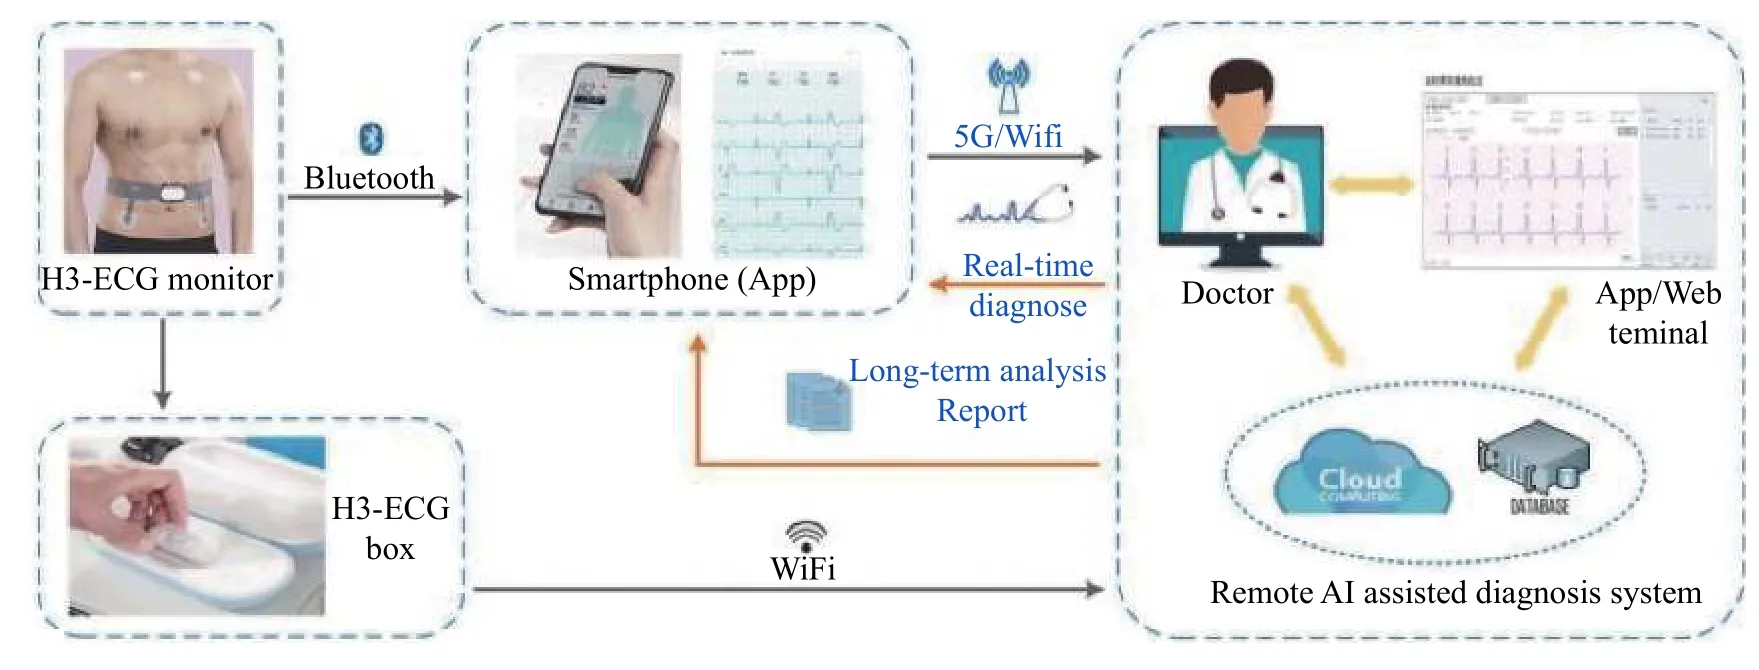
Fig. 1 Illustration of H3-ECG telemonitoring system. This system consists of three major components: (1) a gateway app, deployed on the patient"s mobile, that receives ECG signals from H3-ECG device; (2) a remote server that host algorithms for accurate classification and detection of the ECG signal, and (3) terminal of doctor to receive a detection report from the server based on the analysis of the ECG signals.
Results
Clinical characteristics of the enrolled patients
Table1summarizes the clinical characteristics of the 31 enrolled patients, including 21 (66.7%) males.The age of the patients ranged from 22 to 83 years,with a mean age of (50.0±20.4) years. Each patient had one or more past medical history, and nearly half of them were in NYHA functional class Ⅰ. Among the enrolled patients, common diseases, such as hypertension and coronary artery disease, are account for more than 2/3.
Twenty-four hours ECG comparison
Comparison of ECG waveforms
Fig. 2compares the ECG waveforms recorded from Holter and the H3-ECG device. It presents screenshots of the software monitoring system taken during the study. It shows that the ECG waveforms recorded by the H3-ECG are clear and identifiable. They are generally consistent with those recorded by Holter,though the amplitude of the P wave (line 2 and 6) and the amplitude of QRS recorded (see line 3, 4 and 5)are lower than those recorded by Holter (as arrows marked inFig. 2).
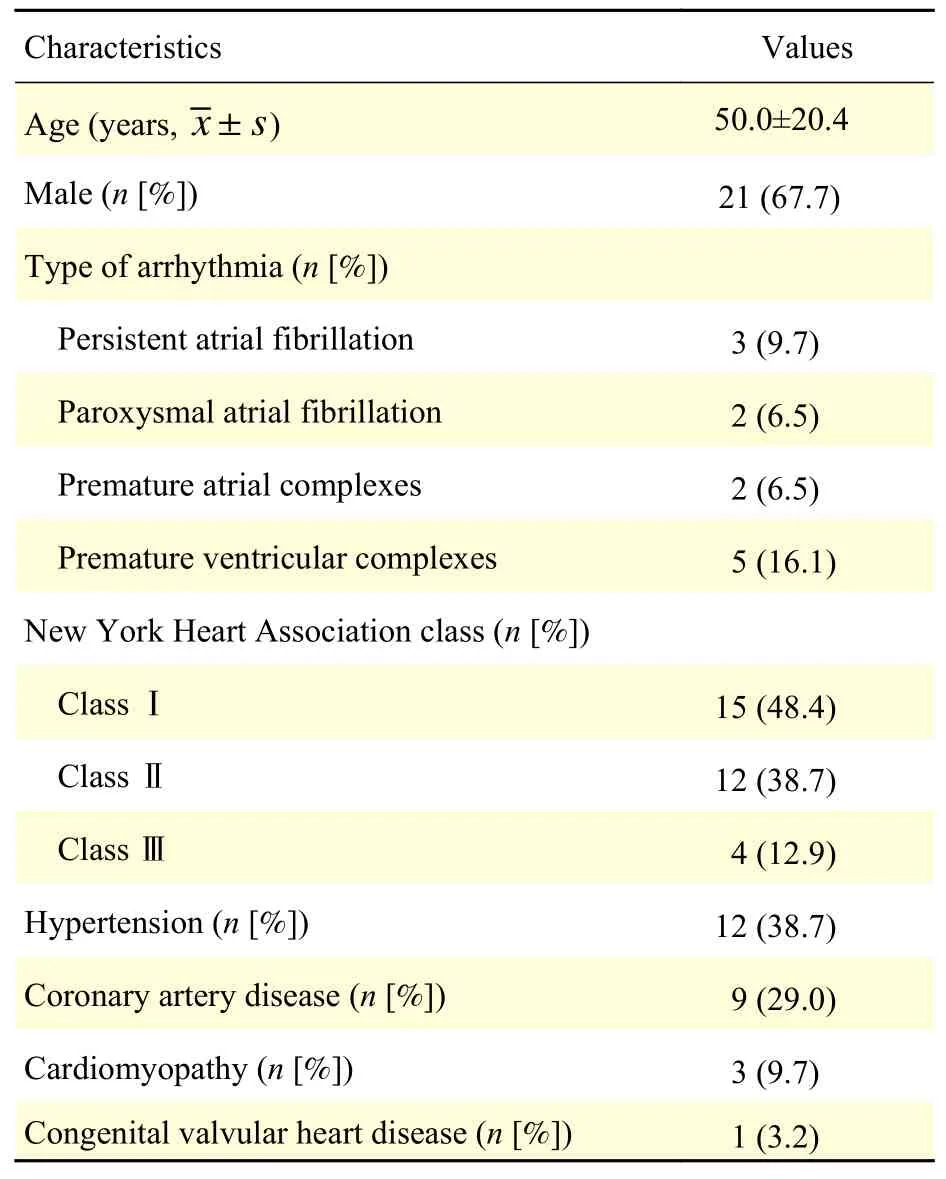
Table 1 Clinical characteristics for the 31 enrolled patients
Comparison of 24-hour heart rate
Fig. 3presents the Pearson correlation coefficients of the total and mean HR for the two data sets detected by H3-ECG and Holter. The computed Pearson correlations were 0.68 for total HR datasets,and 0.80 for mean HR datasets, which indicated that the signals recorded by two devices has a strong correlation. Such results can also be explained by the Bland-Altman plots of paired HR values for both devices in the two data sets, which were presented inFig. 3BandD. HR derived from H3-ECG was on average lower than that from the Holter, with a mean difference of −0.35×10⁴(95% confidence interval[CI], −3.30×10⁴–2.61×10⁴) beats for 24-hour total HR and −0.03 (95% CI, −14.36–14.29) beats per minute(bpm) for mean HR.
Pairedt-tests were used to compare 24-hour ECG data between the two devices for the 31 patients. As also shown inFig. 4A−D, there was no significant difference between the two groups during 24-hour in term of total, mean, maximum and minimum HRs (P>0.05).
Comparison of 24-hour PACs and PVCs
Fig. 4E−Fpresent the PACs and PVCs of all patients for 24-hour ECG data by H3-ECG and Holter.The pairedt-tests did not show any significant difference between them (P>0.05). InFig. 4F, the distribution of the overestimation PACs extended over a broader range of beat values in H3-ECG than that in Holter, however, no significant differences were found(P>0.05).
Detection for cardiac events
Results of remote short-time symptom-associated ECG data transmission and automatic detection were shown inTable 2. During the 24-hour simultaneous monitoring, the cardiologist received a total of 232 automatic remote captures of symptom-associated ECG dataviathe application, including 98 cases of Normal, 40 cases of PVCs, 44 cases of PACs and 50 cases of AF. The sensitivity and specificity of capture and remote automatic detection of cardiac events showed PACs, PVCs, AF were 93% and 98%, 98%and 99%, 94% and 98%, respectively.
Discussion
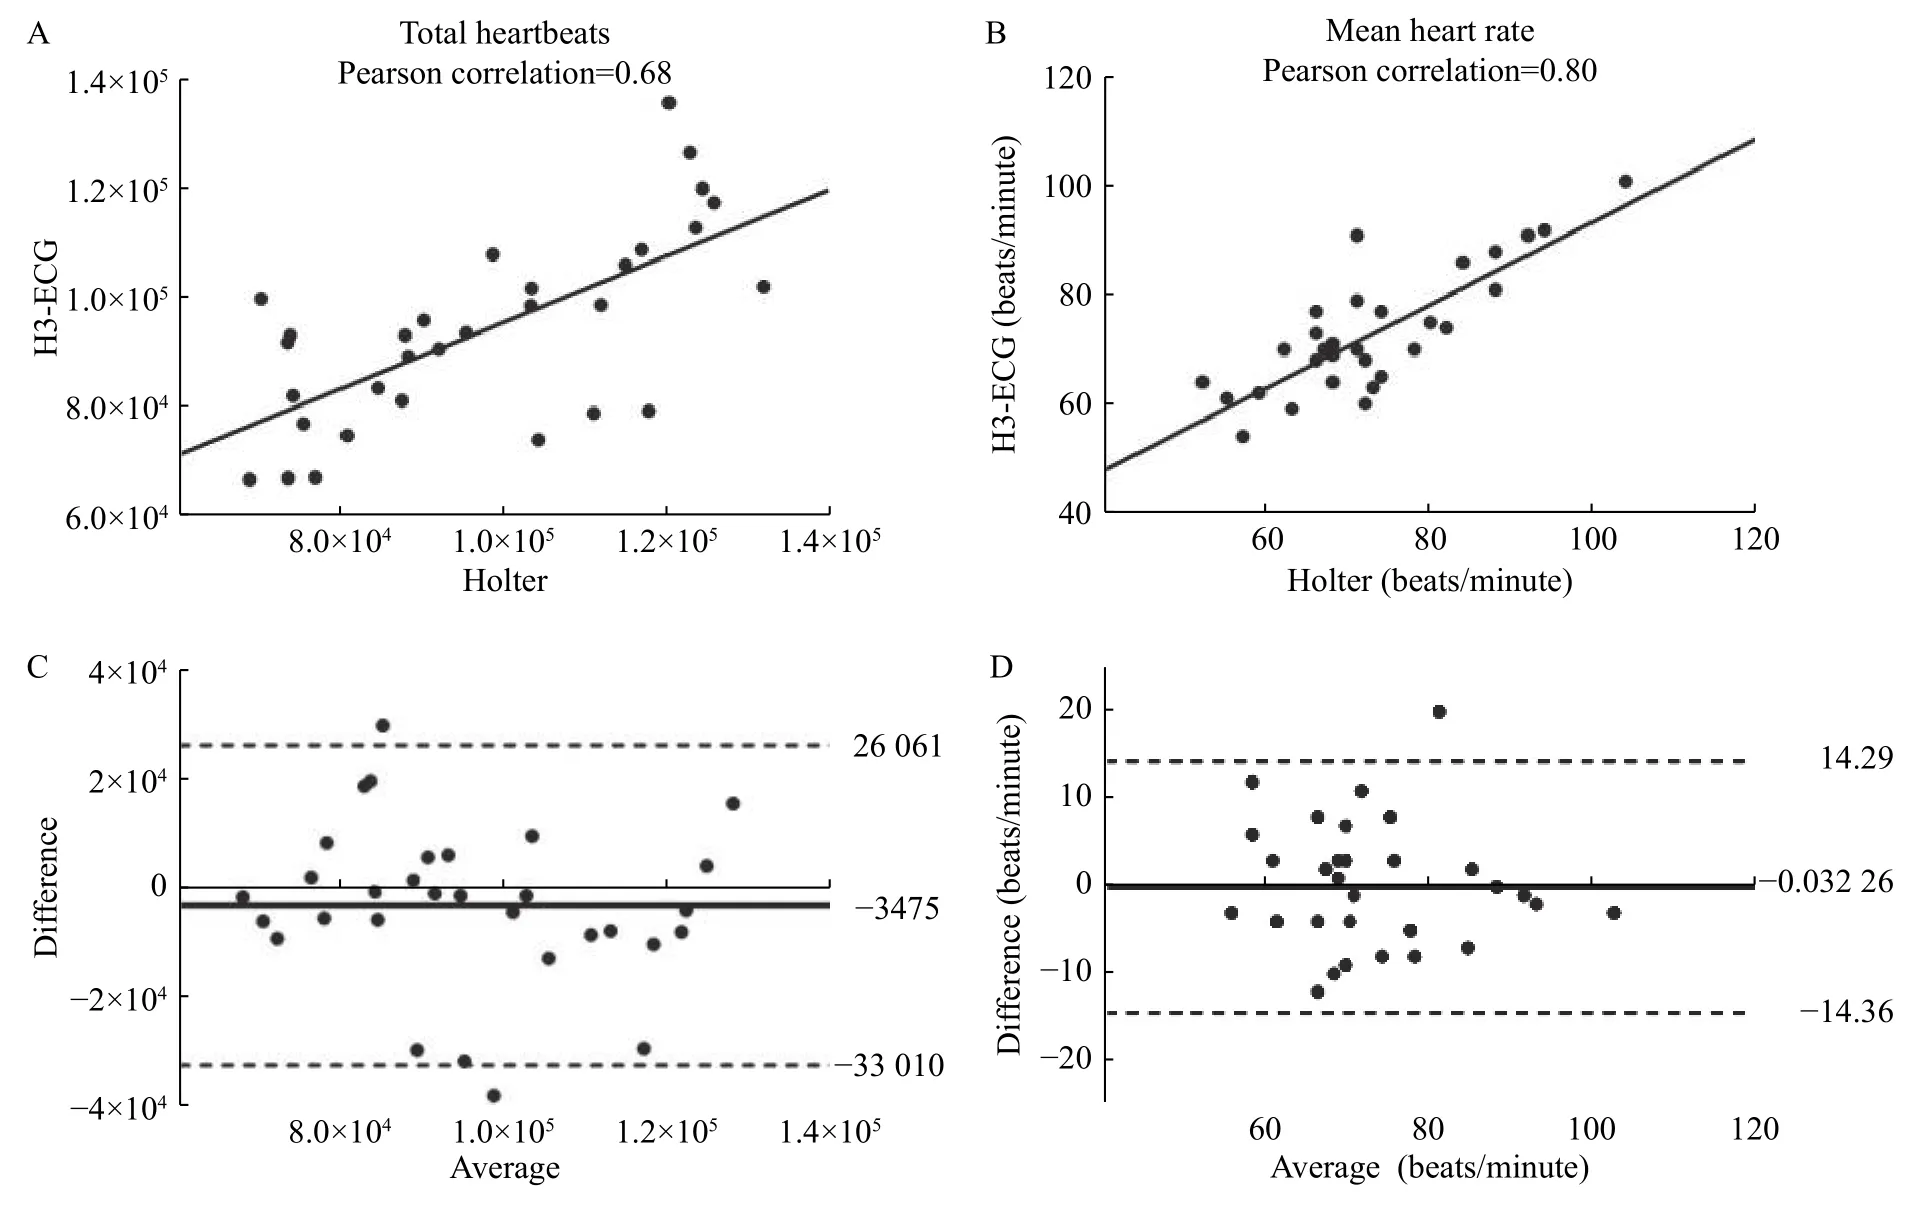
Fig. 3 Pearson correlations and Bland-Altman plots of HR measured by H3-ECG and Holter. A and B: Pearson correlation coefficients were shown for all total HR datasets (A) and mean HR datasets (B). C and D: Each dot represented the paired (H3-ECG and Holter) total HR (C) and mean HR (D) values derived from all participants (n=31). The bias of the measurements (represented as solid lines) and the ±1.96 SD (dotted lines) were presented for the measurements obtained for all total HR and mean HR. HR: heart rate.

Fig. 4 Comparison of results of 24-hour HR, PVCs and PACs detected by H3-ECG and Holter. A–D: Paired t-test was performed to evaluate the results of HR detected by H3-ECG and Holter (n=31). The detected results of 24-hour total HR (P=0.46), maximum HR(P=0.95), minimum HR (P=0.72), and average HR (P=0.99) by the two devices indicated no significant difference (P>0.05). E and F: Paired t-test showed no significant difference between the automatically detected results of PVCs (P=0.91) and PACs (P=0.17) by two devices(P>0.05). PVCs: premature ventricular complexes; PACs: premature atrial complexes.

Table 2 The results of H3-ECG detected the symptom-associated ECG data by automatic reading, compared to that of electrophysiologist-interpreted results
In this study, automatic detection results of 24-hour HRs, PACs and PVCs by H3-ECG were comparable to those by Holter. However, H3-ECG shows superiority over the Holter in real-time teletransmission of ECG signals and capability in capturing the culprit of arrhythmia. In addition, the real-time remote automatic detection results of H3-ECG of cardiac events were superior to AppleWatch with KardiaBand and earlier than Holter"s retrospective detection results, which is similar to previous reported studies[16−17]. Comparative studies have shown that wearable long-term multi-lead devices can obtain more ECG data and detect more cases of AF,symptom-associated arrhythmias, and new onset paroxysmal AF than 24-hour Holter[14−15,18−19]. The H3-ECG device with remote diagnostic supporting system changed the way patients and clinicians operate and interact, reduced the time and cost of patients" trips to and from the hospital compared to Holter.
The H3-ECG is to use wet electrodes to detect potential changes in the local area of the heart, which keeps its performance consistent with traditional Holter.Fig. 2showed that the recorded H3-ECG was comparable and in agreement with those from Holter with respect to the detection of non-sustained atrial tachycardia, ventricular premature complexes with bigeminal rhythm, AF, and ST depression with an inverted T wave. However, the amplitudes of a few P waves and QRS recorded by H3-ECG were lower than those recorded by Holter, which was possibly due to the following aspects: (i) specifically, H3-ECG was recorded from the limb leads ECG, whilst Holter ECG was recorded from the precordial leads; (ii) The filtering algorithm for denoising of wearable devices affected the amplitude of P waves and QRS complexes. Previous studies have shown that the amplitude of ECG waves decreases significantly after noise-filtering[20]; (iii) The increase in impedance of the wearable device and the contact impedance of skin-electrode can reduce the amplitude of the ECG waves.
In this study, the HRs of H3-ECG were automatically detected by a novel fully convolutional neural network algorithm (whose QRS and HR accuracy were 90% and 93% respectively in the China Physiological Signal Challenge 2019 10s segment data set). As shown inFig. 3, the results of the study showed a high correlation between the two signals recorded by the two devices (i.e.Pearson coefficients are 0.68 and 0.80 in term of total HR data sets and mean HR data sets, respectively). As also given byFig. 4, pairedt-test indicated that there was no significant difference between the HRs detected by the two devices. For heart monitors, Terbizanet al[21]suggested a minimum correlation coefficient of 0.9 was clinically reliable. The heart rate detection results of H3-ECG were interpreted as "not reliable", which may be due to the fact that: the noises of the collected ECG signals recorded by the H3-ECG device (the hardware of the device was different from that of Holter) may influence the results of the automatic detection of HRs. Previous studies also show that the detection accuracy of the algorithm decreases with the increasing noise of remote dynamic ECG signals[22−23].The sensitivity and specificity of AF automatic detection in symptom-associated ECG signals remotely transmitted by triple-lead H3-ECG, based on deep learning neural network algorithm, were 94%and 98% (Table 2), which were superior to 93% and 83% by single-lead Apple Watch with KardiaBand,approved by the US Food and Drug Administration(FDA) as prescription and offered marketing authorization in several countries[24].Table 2shows that the sensitivity and specificity of remote capture automatic detection of PACs and PVCs were equally excellent. There was no statistically significant difference between the results of H3-ECG in terms of 24-hour PACs and PVCs detected by a rule-based algorithm and the results of Holter, as shown inFig. 4.Moreover, the distribution of the overestimation PACs extended over a broader range of beats values in H3-ECG than in Holter, which suggested the results of 24-hour premature atrial complexes detected by H3-ECG and Holter "have difference" in individual patients.
In clinic, dynamic ECG monitoring devices vary among traditional (such as Holter), wearable,handheld and implantable, and each has its advantages and disadvantages. The comparison of several kinds of dynamic ECG monitoring devices are shown inTable 3. AliveCor Kardia, a single-lead ECG device with an embedded smartphone, has shown a sensitivity rate of 71.4% to 98.5% and a specificity rate of 91% to 97% for AF in several studies[17,25−26].Triple-lead limb H3-ECG actually records the Ⅰ, Ⅱand Ⅲ lead ECG signals, and the ECG waveforms of avL, avR and avF can be calculated and displayed,which obtains more ECG information than a single-lead ECG device. The H3-ECG device detects not only arrhythmia, but also ischemic abnormalities and change of electrical axis.
As a novel wearable long-term triple-lead device,H3-ECG can be utilized for domiciliary ECG selfmonitoring and remote management of patients with common arrhythmia under medical supervision,owing to its excellency on remote cardiac event automatic detection, 24-hour ECG results comparable to Holter and convenient real-time transmission interaction modes. Further, it is necessary to establish a set of high-accuracy, low-complexity and reliable algorithms which are suitable for real-time remote ECG automatic diagnosis technology. Improving theautomatic detection accuracy meets the requirements of medical heart monitors and reduces the workload of cardiologists" manual error correction and "not reliable" and "different" detection elimination. From a clinical point of view, false detection or missed detection of wearable ECG devices can lead to clinical misdiagnosis or missed diagnosis, which can hinder them from wide use in clinical practices[27−28].
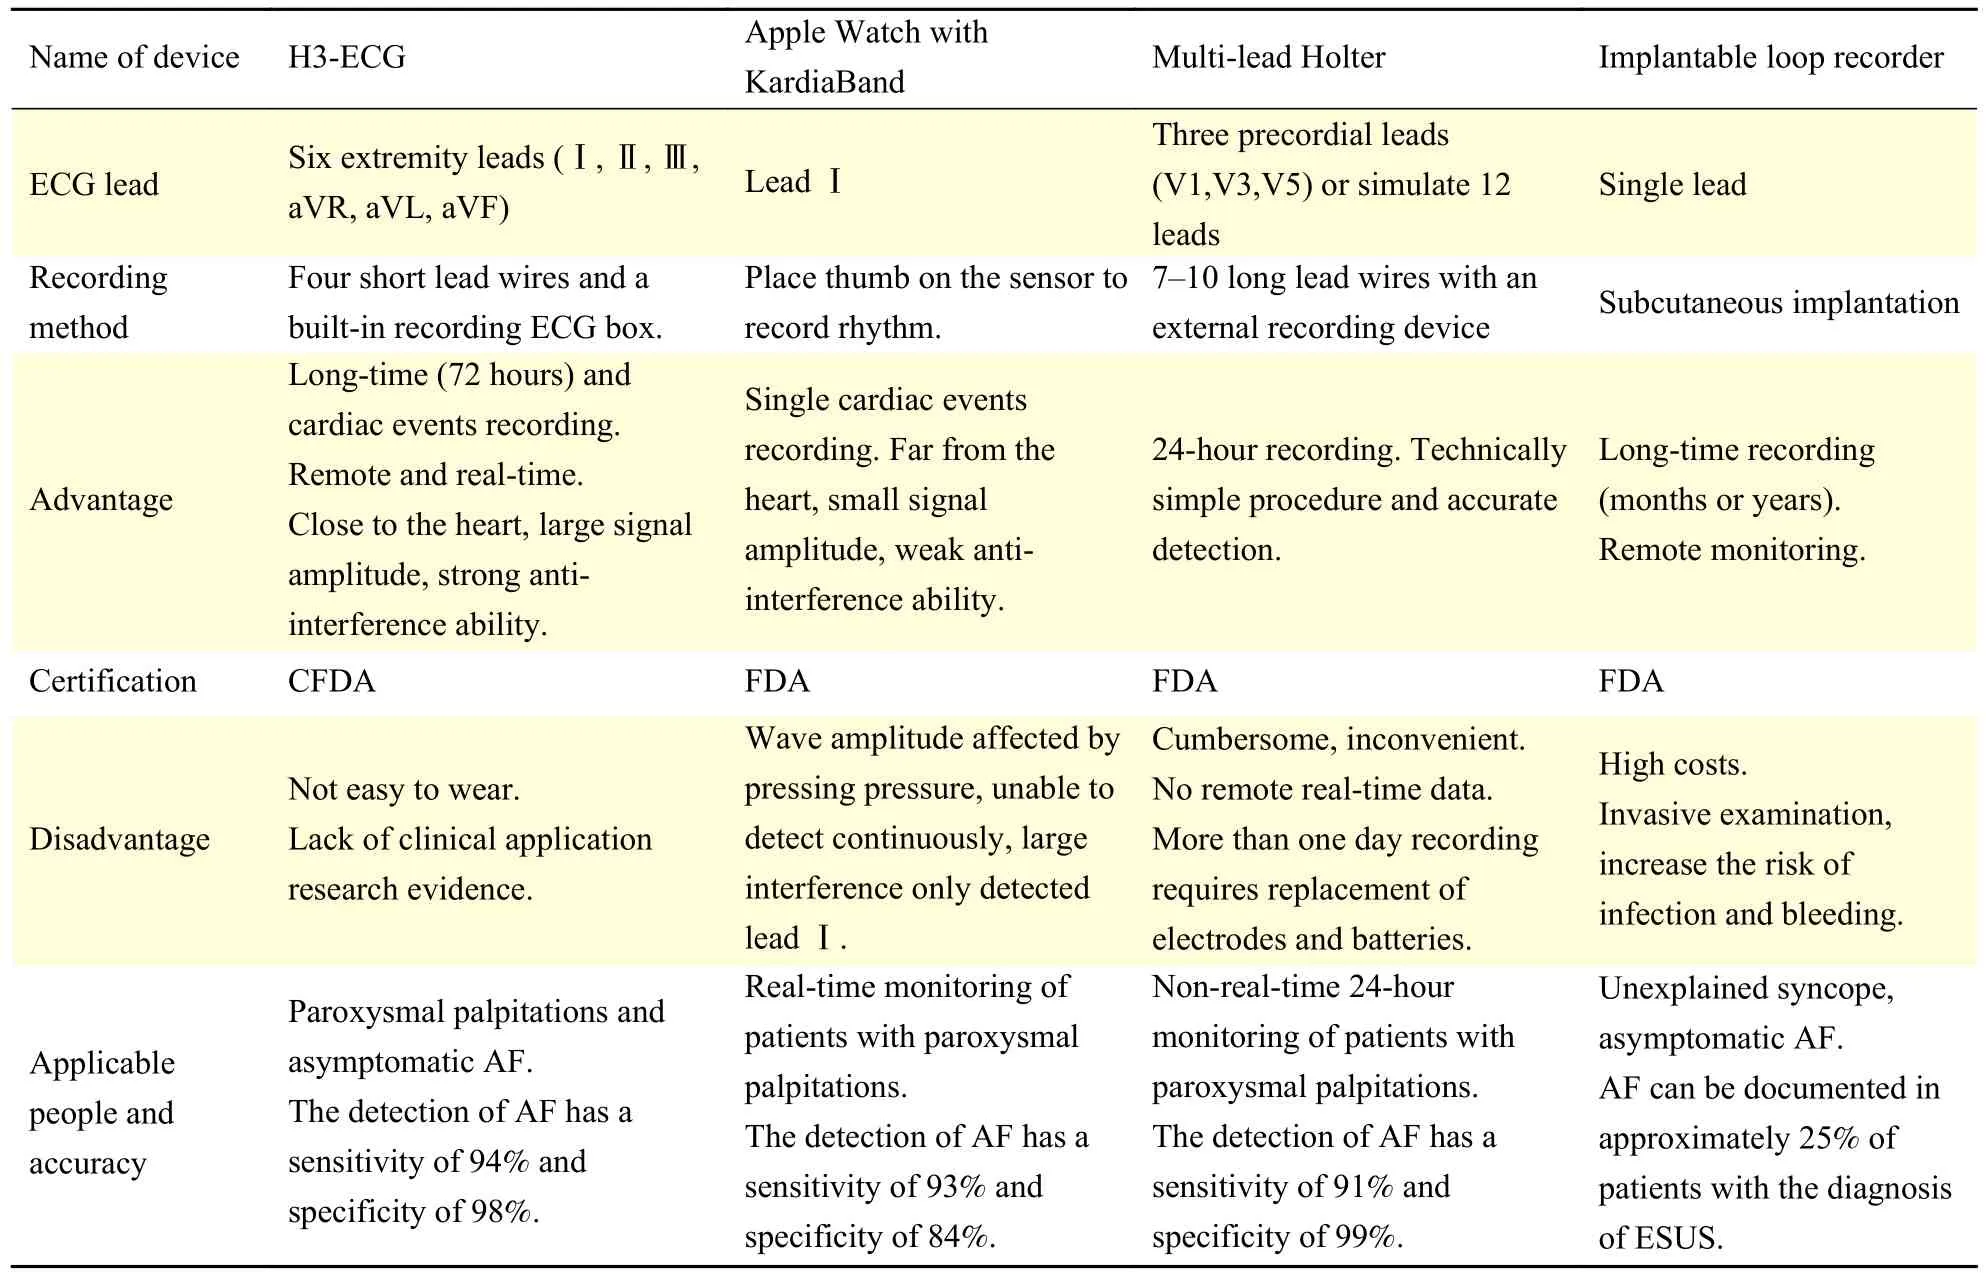
Table 3 Comparison of 4 different dynamic ECG monitoring devices
Although the present study has successfully demonstrated some advantages of the H3-ECG system, there are still some limitations in the present study. The sample size of this study was small and automatic detection of ECG data was conducted on a small data set, which may affect the reliability of the conclusion. Future study on H3-ECG and Holter monitor should be based on more patients with cardiovascular diseases to further investigate the application value of H3-ECG, especially for remote self-monitoring. Moreover, Symptom-associated data capture and automatic detection are based on a fourcategory classification algorithm, which has certain limitations in practice.
Acknowledgments
This research was funded by the Key Research and Development Plan of Jiangsu Province under grant BE2017735. Q.S. conceived the study and wrote the manuscript. Q.S., C.C., H.G., and X.W. collected,analyzed, and interpreted the data. H.G. and X.W.contributed substantially to the development of ECG signal conversion Matlab software and remote automatic detection algorithm. J.L., M.C. and C.L.revised the manuscript, evaluated and supervised the study.
杂志排行
THE JOURNAL OF BIOMEDICAL RESEARCH的其它文章
- Correlation between radiologic features on contrastenhanced CT and pathological tumor grades in pancreatic neuroendocrine neoplasms
- Insulin receptor is implicated in triple-negative breast cancer by decreasing cell mobility
- Fucoidan antagonizes diet-induced obesity and inflammation in mice
- Triclosan inhibits the activation of human periodontal ligament fibroblasts induced by lipopolysaccharide from Porphyromonas gingivalis
- SARS-CoV-2 encoded microRNAs are involved in the process of virus infection and host immune response
- Suppressed estrogen supply via extra-ovarian progesterone receptor membrane component 1 in menopause
