An overview on dry eye disease diagnosis: options for new non-invasive testing technologies
2021-06-04ZengFangYuLongZhong2DanLiXiaoShuangZhaoJunGuoDuan
Zeng-Fang Yu, A-Long Zhong2, Dan Li, Xiao-Shuang Zhao, Jun-Guo Duan
Abstract
•This literature review intends to provide an overview of the new non-invasive testing technologies and their role in the diagnosis of dry eye disease (DED). Including imaging technologies of tear volume, tear film stability, meibomian glands morphology and function, corneal morphology, biomarkers and ocular surface temperature, as well as tear osmolarity, optical quality, blinking test and so on. New testing technologies can provide an indirect and objective assessment of the ocular surface, tear condition and visual quality. Testing technologies, such as tear volume, meibography and tear osmolarity have been widely recognized and applied in clinical practice, showing higher specificity and sensitivity than traditional tests. Others, such as strip meniscometry, interferometer, light scattering technology, double-pass system, blinking test and so on, are currently in the stage of clinical research and improvement, and may translate to routine clinical detection techniques in the future. The new non-invasive testing technologies can non-invasively evaluate the ocular surface and tears, and measure the changes of components related to the disease, which play an important role in the diagnosis, classification, clinical management and curative effect evaluation of DED.
•KEYWORDS:dry eye disease; non-invasive; testing technologies; diagnosis
INTRODUCTION
The report of the International Workshop on Dry Eye Disease (DED) published in 2017 defines as a multi-factor eye ocular disease characterized by loss of homeostasis of tear film, ocular symptoms, tear film instability, hyperosmolarity, ocular surface inflammation and damage, and neurosensory abnormalities play an etiological role[1]. It is mainly divided into: evaporative dry eye and aqueous deficient dry eye, and the severity grading also used as the classification standard. A 5-year natural history study found that patients with mild to moderate DED showed a striking disease burden due to blurred vision, low productivity and ophthalmic visits, which not only caused eye surface damage, but also affected patients’ quality of life and visual function[2].
However, the patients diagnosed DED according to the consensus of clinical signs, only 57% reported symptoms consistent with the diagnosis of DED[3]. According to clinical practice and research, no consistent relationship was found between signs and symptoms of DED[4], and the main influencing factors are increased age, Sjögren’s disease, chronic pain syndrome, depression and other systemic diseases, which cause some difficulties in the diagnosis and management of DED[5].The lengthy nature of the classical tests, irritation and intrusiveness, subjectivity, great differences in day-to-day results, as well as its unreliable and largely irreproducible nature may cause the high risk of underdiagnosis[6-10]. In addition, studies show that there is a low and inconsistent association between symptoms and tear osmolarity, tear break up time (TBUT), Schirmer test, corneal and conjunctival fluorescein staining, meibomian gland grading[11-12]. These are the main problems in the diagnosis and management of dry eyes. Based on the above reasons, there is no diagnostic gold standard of DED[13]. The new non-invasive testing technologies, which can provide objective testing parameters and show consistent association with symptoms and signs of DED, are required by clinic. This article will review the present situation, progress and clinical application value of the new non-invasive testing technologies of DED, so as to provide reference for the clinical practice of DED.
TearFilmOsmolarityIn the International Workshop on Dry Eye Disease published in 2017, hyperosmotic condition is major pathogenic factor in DED[1]. Regardless of the cause of DED, tear film osmolarity is considered to be a global indicator of DED[14-18]. Hyperosmolar tears can activate the inflammatory pathway and initiate the release of cytokines, resulting in corneal epithelial damage and goblet cell loss[19-22]. Conversely, ocular surface inflammation may also generate hyperosmolar tears by affecting the formation, composition, or stability of the tear film[23-24].
Using TearLab tear osmolarity system, it was found that tear osmolarity was strongly correlated with fluorescein tear break up time (FTBUT) and ocular surface disease index (OSDI), and increased with the aggravation of symptoms, which played a positive role in the grading of DED severity[25]. When the reference value is about 316 mOsmol/L, it has a sensitivity of 87% and a specificity of 81% for the diagnosis of moderate to severe keratoconjunctivitis sicca[26]. It is highly sensitive to differentiate from anterior blepharitis, allergic conjunctivitis and other ocular surface diseases[27]. Large differences in tear osmolarity between eyes are often considered to be a characteristic manifestation of DED[28]. However, some studies[29]used the methods of controlling relative humidity and measuring after eye closure to control the clinic conditions, and found that there was no significant difference in inter-eye variability in tear osmolarity (tOsm) of patients with DED (eye closure 0.809% RH paired 0.170). Suppression of tear evaporation reduced the influencing factors of tear osmolarity, which showed the characteristics of tear osmolarity in patients with DED.
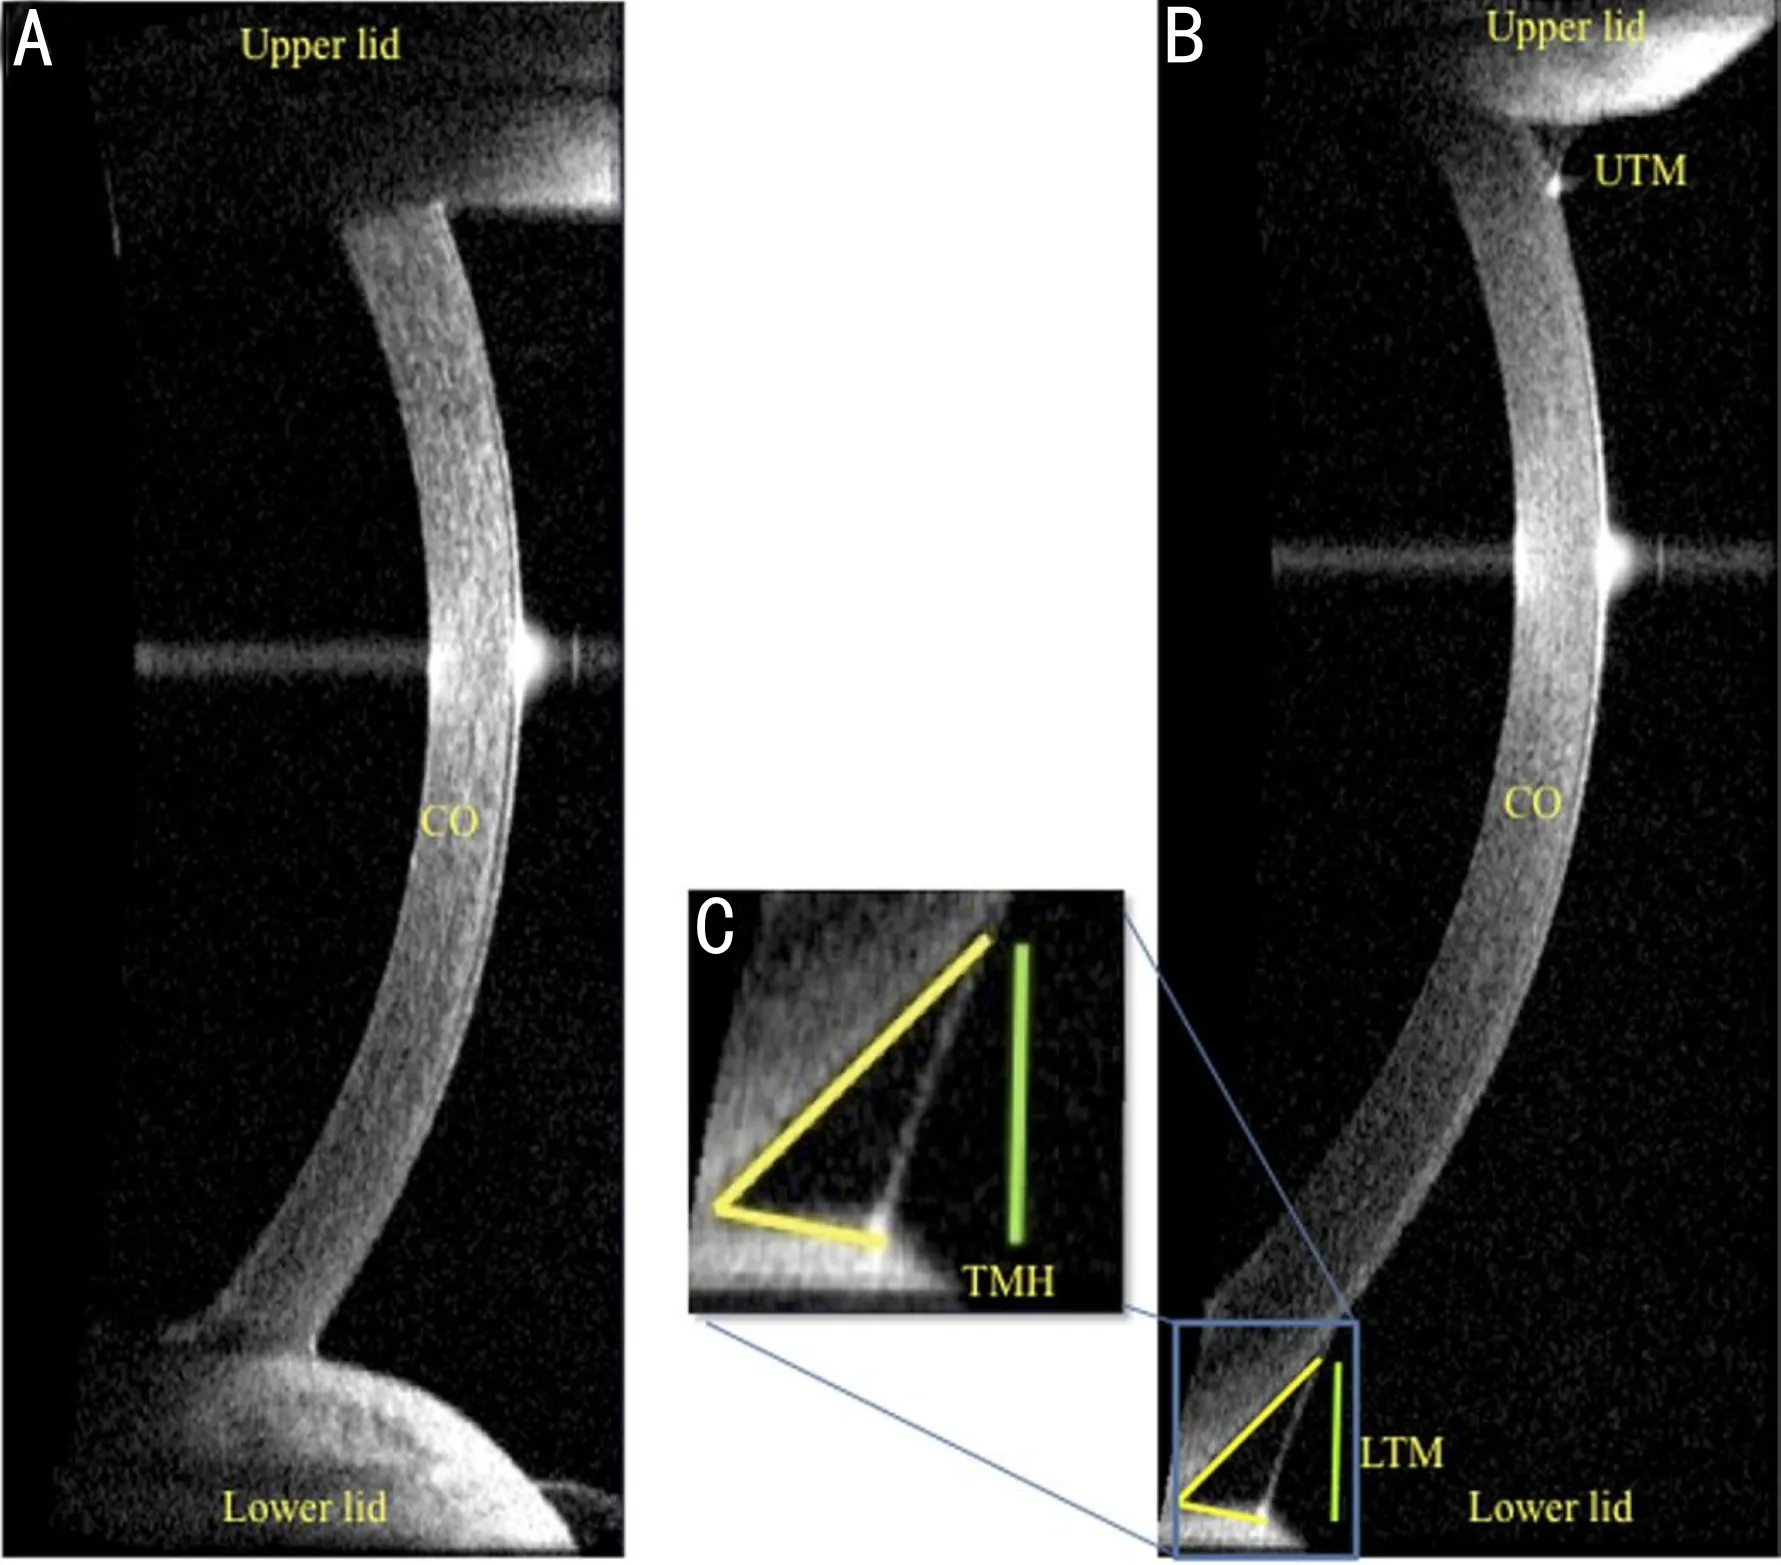
Figure 1 Visante optical coherence tomography images A: Dry eye patient; B: Healthy subject; C: Yellow lines delineate the corneal surface and lower lid margin. The green perpendicular line indicates the tear meniscus height (TMH) processed in the digital imaging software.
TearVolumeThe quantitative appraisal of tear meniscus is the most direct way to evaluate tear film volume at present[1]. Tear meniscus height (TMH), Tear meniscus radius (TMR) and Tear meniscus area (TMA) show good diagnostic accuracy[30-33]. This section mainly introduces optical coherence tomography (OCT), Keratograph Measurements (KM), interferometer, strip meniscometry(SM).
ImagingtechnologyOCT can obtain the optical coherence tomography image of each object. The software was used to identify the boundary between eyelid, cornea and tear meniscus elements, delineate the parameter of the meniscus area and height, process and calculate TMH and TMA (Figure 1). The OCT TMH measurements significantly correlated with slit-lamp TMH assessment, SM value, tear functions, corneal staining scores and Schirmer test, and when the cutoff value of lower TMH was set at < 0.30 mm, the sensitivity and specificity for the diagnosis of DED were 67% and 81%[34], and similar results were obtained in several other studies[35-40]. In order to make the TMH value more real and reliable, researchers developed software using automatic segmentation algorithm, which can not only realize automatic measurement, but also deal with artifacts caused by camera saturation and irregular anatomical shapes in various situations[41]. Similar algorithms are also applied to slit-lamp TMH measurement[42].
The Keratograph TMH shows a strong correlation with the OCT TMH[43-44]. The TMH and Non-invasive tear film break-up time (NIKBUTs) measured by this technique have good repeatability and reliability in the diagnosis of DED[45-46]. The study recommends that TMH should be measured before tests that forced eye opening to avoid reflex tear secretion[47].
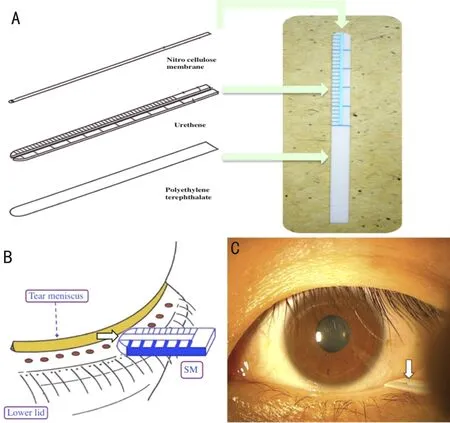
The tear meniscus digital image was captured by DR-1α dry eye monitor, and the TMH was analyzed by Meniscus Processor software. When the cut off value was 0.22 mm, the sensitivity and specificity for the diagnosis of DED wereFigure 2 Strip meniscometry techniqueA: The strip is composed of polyethylene terephthalate, on which a urethane-based material of the same size containing a central ditch of 0.40 mm in depth is pasted. A nitrocellulose membrane filter paper strip with a pore size of 8 μm impregnated in natural blue dye 1 is then placed into the central ditch; B: The strip is applied to the lateral lower lid tear meniscus without touching the ocular surface; C: Arrow: length of the stained tear column in the central membrane ditch, regarded as the SM value.
84.1% and 90.9%[48]. The values for TMH measured by tear interferometer (DR-1α) showed a high consistency with the THM value measured by swept source optical coherence tomography (SS-OCT), and significantly correlated with Schirmer test. In addition, the tear interferometry with the DR-1α system allows measuring the lipid layer of tear film automatically meanwhile, and the balance between lipid layer and aqueous layer can be monitored, which can guide the diagnosis and subtype differentiation of DED[49].
StripmeniscometrytechniqueSM is a strip tool made of suction material, which can be obtained in 5s without touching the tear film (without topical anesthesia) and without inserting into the conjunctival sac (Figure 2)[50]. It was strongly correlated with Schirmer test, tear film breakup time, ocular surface staining scores and lipid layer of tear film[51-52]. And it did not cause reflex tear secretion, combined with FTBUT test assessment of DED showed to be a sensitive approach[50]. The improved SM Tube (Strip Meniscometry Tube), not only show more better absorb features, but also test a single strip in both eyes at the same time, which shows a significant correlation with TMH (r=0.82) and TMA (r=0.86), but its repeatability needs to be further verified[53].
Imaging technology and auxiliary software processing digital images are the main testing methods of tear volume. SM, as a technology with less stimulation and short testing time, is still in the research stage, and its clinical universality and repeatability need to be further confirmed.
TearFilmStability“Tear film instability” was included in the definition of DED by International Workshop on DED[1]. Impaired tear film stability is one of the basic criteria for the diagnosis of tear film abnormalities[14]. This paragraph mainly introduces Keratograph, interferometry, infrared thermography, Wavefront sensors and keratoscopy are also used to assess tear film stability.
Non-invasivetearfilmbreakuptime(NI-BUT)When the cutoff value of NI-BUT, measured by Keratograph was <2.65s, the sensitivity and specificity for the diagnosis of DED were 84.1% and 75.6%, respectively, and showed a good correlation with other dry eye examinations[54]. The noninvasive keratograph break up time (NIKBUT), automatically measured by Keratograph showed better discriminative ability than FIBUT in testing DED[55]. NIBUT is a common method to assess the stability of tear film, but its sensitivity and specificity for the diagnosis of DED vary with specific techniques, and it is recommended that testing before other invasive examinations (corneal staining,etc.), and the automatic detection system is more stable.
ThicknessoflipidlayeroftearfilmInterferometry is based on the measurement of wavelength-dependent fringes. The difference in the reflection optical path between the surface of the tear film and the junction between the tear film and the cornea will produce interference waves, which can be indicated by the thickness of the tear film precornea[56]. For lipid layer thickness (LLT) cutoff value of ≤75 nm, the sensitivity and specificity for diagnosis of meibomian gland dysfunction (MGD) were 65.8% and 63.4%[57]. In combination with 5 m keratometer LTMH, it’s sensitivity and specificity were increased to 80.2% and 74.1%[58]. In addition, compared with dry eye syndrome without MGD, it was also found that the LLT of hyposecretory MGD was thinner (45.2±11.6 nm), and the LLT of hypersecretory MGD was thicker (93.5±12.6 nm)[59]. The interferometer calculates the average thickness of the lipid layer of the tear film, but if the damaged position of the tear film is covered by the eyelid during monitoring, the damaged area of the tear film may not be fully evaluated.
Ocularsurfacetemperature-ocularsurfacethermographerIn healthy people, due to the quality and quantity of tears and the stability of tear film, the ocular surface temperature (OST) has no diurnal change, while in patients with DED, tear evaporation increases due to tear film instability, resulting in the decrease of OST. Ophthalmic thermography detected the decrease in OST of patients with dry eyes significantly greater than healthy eyes after opening their eyes for 10s. The sensitivity and specificity for the indicators of DED were 83% and 80%, respectively, and were significantly correlated with FTBUT (r=0.572)[48]. The maximum temperature variation was performed in the central cornea, which is an important area to study the cooling rate[60]. Some studies take the temperature difference values (TDV) and the compactness value (CV) as observation parameters, which represent the changes of tear film temperature and the degrees of stability,respectively. The sensitivity and specificity for the diagnosis of DED are 84% and 83%, respectively[61]. However, the performance of the absolute temperature of the ocular surface is limited and cannot be used for the diagnosis and evaluation of DED alone[62]. At present, infrared thermography seems to be immature in the diagnosis of dry eyes, and further clinical studies are needed to verify its reliability and repeatability.
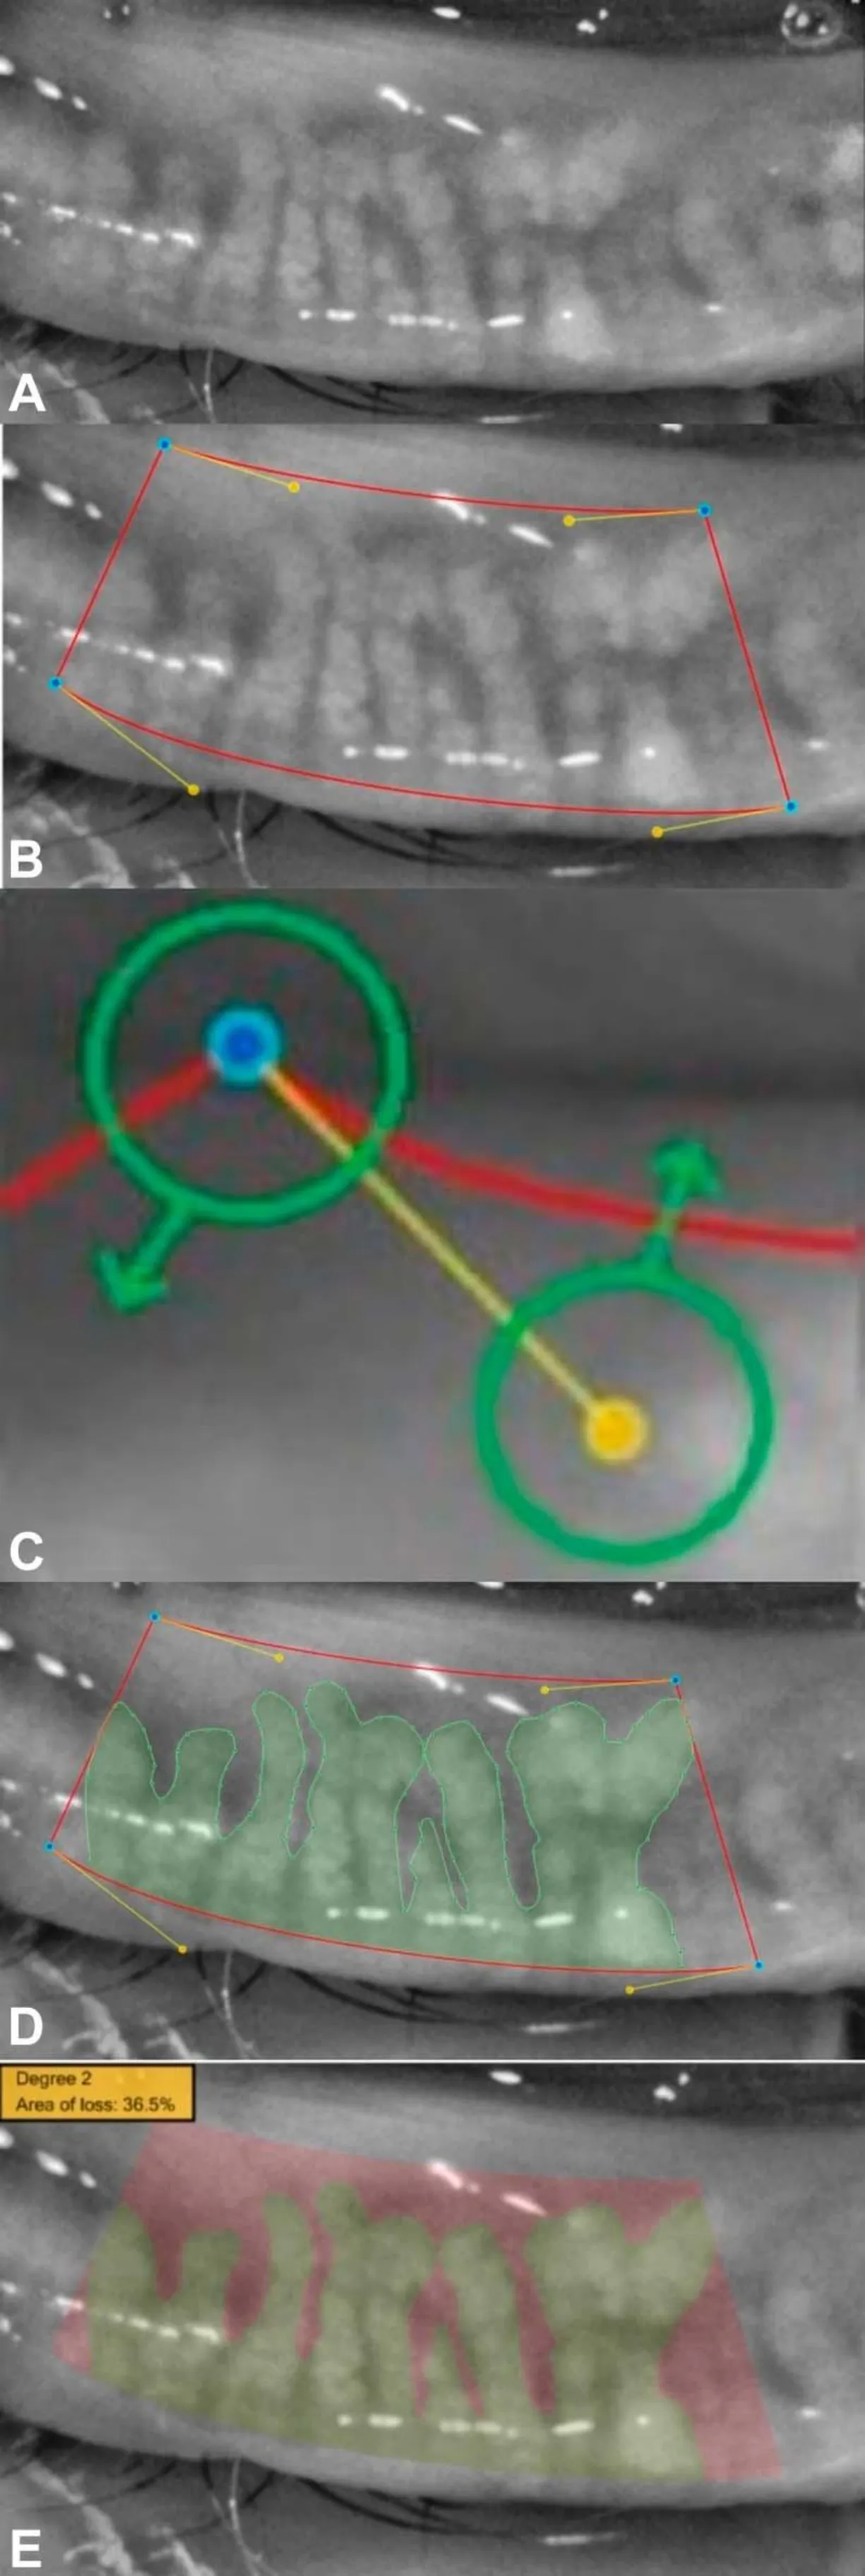
Figure 3 Sirius meibography infrared imaging and visual documentation of the glands from lower eyelid of a patient A: Infrared imaging and visual documentation of the glands from lower eyelid of a patient; B: The lower eyelid is selected, and blue points are placed to build a trapezoidal shape with exclusion of the lid areas that are not completely reverted; C: The shape is adjusted moving yellow or blue points. Yellow points modify the red curve’s tension.
MorphologyofMeibomianGlandMeibomian gland morphology is an early sensitive index of abnormal meibomian gland function[63], which plays an important role in evaluating the subtype and severity of MGD[64]. There are mainly infrared meibography, OCT,invivoconfocal microscopy (IVCM), in addition, keratograph and interferometry have also been studied.
InfraredmeibographyjointOCTJapanese scholar Aritaetal[65-66]used infrared meibography and infrared charge-coupled camera equipment combined with tear interferometry to assess the meibomian gland and tear film lipid layer, which provided reliable clinical information for the diagnosis of evaporative dry eye or MGD. Sirius meibography (Figure 3) system can assess the severity of MGD according to the loss of meibomian gland area[67]. Combined with OCT, we can observe not only the changes of length and width of meibomian gland, but also the lid margin abnormality and the of lipid layer thickness, so as to comprehensively assess the ocular surface[68-70]. Oculus Keratograph 4 (Figure 4) infrared meibography can clarify the structure of MG[71], and it is found that the loss of meibomian gland is more serious in patients with SS[72]. Oculus Keratograph 5 can assess the severity level of MGD, and its sensitivity and specificity for the diagnosis of MGD are 93% and 97%, respectively[73]. However, the researchers recommend that the Keratograph 5M and LipiView II should not be used interchangeably to assess MG dropout, because there are differences in the amount of eyelid overturning and image quality, and there are varying amounts of MG dropout[74].
Invivoconfocalmicroscopy(IVCM)MG fibrosis, size, density and the status of inflammation cells can be observed by IVCM, and the more severe the symptoms are, the more significant the MG fibrosis and severer decrease in the size of acinar unit of MG[75]. Using IVCM to establish MGD classification, the type 1: meibomian gland obstruction with clear epithelium and uneven meibum reflectivity; the type 2: intraepithelial or interglandular inflammation of MG without fibrosis; the type 3: meibomian gland fibrosis. This objective classification helps to deepen the understanding of patients’ symptoms and evaluate the curative effect more accurately[76].
VisualQualityIn the early 1990s, Rieger[77]first proved the importance of precorneal tear film in optical imaging by comparing the vision and static perimetry of patients with DED. Since then, the effect of tear film on contrast sensitivity has been the focus of research[78-79]. The optical aberration caused by DED is related to tear film instability[80], but because most patients with DED have a good best-corrected visual acuity, and it is difficult to detect the decline of visual function by traditional vision tests, it is not found that visual function has been impaired until the late stage of DED or severe cases[81]. Wavefront sensors and corneal topography are the main detection techniques to assess optical quality objectively and quantitatively. In people’s eyes, aberration and light scattering are the main factors leading to optical quality degradation.
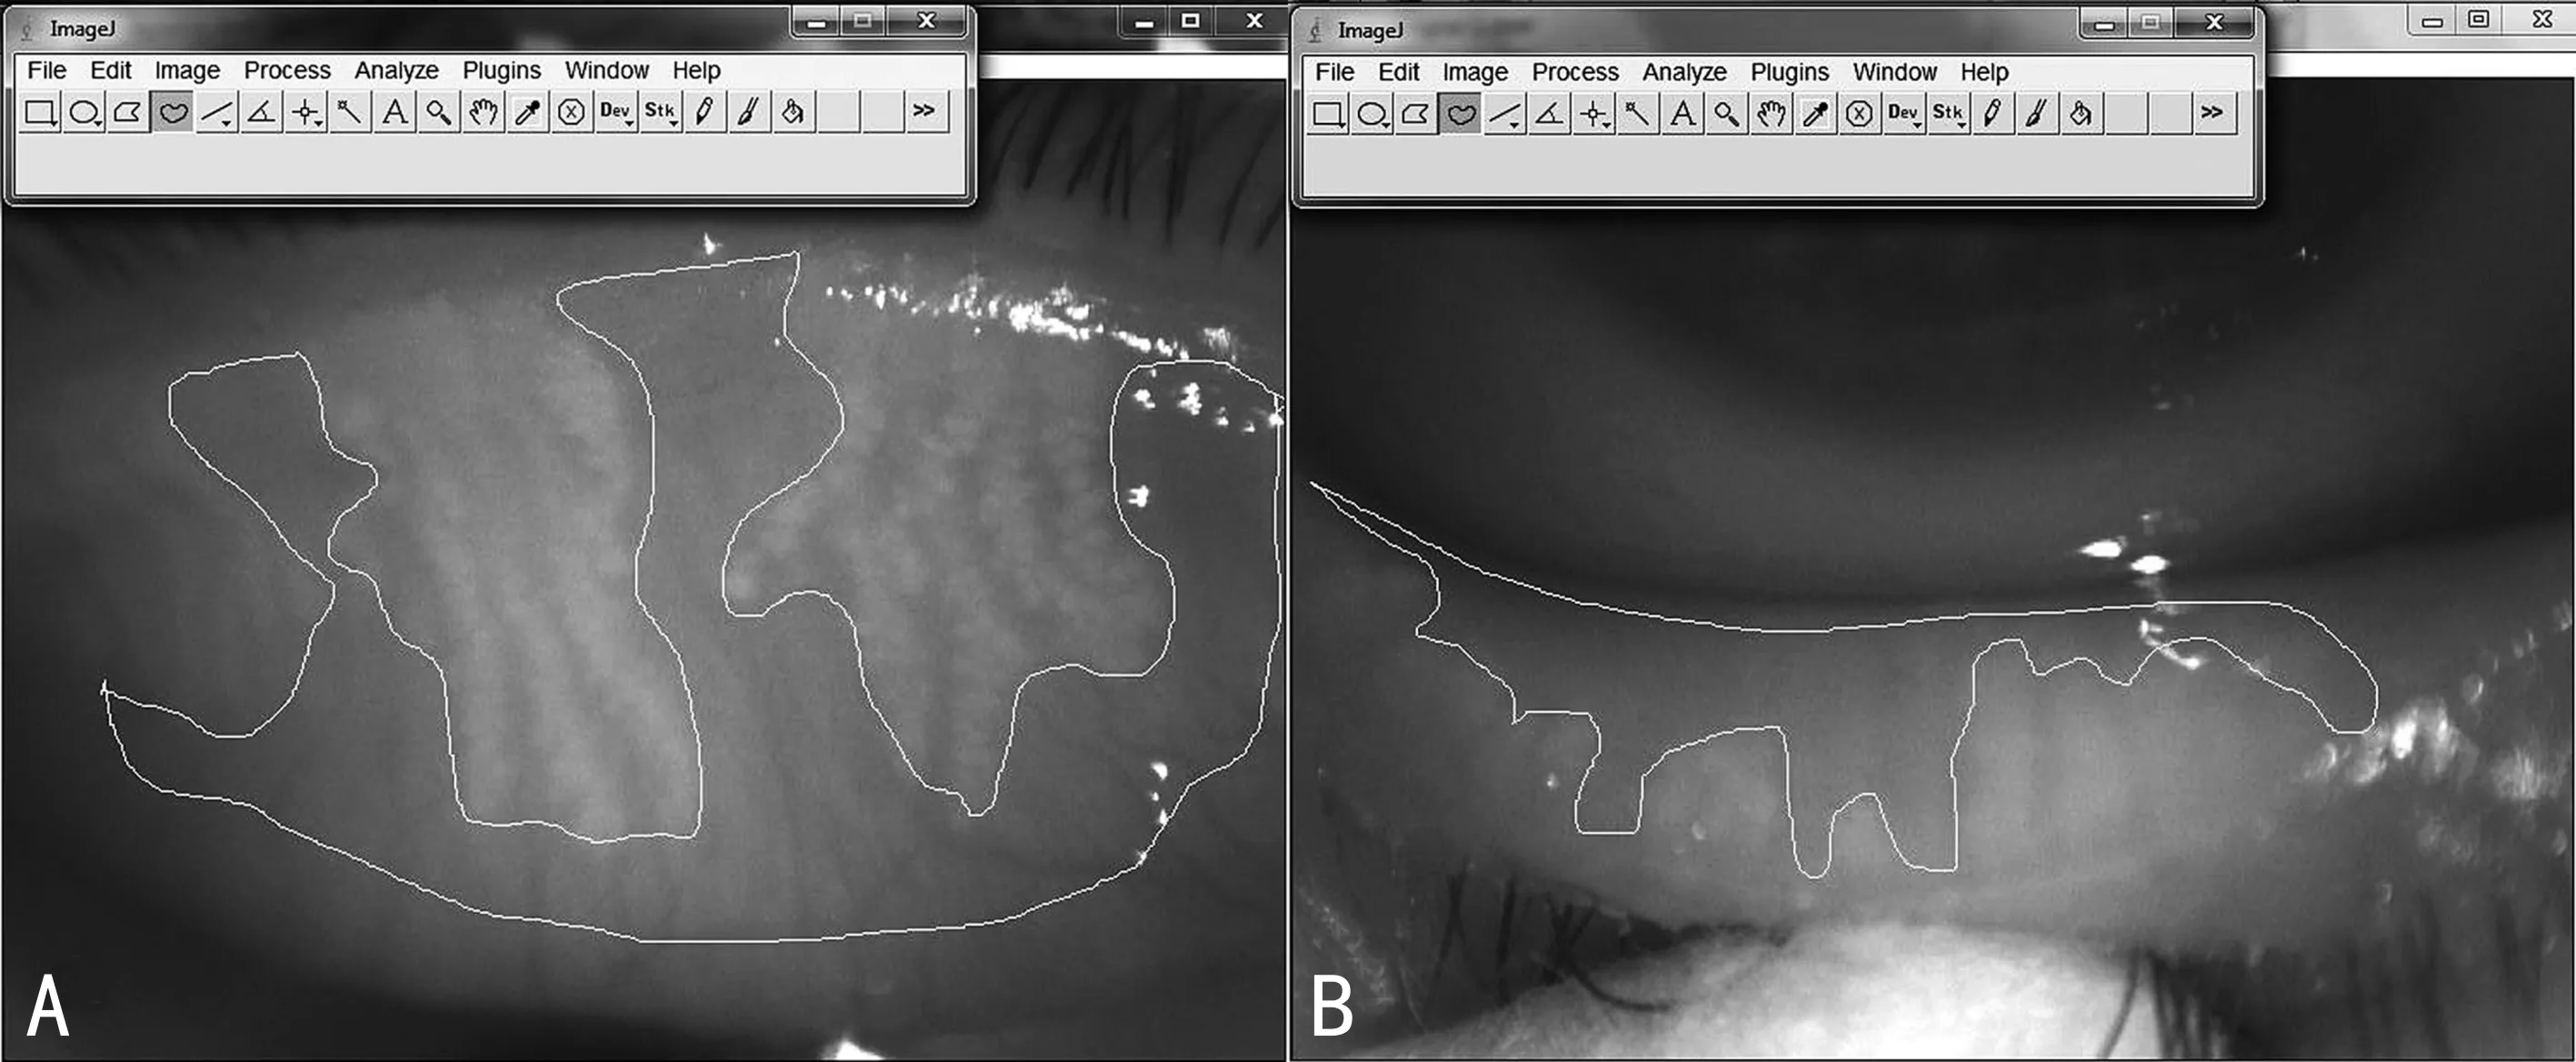
Figure 4 Oculus Keratograph 4 ophthalmic thermography digital analysis of images using ImageJ software A: Calculation of meibomian gland loss in the upper lid; B: Calculation of meibomian gland loss in the lower lid.

Figure 5 C-Quant equipment A: C-Quant equipment; B: An example of test fields observed inside the C-Quant ocular opening.
Aberration-wavefrontsensingAberrations are caused by irregularities of refractive surface in the anterior / posterior surface of the cornea and/or in the precorneal tear film. Including lower-order components and higher-order components, high-order aberrations (HOA) is quantized irregular astigmatism[81]. Corneal topography are used to assess the corneal irregular astigmatism, wavefront sensing can measure the refractive status of the entire optical system of the eye, including irregular astigmatism[82-83]. HOA is affected by tear film rupture mode, so some studies have proposed to use mathematical models of tear film dynamics during the blink cycle to improve the diagnostic performance of DED[84].
Lightscattering-C-QuanandHDanalyzerLight scattering includes forward light scattering and backward light scattering. In clinical practice, forward light scattering is more often associated with visual discomfort than backward light scattering. Forward light scattering is often measured using a double-pass imaging technique or with stray light meter. The two measurement techniques show good repeatability, reproducibility and comparability[85]. The C-Quan (Oculus) straylight meter makes a subjective assessment based on the compensation method (Figure 5)[86]. The process is repeated several times with different levels of compensation light. Higher log(s) values indicate more straylight[87]. The study found that log(s) in DED was greater[88], and the corneal backward light scattering increased when cSPK covered the optical area[89]. In addition, the log value showed a moderate correlation with the traditional quality of vision tests (VF-14 questionnaire and LOCS III)[90]. But C-Quant uses a psychophysical methodology, which depends entirely on the response of the subjects, in which misunderstandings of instructions may lead to straylight values that far exceed expectations, so measurements need to be repeated many times to reduce bias.
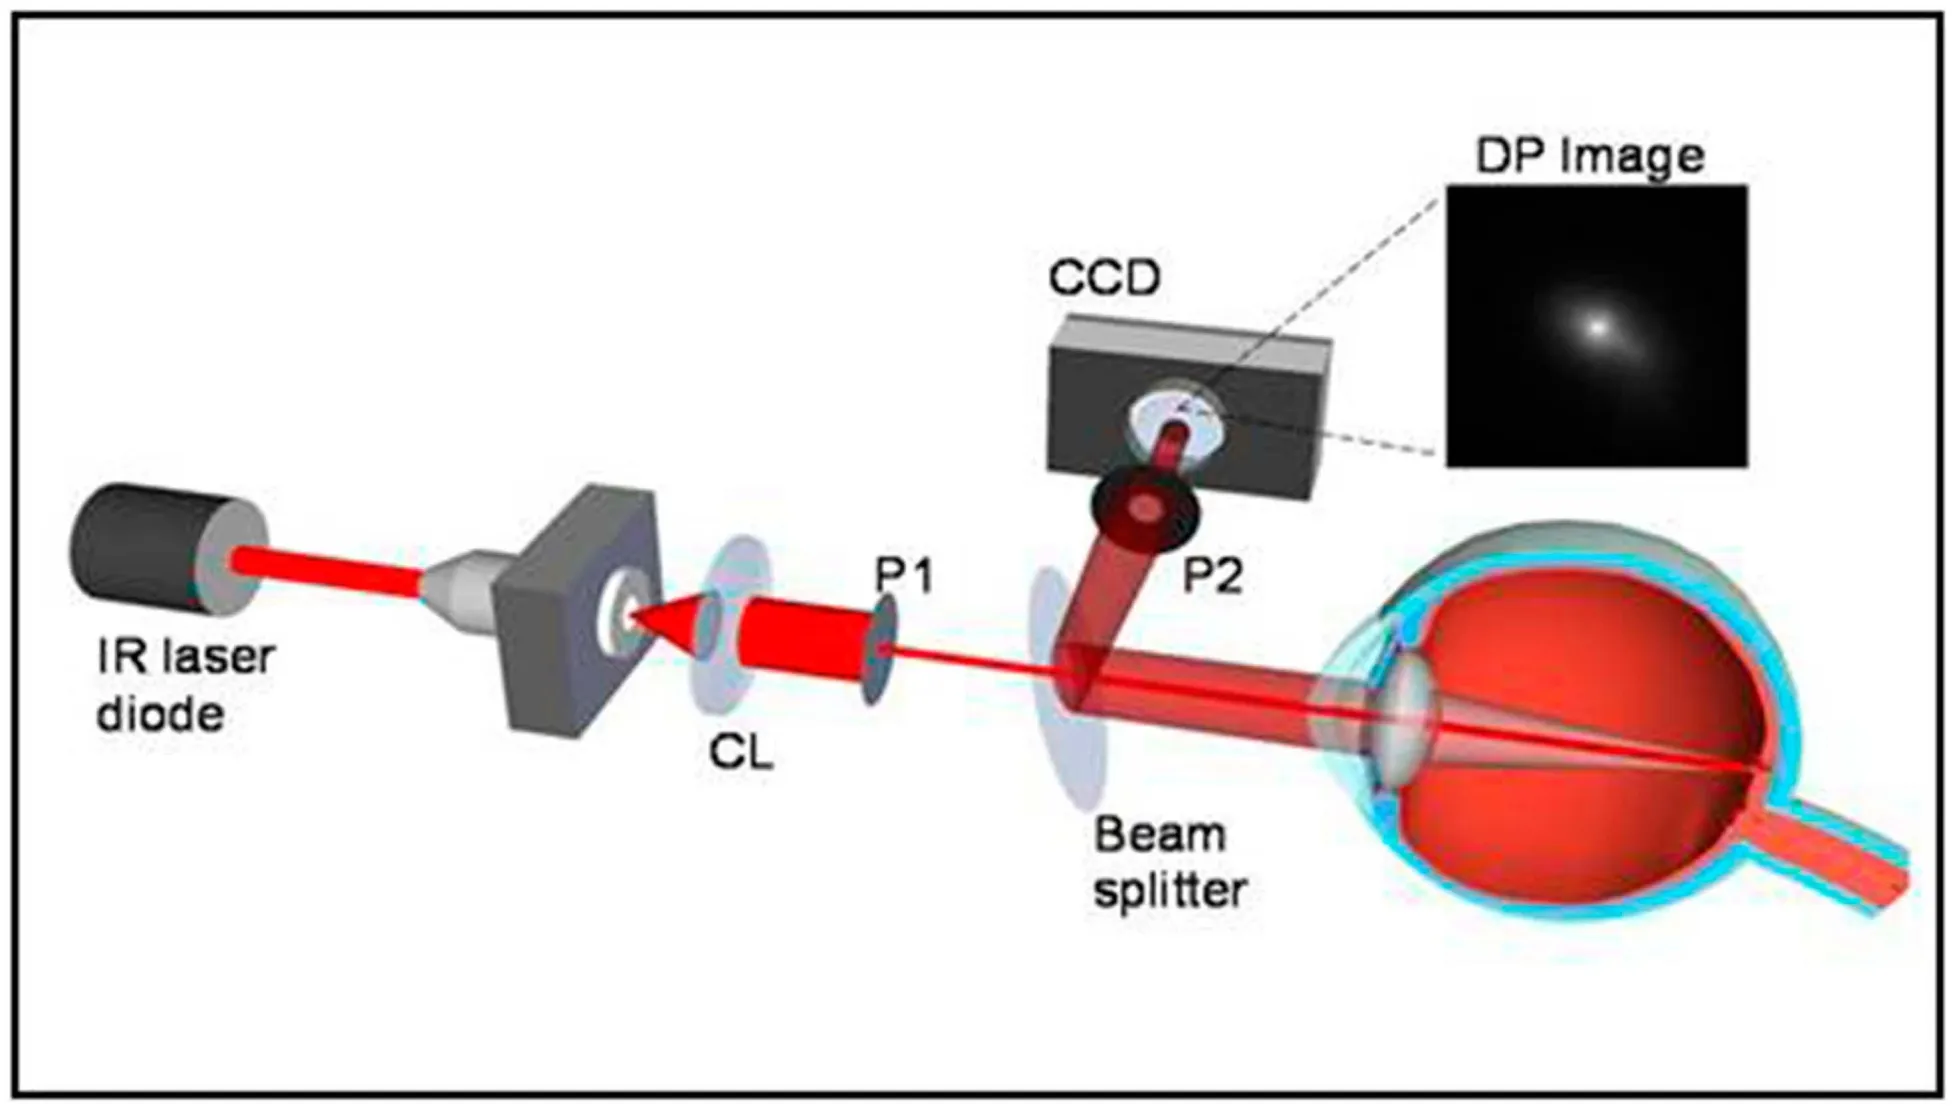
Figure 6 Retinal point spread function measured by the HD Analyzer The HD Analyzer can measures the retinal point spread function by a double-pass method. In this way, the complete optical transfer function of the eye and the shape of the retinal point spread function can be inferred.
The HD Analyzer (previously OQAS) from Visiometrics makes an objective assessment based on the double-pass method (Figure 6)[91], in which the “Tear Film Analysis” program records the dynamic changes of OSI under the pupil of 4.0 mm[92]. It was found that the ocular scattering of patients with DED was higher, and the increase rate of OSI was faster, while the mean objective scatter index (ΔOSI) and ΔOSI/ time could reflect the severity of DED and significantly correlated with TBUT and corneal staining[92]. In addition, three modes of OSI dynamic changes in DED patients were observed (Figure 7): OSI continued to increase; OSI was unstable without improvement after blinking; OSI was steady high[93]. The Optical Quality Analysis System II (Visiometrics S.L., Tarrasa, Spain) measured at 7.0 mm aperture, observed four modes of OSI dynamic changes of asymptomatic subjects, in which it was important to identify B1 (ascending order-low value) and B2 (ascending order-high value) because they were in the preclinical stage and had a higher risk of developing dry eye symptoms[94]. Tear film OSI (TF-OSI) can eliminate the influence of other refractive media and is positively correlated with tear film lipid thickness, the specificity and sensitivity for the diagnosis of DED are 73.6% and 76.2%, respectively[95]. However, the correlation coefficients of OSI and TBUT, OSDI and Schirmer tests were all low[96], and the correlation with subjective symptoms of DED remains to be resolved, which is a challenge[97].
OcularSurfaceInjuryOcular surface injury is mainly manifested in corneal injury. IVCM and ultra-high resolution optical coherence tomography (UHR-OCT) can be used to assess the morphology and structure of corneal cells, which can be used for DED screening, curative effect evaluation and follow-up.
InvivoconfocalmicroscopyThe microscopic changes of corneal tissue caused by DED, such as surface epithelium changes, anterior stromal hyperreflectivity and subepithelial nerve, can be observed by IVCM[98]. IVCM can be used to evaluate the pathological changes ofinvivotissue at the cellular level, not only to evaluate morphology, including corneal/conjunctival cell density, acinar unit density of meibomian gland and lacrimal gland, acinar unit diameter, nerve fiber density and inflammatory cell density, but also evaluate cell structure by observing nucleus, cytoplasm and cell boundary, including nuclear/cytoplasmic ratio. IVCM observed a decrease in nerve fiber density, an increase in nerve tortuosity, a decrease in reflectivity and a higher density of inflammatory dendritic cells (DCs) in Sjögren’s syndrome dry eyes and non-Sjögren’s dry eyes (NSDE)[99]. Grading of corneal subbasal nerves can be used to evaluate the pathophysiologic conditions and severity of the disease, showing a significant correlation with symptoms (sensitivity to light, OSDI, painful eye, blurred vision)[100]. In recent years, it has been found that the corneal nerve fiber width (CNFW) value has the highest diagnostic ability in distinguishing patients with DED (AUC=0.828). When diagnosing DED based on either CNFW or corneal nerve branch density (CNBD), the sensitivity and specificity are 97.4% and 46.7%, respectively[101].
Ultrahigh-resolutionopticalcoherencetomography(UHR-OCT)The corneal epithelial profile maps generated by UHR-OCT can be used to measure the minimum, maximum and average, range of corneal epithelial thickness. By extracting the range and variance of corneal epithelial thickness to quantify the regularity of corneal surface, it is found that DED patients had a highly irregular corneal epithelial surface, and the profile variance and range of epithelial thickness in DED patients are significantly higher than normal eyes, which is highly correlated with the score of the questionnaire, which can be used for DED follow-up and curative effect evaluation[102].
BlinkingTestBlinking is essential for ocular surface health and optimal functioning, either as a cause or as a result of blinking can affect tear film stability, optical clarity and visual function[103]. A study have found that the blinking rate is associated with the decrease of corneal sensitivity, corneal irritation, tear instability, ocular surface disease. Rapid blinking showing a significant correlation with the more serious ocular surface disease and tear instability[104]. As early as the 1990s, studies have found that the blink rate and maximum blink interval of patients with DED are significantly higher than healthy people, and have an important correlation with ocular surface conditions[105]. Video monitoring of subjects’ interblink interval (IBI), found that the mean IBI of patients with dry eyes was 2.56s, while that of normal subjects was 5.97s[106]. The blinks was recorded by LipiViewTMinterferometer per 20s. It was found that incomplete blinking is associated with the decrease of TBUT, the increase of OSDI and the increase of MGD, which could be regarded as an additional measure for mild to moderate DED assessment[107]. Blinking test seems to show some value in DED screening, but blinking is affected by many influential factors, such as tension, fatigue, test environment, visual and cognitive tasking and so on[101]. Only when these influential factors are controlled, can we show the role of blinking test in DED screening and diagnosis.
BulbarRednessTestOne study found that the ocular hyperemia of DED is characterized by involving obvious, fine, horizontal conjunctival vessels in the bulbar conjunctiva, and mainly in the fissure of the interpalpebral, which is helpful to distinguish it from other infectious eye diseases[108]. Accurate and sensitive clinical grades of redness is helpful to the diagnosis and curative effect evaluation of DED. Therefore, some researchers have developed open source ImageJ software, which is used to automatically calculate the total average redness intensity and horizontal component, and to grading them clinically. The results show that the consistency between the computer score and the OCDER (Ora Calibra Dry Eye Redness Scale) score (CCC is better than that of other researchers (CCC=0.67), and has the obvious advantages of 100% repeatability and zero variability[109]. Some researchers also used the image processing of relative Red-channel activity (Red-value) to quantify the ocular bulbar redness. The results showed that the variability of the Red value was the least (gCoV=0.97%, 95%CI: 0.76-1.35%), which was significantly better than the IER scale and the automatic bulbar redness grading technique (Oculus Keratograph 5M R-scan)[110]. Patients with DED show special characteristics of bulbar redness. The clinical grades of bulbar rednes by image provide rapid and objective quantitative parameters for the diagnosis and treatment of DED, but bulbar redness can be caused by many kinds of eye diseases. Therefore, the bulbar redness test does not have the diagnostic performance of DED alone.
DISCUSSION
With lifestyle changes, such as physical inactivity, prolonged sedentary behaviors, and use of visual display terminal have increased the prevalence of DED[111]. A study found that Asian are more likely to suffer from DED than Caucasian, with prevalence rates of 74% and 51%, respectively. The underdiagnosis of DED is due to complex etiology, no consistent relationship between symptoms and signs, complex and changeable symptoms, and limited diagnostic performance of classical detection methods. Therefore, researchers have developed some convenient, non-invasive, highly sensitivity and specificity testing technologies, which can reliably help in the diagnosis of DED. This paper discussed the optional non-invasive DED testing technologies (Table 1), its advantages and disadvantages and diagnostic performance from the point of view of tear film composition, tear volume, tear film stability, morphology of meibomian gland, visual quality, blinking and bulbar redness test. Among them, OCT technology, ocular surface thermographer and tear film osmolarity are more mature technologies, and the measured data are reliable and repeatable, which can be selected by clinicians; while Keratograph technology andinvivoconfocal microscopy have been well used in clinical application, but they have not been used in the management of DED patients, clinicians can select testing technologies to assess according to the symptoms of patients. For the DED testing technologies in the research stage, such as SM technology, interferometry, double-pass imaging system and blinking test, researchers can understand the shortcomings of each detection technology from this paper, and provide a direction for further improvement and optimization research.
Unfortunately, we find that these advanced testing technologies have not been widely accepted in clinic. The reason may be that it’s expensive and time-consuming, and the diagnostic performance of some testing technologies is limited, so it cannot be used as a separate diagnostic tool[53,63]. In addition, the repeatability and reliability of some tests need to be further confirmed. For example, SM technology only has high diagnostic values for DED with water deficiency, but the diagnostic availability of MGD patients decreased[52]. The OSI measured by double-pass imaging system (DP) is not correlated with OSDI and Schrimer test[95], and blinking test is affected by many factors. It may be due to the lack of multicenter big data analysis, which hinders the optimization and improvement of some testing technologies. Therefore, we hope that there will be more multicenter, unsponsored clinical trials to test the diagnostic performance of current technologies, and to conduct comparative studies among technologies to screen out testing technologies that can be used as diagnostic gold standard for DED. Before this, clinicians should do a good job in the collection of medical history and the use of classical detection methods.
