Electrocatalytic CO2 Reduction to Ethylene over CeO2-Supported Cu Nanoparticles: Effect of Exposed Facets of CeO2
2021-06-02SenlinChuXinLiAlexRobertsonZhenyuSun
Senlin Chu , Xin Li , Alex W. Robertson , Zhenyu Sun ,*
1 State Key Laboratory of Organic-Inorganic Composites, College of Chemical Engineering, Beijing University of Chemical Technology, Beijing 100029, China.
2 Department of Materials, University of Oxford, Oxford, OX1 3PH, UK.
Abstract: Fossil fuels are expected to be the major source of energy for the next few decades. However, combustion of nonrenewable resources leads to the release of large quantities of CO2, the primary greenhouse gas. Notably, the concentration of CO2 in the atmosphere is increasing annually at an astounding rate.Electrochemical CO2 reduction (ECR) to value-added fuels and chemicals using electricity from intermittent renewable energy sources is a carbon-neutral method to alleviate anthropogenic CO2 emissions. Despite the steady progress in the selective generation of C1 products (CO and formic acid), the production of multi-carbon species still suffers from low selectivity and efficiency. As an ECR product, ethylene(C2H4) has a higher energy density than do C1 species and is an important industrial feedstock in high demand. However, the conversion of CO2 to C2H4 is plagued by low productivity and large overpotential, in addition to the severe competing hydrogen evolution reaction (HER) during the ECR. To address these issues, the design and development of advanced electrocatalysts are critical. Here, we demonstrate fine-tuning of ECR to C2H4 by taking advantage of the prominent interaction of Cu with shape-controlled CeO2 nanocrystals, that is, cubes, rods, and octahedra predominantly covered with (100), (110), and (111) surfaces, respectively. We found that the selectivity and activity of the ECR depended strongly on the exposed crystal facets of CeO2. The overall ECR Faradaic efficiency (FE)over Cu/CeO2(110) (FE ≈ 56.7%) surpassed that of both Cu/CeO2(100) (FE ≈ 51.5%) and Cu/CeO2(111) (FE ≈48.4%) in 0.1 mol·L-1 KHCO3 solutions with an H-type cell. This was in stark contrast to the exclusive occurrence of the HER over pure carbon paper, CeO2(100), CeO2(110), and CeO2(111). In particular, the FE toward C2H4 formation and the partial current density increased in the sequence Cu/CeO2(111) < Cu/CeO2(100) < Cu/CeO2(110) within applied bias potentials from -1.00 to -1.15 V (vs. the reversible hydrogen electrode), reaching 39.1% over Cu/CeO2(110) at a mild overpotential (1.13 V). The corresponding values for Cu/CeO2(100) and Cu/CeO2(111) were FEC2H4 ≈ 31.8% and FEC2H4 ≈29.6%, respectively. The C2H4 selectivity was comparable to that of many reported Cu-based electrocatalysts at similar overpotentials. Furthermore, the FE for C2H4 remained stable even after 6 h of continuous electrolysis. The superior ECR activity of Cu/CeO2(110) to yield C2H4 was attributed to the metastable (110) surface, which not only promoted the effective adsorption of CO2 but also remarkably stabilized Cu+, thereby boosting the ECR to produce C2H4. This work offers an alternative strategy to enhance the ECR efficiency by crystal facet engineering.
Key Words: CO2; Electrochemical reduction; Ethylene; Cu; CeO2; Exposed facet
1 Introduction
Anthropogenic global warming is a dire consequence of excess emissions of greenhouse gases, mostly carbon dioxide(CO2)1-3. The steady increase in the concentration of atmospheric CO2, from 270 × 10-6in the preindustrial era to more than 407 × 10-6by 2019, and probably approaching 600 ×10-6by 2100, intensifies such catastrophic effect.Electrochemical CO2reduction (ECR) powered by renewably generated electricity offers a mild and clean way to mitigate this issue4-10. ECR also offers an avenue to resolving energy security and energy sustainability. ECR can proceed via multiple concerted proton-electron transfer processes. Based on the number of electrons and protons transferred, CO2can be converted to different products. However, CO2has remarkable thermodynamic stability and requires high energy to be activated. Efficient conversion of CO2is only achievable through the design of advanced electrocatalysts with optimized structures11-14.
ECR to C1species such as carbon monoxide (CO)15-17and formic acid (HCOOH)18has been achieved at a very high Faradaic efficiency (FE) exceeding 90%, while production of multi-carbon compounds remains a grand challenge19. Among the reported electrocatalysts, Cu appears to be the only metal that is capable of catalyzing the ECR to not only HCOOH and CO but also a range of hydrocarbons and oxygenates (aldehydes, and alcohols)12. Cu possesses a suitable binding strength of *CO(affinity not too weak and not too strong) to obey the Sabatier principle, favoring further C-C coupling transformation. Also, it has a negative adsorption energy for CO* but a positive adsorption energy for H* (an intermediate formed in the hydrogen evolution reaction, HER)20. C2H4is a widely used feedstock for producing plastics, ethylene oxide, and diesel fuels. However, due to the concurrent generation of H2and other C1compounds, the FE for the production of C2H4(FEC2H4) on metallic Cu is low. Efforts to improve the FEC2H4have been made on optimizing the sizes, morphologies, and exposed crystal lattices of metallic Cu nanoparticles (NPs)21-23. In addition,Cu/oxide interfaces are considered to play a role in impeding the undesired HER during ECR. In our previous work, we found that tuning the composition and interface of CuO and Sb2O3or In2O3enabled substantially enhanced CO2-to-CO conversion24,25. The CO FE was as high as 93.0% over CuO-In2O3composite catalysts26. CeO2has been regarded as a remarkable catalyst or support owing to its redox behavior and oxygen storage capacity27-34. Of particular interest, CeO2was found to effectively stabilize Cu+, thereby boosting the ECR selectively to yield C2H4over CuO35. Despite these advances, effects of the interaction between metallic Cu and CeO2with varying exposed facets on ECR have not been explored thus far.
Herein, we investigated the ECR performance of Cu NPs supported on different shaped-controlled CeO2nanocrystals.The ECR selectivity and activity was found to be significantly affected by the exposed crystal facets of CeO2. Furthermore, the FEC2H4was shown to increase following the trend of Cu/CeO2(111) < Cu/CeO2(100) < Cu/CeO2(110). We found that CeO2changed the oxidation state of Cu atoms toward Cu+at the CuO-CeO2interface with CeO2(110) being more remarkably than CeO2(100) and CeO2(111). The existence of Cu+species was supposed to be likely the adsorption and active sites for CO2activation followed by further C-C coupling to yield C2H4.
2 Experimental
2.1 Materials
Ce(NO3)3·6H2O (Product number:C105376, 99.5%),Na3PO4·12H2O (Product number: S112445, 98.0%),Cu(Ac)2·H2O (Product number:C108085, 99.95%), NaBH4(Product number: S108355, 98.0%) and ethanol (Product number: E111963, 99.9%) were purchased from Aladdin(Shanghai, China). NaOH (Product number: S817970, 97.0%)was provided by Maclin (Shanghai, China). All raw materials were used as received without additional treatments.
2.2 Synthesis of CeO2 cubes, rods, and octahedra predominantly covered with (100), (110), and(111) surfaces, respectively
CeO2cubes were synthesized using a hydrothermal method36.Typically, 9.6 g of NaOH and 40.0 mL of deionized (DI) water were added in a Teflon-lined steel reactor (100 mL) and mixed with 0.868 g of Ce(NO3)3·6H2O under magnetic stirring for 30 min to yield a white suspension. The reactor was sealed and heated at 453 K for 24 h. The resulting precipitate was separated by centrifugation and washed with excess DI water and ethanol four times, followed by drying at 353 K for 8 h. The obtained powder was then treated at 673 K for 4 h at a heating rate of 5 K·min-1.
CeO2nanorods were prepared by adapting a similar hydrothermal method37. Specifically, 8.44 g of NaOH and 15.0 mL of DI water were added in a Teflon-lined steel reactor (100 mL) and mixed with 0.88 g of Ce(NO3)3·6H2O and 20.0 mL of DI water under magnetic stirring for 30 min to form a white slurry. The reactor was sealed and heated at 453 K for 24 h. The resulting precipitate was separated by centrifugation and washed with a mixture of excess DI water and ethanol four times, and subsequently dried at 333 K for 6 h. The obtained powder was subsequently treated at 773 K for 4 h under Ar at a heating rate of 5 K·min-1.
CeO2octahedra were produced using a modified hydrothermal method36. 0.0038 g of Na3PO4·12H2O and 40.0 mL of DI water were loaded in a Teflon-lined steel reactor (100 mL), followed by mixing with 0.434 g of Ce(NO3)3·6H2O under vigorous magnetic stirring for 30 min. The reactor was sealed and heated at 473 K for 20 h. The resulting precipitates were separated by centrifugation and washed with excess DI water and ethanol four times, followed by drying at 353 K for 8 h. The obtained powder was then calcined at 673 K for 4 h at a heating rate of 5 K·min-1.
2.3 Preparation of Cu/CeO2 catalysts
Cu nanoparticles were immobilized on the surface of CeO2through an ultrasonication-facilitated deposition method using sodium borohydride as a reductant. Typically, 20.0 mg of CeO2powder with controlled shapes and a specific amount of Cu(Ac)2·H2O were dissolved in 20.0 mL of ethanol. The resultant solution was subjected to ultrasonication for 10 min to ensure a complete mixing. 10.0 mL of 0.1 mol·L-1NaBH4ethanol solution was added into the solution under nitrogen,which was ultrasonicated for another 20 min.The resulting precipitate was separated by centrifugation and washed with a mixture of excess DI water and ethanol four times, and then dried in a vacuum oven at 273 K for 8 h.
2.4 Characterization
X-ray powder diffraction (XRD) was carried out with a D/MAX-RC diffractometer (Japan) operated at 30 kV and 100 mA with Cu Kαradiation (λ = 0.15418 nm). X-ray photoelectron spectroscopy (XPS) experiments were conducted using Thermo Scientific ESCALAB 250Xi instrument (UK) equipped with an electron flood and scanning ion gun. All spectra were calibrated to the C 1s binding energy at 284.8 eV. High-angle annular darkfield scanning transmission electron microscopy (HAADFSTEM) was recorded using a JEOL ARM200 microscope(Japan) operated at 200 kV voltage. High-resolution (HR)transmission electron microscopy (TEM) was performed using a JEOL 3000F (Japan). TEM and STEM samples were obtained by dropping a droplet of suspension onto a Ni grid coated with a lacey carbon film. The Brunauer-Emmett-Teller specific surface areas of samples were determined using a physical adsorption instrument (Micromeritics ASAP 2020, USA) at 77 K. The sample was subjected to degassing at 120 °C for 12 h.
2.5 Electrochemical measurements
Controlled potential electrolysis was performed in a conventional H-type cell reactor separated by a cationic polymeric membrane (Nafion 117). Prior to ECR measurements,the Nafion membrane was heated in H2O2aqueous solution(5.0%) and H2SO4(0.5 mol·L-1) at 80 °C for 1 h, respectively.Subsequently, the Nafion membrane was soaked in DI water at room temperature and left for 30 min and then washed with DI water. 12.0 mg of a catalyst was suspended in 2.4 mL of a mixture of isopropanol, DI, and Nafion solution (5.0% (w, mass fraction)) with a respective volume ratio of 100 : 100 : 1 under ultrasonication for 30 min to yield a homogeneous dispersion.240 μL of the dispersion was then deposited onto a Toray Carbon fiber paper electrode (1.2 cm × 1 cm), and dried under room temperature. A Pt wire and an Ag/AgCl electrode were used as the counter electrode and reference electrode, respectively. The potentials were controlled by an electrochemical working station(CHI 760E, Shanghai CH Instruments Co., China). All voltages in this study were provided relative to the Ag/AgCl reference electrode (in KCl solution, 3.5 mol·L-1) and converted to the RHE reference scale based on the equation

ECR was conducted in CO2-saturated 0.1 mol·L-1KHCO3(pH 6.8) under ambient conditions. CO2was bubbled in the KHCO3electrolytes for 30 min to expel residual air in the solution, and controlled electrolysis was carried out at each potential for 60 min.
Linear sweep voltammograms in Ar- or CO2environment were obtained by using a three-electrode configuration with an Ag/AgCl reference electrode, Pt wire counter electrode, and glassy carbon working electrode on a CHI 760E potentiostat.Rotating disk electrode (RDE) experiments were performed on an AFMSRCE RDE control system (Pine Inc., USA). The electrolyte is 0.1 mol·L-1KHCO3solution bubbled with Ar or CO2for 30 min. To attain linear sweep voltammograms, 6 mg of a catalyst was suspended in a solution containing ethanol (600 μL), DI water (600 μL), and Nafion solution (1.0% (w), 600 μL).Then, the mixture was treated under ultrasonication for 30 min to yield an ink. 7.95 μL of the ink was subsequently loaded onto a glassy carbon electrode and dried at room temperature.
2.6 Quantitative determination of gaseous and liquid products
The gas-phase products after ECR were analyzed by an Agilent 7890B gas chromatography (GC) with two thermal conductivity detectors (TCD) and one flame ionization detector(FID). To probe the gas products, 20 mL of produced gas in the dead volume of a gas bag (~2 L) was injected into the GC at equivalent conditions with a sample lock syringe. CO, C2H4,CH4, and H2mole fractions of injected samples could be determined based on GC calibration curves. The amounts of liquid products (n in moles) were measured using nuclear magnetic resonance (NMR, Bruker Avance III 400 HD spectrometer). NMR samples were made by blending 0.5 mL of the product-containing electrolyte and 0.1 mL of DMSO-d6as the internal standard. The FE of a product was determined using the equation:

Where F represents the Faraday constant (96485 C·mol-1), n the number of moles for a product, m (in number) the electrons needed for the formation of one product molecule. The amount of charge (Q in Coulomb) passed to generate products was determined. I (in ampere) stands for the constant current at an applied potential. t (in second) corresponds to the electrolysis time.
3 Results and discussion
3.1 Morphology and structure analysis
The X-ray diffraction (XRD) analysis results of the asobtained Cu/CeO2samples, along with the patterns of standard CeO2, metallic Cu, and CuOx, are provided in Fig. 1a. The diffraction peaks appearing around 28.1°, 32.5°, 47.1°, 55.9°,58.6°, 69.0°, 76.2°, and 78.7°, could be well indexed to the (111),(200), (220), (311), (222), (400), (331), and (420) planes of CeO2(PDF#43-1002), respectively. This suggests the yield of fluorite(Fm3m) CeO2with a face-centered cubic (fcc) structure in the composites38. No typical reflections of Cu, Cu2O, and CuO were observed in all cases, plausibly resulting from the low loading and/or small sizes of Cu in the samples.
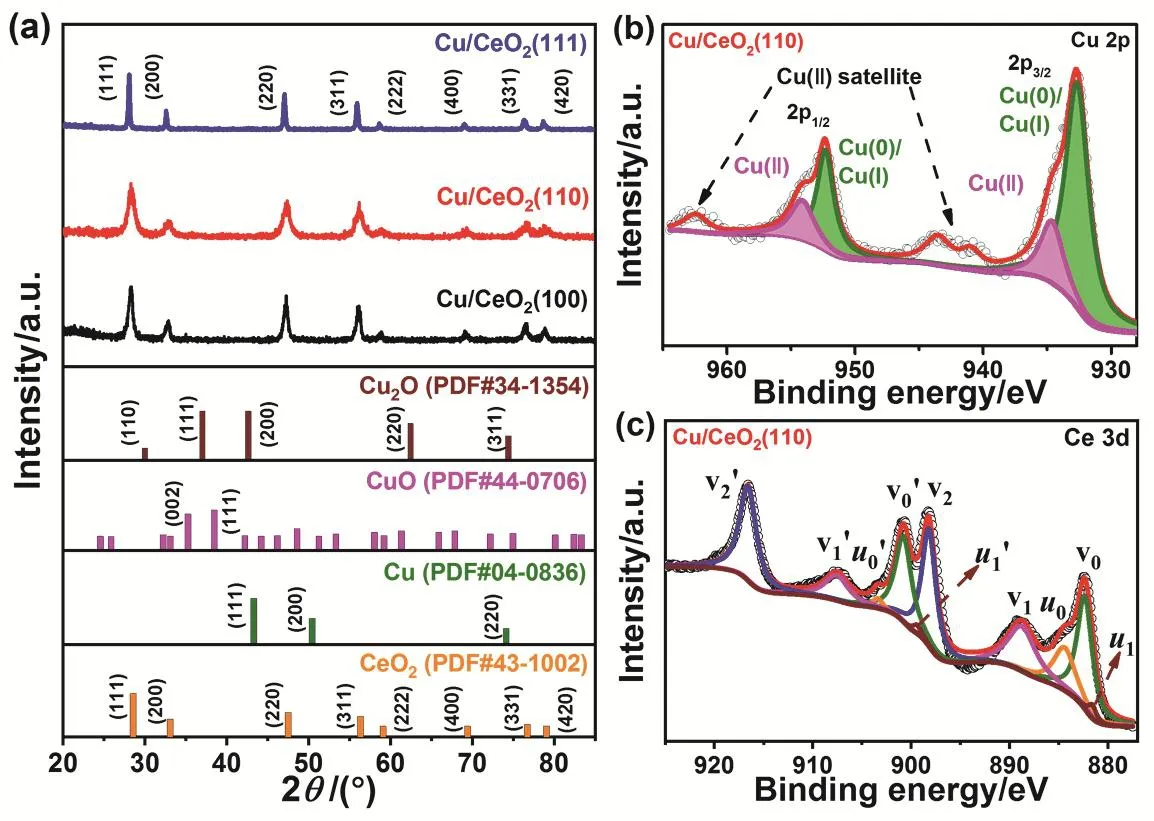
Fig. 1 (a) XRD patterns of Cu/CeO2(111), Cu/CeO2(110), and Cu/CeO2(100); (b) Cu 2p and (c) Ce 3d XPS spectra of Cu/CeO2(110).
To probe the surface composition and chemical state of Cu and Ce, as well as their interactions, XPS was performed.The Cu 2p XPS spectrum of Cu/CeO2(110) was provided in Fig. 1b.Pronounced peaks of Cu 2p1/2with binding energies (BEs) at 952.3 and 954.2 eV were clearly observed, generally associated with the Cu0/Cu+and Cu2+species, respectively35. Three satellite peaks at about 940.9, 943.6, and 962.5 eV (Figs. 1b and S1a and S1b) originated from Cu2+, while a satellite peak at about 571.2 eV (Fig. S1c-e) corresponded to Cu+39. The existence of oxidized Cu is probably due to oxidation of the sample after exposure in the air. Interestingly,the content of Cu+was found to follow the sequence of Cu/CeO2(110) >Cu/CeO2(100) > Cu/CeO2(111) in the Cu LMM Auger spectra(Fig. S1c-e). This suggests that CeO2(110) has a more remarkable capability to stabilize Cu+compared to CeO2(100)and CeO2(111). Fig. 1c shows the Ce 3d signals of Cu/CeO2(110), which display a satellite structure arising from hybridization of Ce 3d orbitals with O 2p orbitals and partial occupation of the 4f levels.The 3d5/2and 3d3/2spin-orbit peaks(spin-orbit splitting, about 18.5 eV) are depicted as ν and ν′,respectively, attributed to Ce4+.The peaks of ν0and ν1were assigned to a mixing configuration of the 3d94f2(O 2p4) and 3d94f1(O 2p5) Ce4+states and ν2to the 3d94f0(O 2p6) Ce4+state.A similar assignment was used to analyze the ν’ structures, in accordance with the Ce 3d3/2level. This manifests the predominated state of Ce4+in the samples, matching with the XRD results. Four peaks u0(BE ≈ 884.5 eV), u1(BE ≈ 881.6 eV), u0’ (BE ≈ 903.4 eV), and u1’ (BE ≈ 899.5 eV) corresponding to Ce3+could be observed, suggesting the formation of Ce2O3in the samples40.Fig. S1f displays N2adsorption-desorption isotherms of the Cu/CeO2samples. A typical type I-isotherm can be observed according to the BDDT (Brunauer, Deming,Deming, and Teller) classification41. The BET (Brunauer-Emmett-Teller) surface area is 90.1, 46.3, and 101.1 m2·g-1for Cu/CeO2(111), Cu/CeO2(100), and Cu/CeO2(110), respectively.
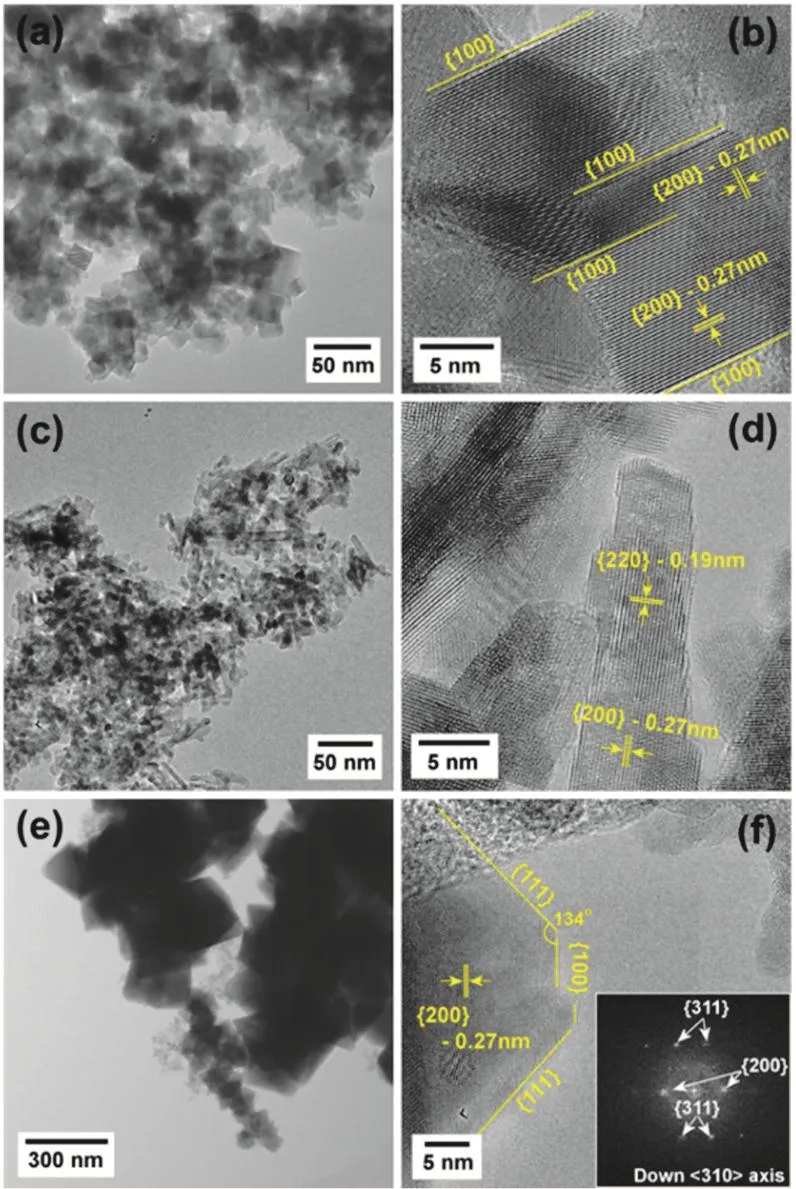
Fig. 2 TEM and HRTEM images of CeO2 with different shapes:(a, b) cubes; (c, d) rods; and (e, f) octahedra. The inset in image (f) illustrates the corresponding FFT.
The morphological features of the resulting CeO2nanocrystals and Cu/CeO2samples were examined by TEM and HAADFSTEM. As revealed by TEM (Fig. 2), well-defined CeO2samples with a morphology of cubes, rods, and octahedra were formed. The as-synthesized CeO2has good crystallinity.Predominant CeO2{100} and {200} planes were observed, as confirmed by their lattice spacing36, with the CeO2cubes exhibiting an average size of about 18.0 nm (Fig. 2a,b). Whereas{220} planes with a d-spacing of 0.19 nm37were identified for CeO2rods with a mean diameter and length of about 6.7 and 27.6 nm, respectively (Fig. 2c,d). By fast Fourier transformation(FFT) (inset of Fig. 2f), the exposed facet of {111}36was indexed for a CeO2octahedra (Fig. 2e,f), with a size of ~180.0 nm.Fig. 3a-f shows the STEM images and electron energy loss spectroscopy (EELS) spectra of Cu/CeO2(100), Cu/CeO2(110),and Cu/CeO2(111). It can be seen that the morphology of respective CeO2retained regardless of Cu decoration (Fig.3a,c,e). The EEL spectra at Ce M5,4edges matched what we expected for CeO2(Fig. 3b,d,f)42. The EEL spectra at the Cu L2,3edges manifested adsorption jumps at E(L3) of about 930 eV and E(L2) of about 950 eV, corresponding to transitions from 2p core levels to unoccupied 3d levels present in oxidized Cu. Based on HRTEM and FFT, fcc CuO NPs of about 5 nm surrounded by CeO2nanocrystals were discerned (Fig. 3g-i). The formation of CuO is likely due to oxidation of metallic Cu after exposure of the samples in the air.

Fig. 3 STEM images and EELS spectra of (a, b) Cu/CeO2(100),(c, d) Cu/CeO2(110), (e, f) Cu/CeO2(111); (g) HRTEM image of Cu/CeO2(111); (h) enlarged image of the white rectangle in image (g); (i) FFT of the region shown in image (h).
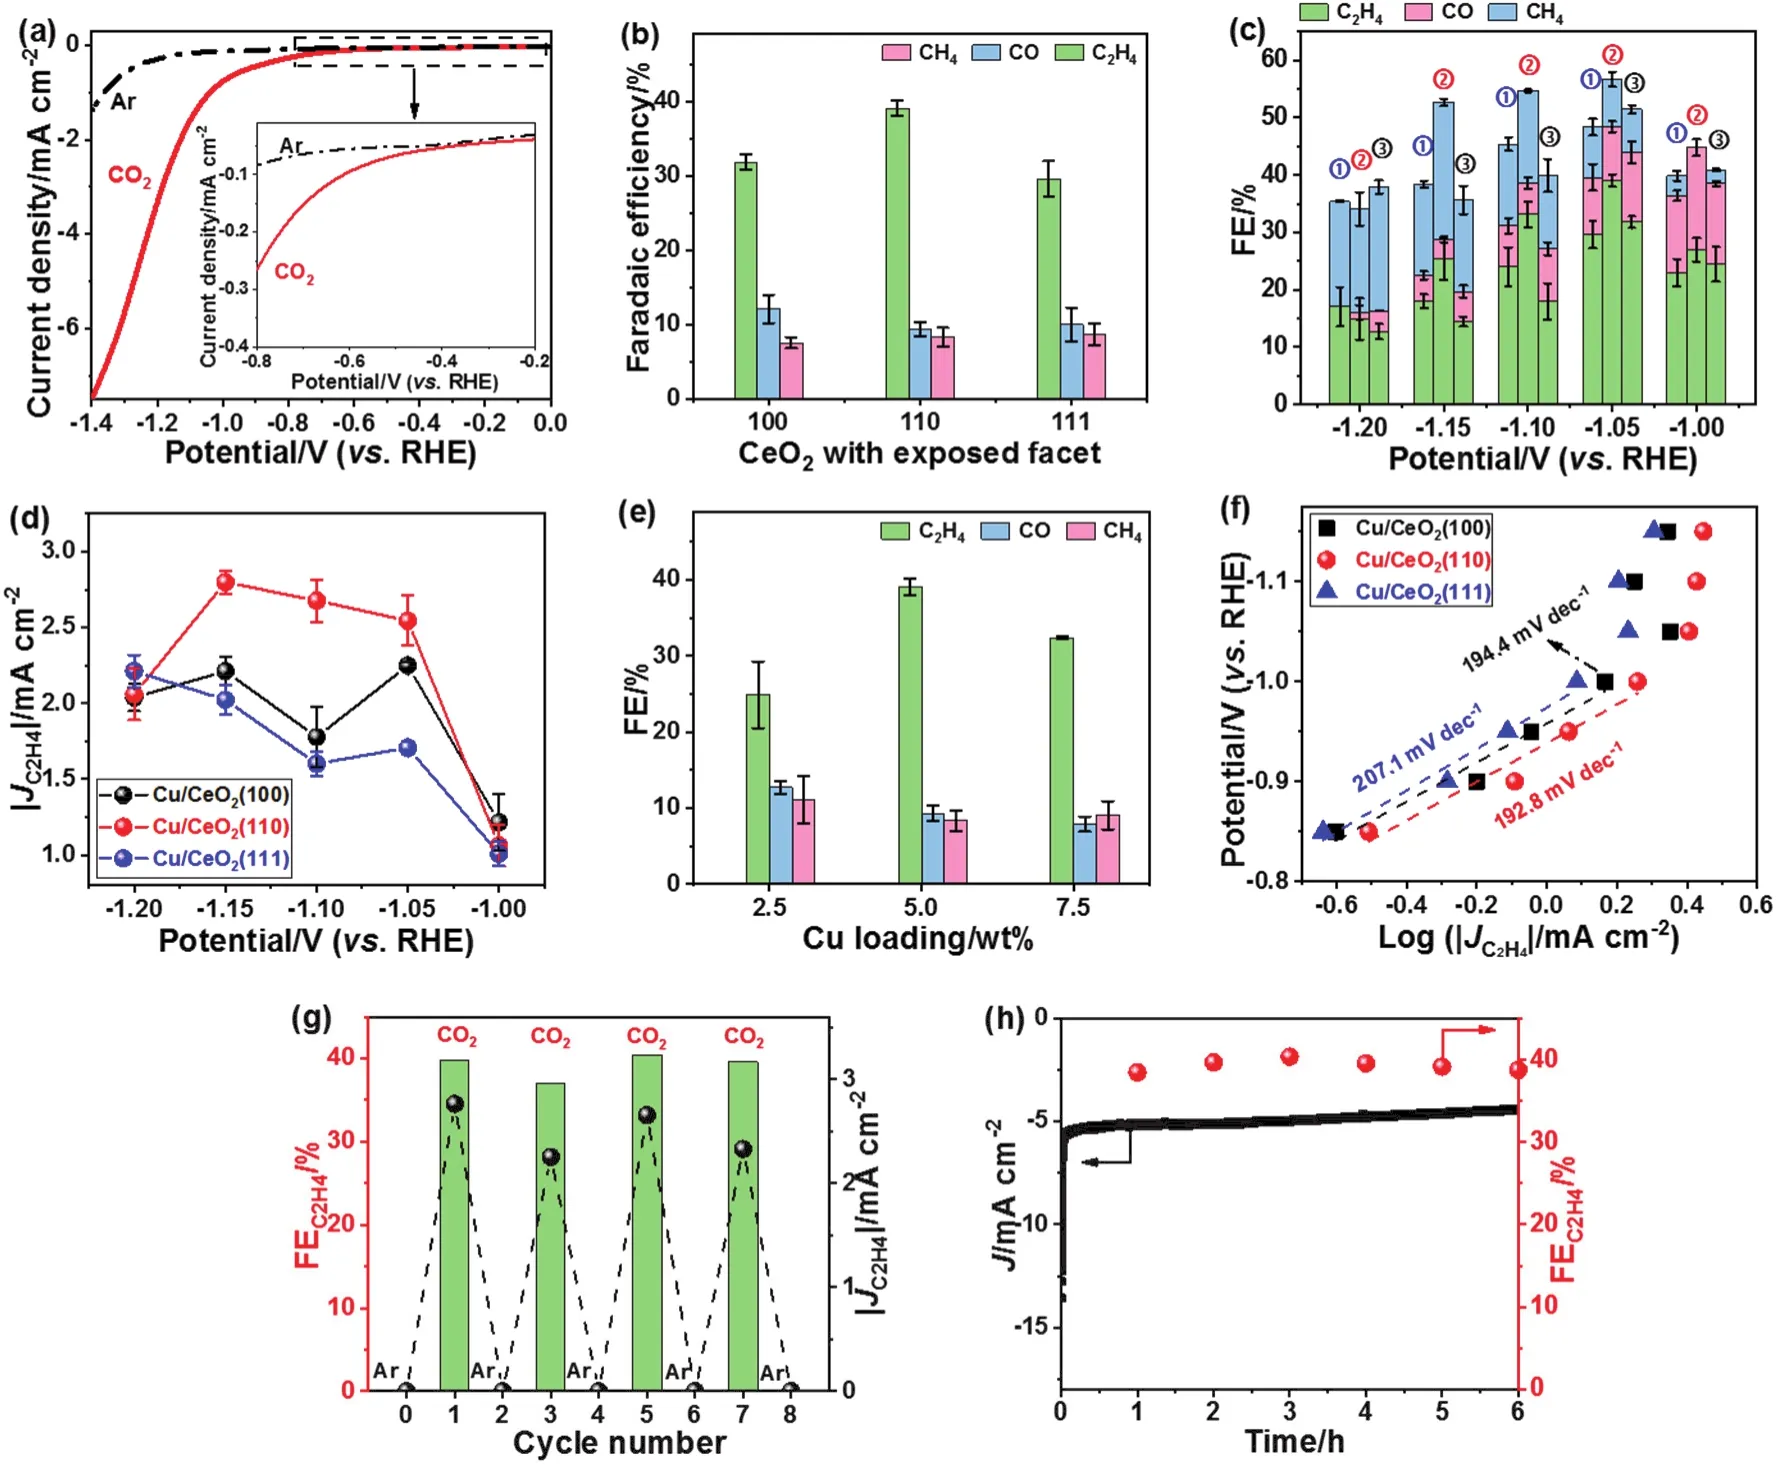
Fig. 4 (a) LSV results of Cu/CeO2(110) on a glassy carbon electrode in Ar- (dashed black line) or CO2 (solid red line)-saturated 0.1 mol·L-1 KHCO3 at a scan rate of 5 mV·s-1. (b) Faradaic efficiencies for ECR products of Cu/CeO2(100), Cu/CeO2(110), and Cu/CeO2(111) at -1.05 V.(c) Overall ECR Faradaic efficiencies and (d) C2H4 geometric current densities over Cu/CeO2(111) (named as ①), Cu/CeO2(110) (named as ②), and Cu/CeO2(100) (named as ③) at various applied potentials. (e) ECR Faradaic efficiencies at -1.05 V as a function of Cu loading over Cu/CeO2(110).(f) Tafel plots of the partial geometric current density for C2H4 production over Cu/CeO2(100), Cu/CeO2(110), and Cu/CeO2(111). (g) C2H4 FEs(column) and corresponding partial geometric current densities (ball) for Cu/CeO2(110) during cycles with an interval of 1 h in CO2- and Ar-saturated 0.1 mol·L-1 KHCO3. (h) Current density and C2H4 FE of Cu/CeO2(110) during long-time electrolysis at -1.05 V.
3.2 Investigation of Cu/CeO2 for electrochemical CO2 reduction
The catalytic properties of Cu/CeO2catalysts toward CO2reduction were tested in CO2-saturated 0.1 mol·L-1KHCO3solutions (pH 6.8) using an H-type cell under continuous CO2bubbling. The geometric current densities of Cu/CeO2samples were examined by linear sweep voltammetry (LSV) with applied voltages in the range from 0.00 to -1.40 V, as displayed in Figs.4a and S2a. Of note, for all three Cu/CeO2samples remarkably higher cathodic current densities were attained in a CO2environment compared with an Ar atmosphere throughout the potential range applied. CO, H2, CH4, C2H4were probed at working voltages from -1.00 to -1.20 V in a CO2-saturated 0.1 mol·L-1KHCO3solution. In sharp contrast, pure carbon paper,CeO2(100), CeO2(110), and CeO2(111) exclusively produced H2within the applied potentials (Fig. S2b-e), indicating their poor activities for ECR. At -1.05 V, the ECR took place over HER for all the three Cu/CeO2samples. The overall ECR FE over Cu/CeO2(110) (FE ≈ 56.7%) outperformed that of both Cu/CeO2(100) (FE ≈ 51.5%) and Cu/CeO2(111) (FE ≈ 48.4%)(Fig. 4b,c). Strikingly, Cu/CeO2(110) exhibited the highest selectivity for C2H4formation (FEC2H4≈ 39.1%) at -1.05 V compared to Cu/CeO2(100) (FEC2H4≈ 31.8%) and Cu/CeO2(111)(FEC2H4≈ 29.6%). The C2H4selectivity is comparable to many reported Cu-based materials under similar overpotentials such as Cu nanocubes with exposed (100) facets (FEC2H4≈ 32.0%)43,Ag-Cu nanodimers (FEC2H4≈ 40.0%)44, and carbon electrocatalysts such as N-doped graphene quantum dots (FEC2H4≤ 31.0%)45. Likewise, Cu/CeO2(110) also displayed significantly larger C2H4partial geometric current density than the other two catalysts (Fig. 4d). Comparably lower CO generation was observed for Cu/CeO2(110) attributed to its higher hydrocarbon production, which consumed the CO intermediate. The high intrinsic activity of the Cu/CeO2(110)sample may be closely correlated to the nature of the metastable(110) surface46. On the one hand, CeO2facilitated effective adsorption of CO2, forming carbonates and hydrogen carbonates,thereby benefiting ECR35. On the other hand, CeO2(110) could significantly stabilize Cu+, which was believed to play a critical role in the ECR to produce C2H435. The ceria nanocrystals with different facets synthesized here were all larger than 5 nm,therefore, the size of ceria was unlikely to affect the catalytic performance47. These point to the possibility that the exposed CeO2(110) facets favored ECR over Cu selectively to C2H4.
At applied overpotentials more positive than -1.05 V, more CO than CH4was produced while CH4dominated in the ECR products at more negative potentials than -1.15 V for the three catalysts.At voltages≤ -1.20 V, the FE of evolved H2surpassed 50.0%, which tended to increase with increasing overpotential.This is most probably due to restricted CO2mass transport and thus more protons available for facile occurrence of the competing HER. Moreover, the effect of Cu loading in Cu/CeO2(110) on ECR was investigated (Fig. 4e). It was found that the ECR FE increased with improving the content of Cu from 2.5% (w) to 5.0% (w). This may be due to the increase of the interface between Cu and CeO2. However, further increase in Cu loading from 5.0% (w) to 7.5% (w) resulted in drop of ECR performance, which was probably attributed to aggregation of Cu NPs and thus decrease of the interfacial area of Cu with CeO2.
The reaction kinetics were studied by Tafel analysis. A Tafel slope of 192.8 mV·dec-1was derived for Cu/CeO2(110), smaller than 194.4 mV·dec-1for Cu/CeO2(100) and 207.1 mV·dec-1for Cu/CeO2(111) (Fig. 4f). This indicates that the Cu/CeO2(110)has a faster kinetics for ECR to generate C2H4. The generation of the *CO intermediate for subsequent reactions on the surface of the catalysts may be the rate-controlling process. The Nyquist plots showed a lower charge transfer resistance of Cu/CeO2(110)NPs than both Cu/CeO2(100) and Cu/CeO2(111) (Fig. S2f),indicating its more favorable electron exchange between the catalyst on the electrode surface and dissolved CO2in the electrolyte, benefiting ECR.
The stability of the ECR process over Cu/CeO2(110) was evaluated by alternated electrolysis between Ar- and CO2-saturated electrolytes (Fig. 4g) as well as continuous electrolysis under CO2environment at a fixed potential of -1.05 V for 6 h(Fig. 4h). It is worth noting that the catalyst remained steady for C2H4formation in both cases.
4 Conclusions
To be concluded, we have demonstrated facile synthesis of Cu NPs supported on CeO2nanocrystals (cubes, rods, and octahedra) with different exposed facets. The Cu/CeO2nanocomposites were observed to exhibit facet dependent catalytic properties for ECR in 0.1 mol·L-1KHCO3solutions at ambient conditions. The Cu/CeO2(110) catalyst delivered higher ECR performance than both Cu/CeO2(100) and Cu/CeO2(111)in terms of ECR FE and partial geometric current density.Especially, the FEC2H4and JC2H4over Cu/CeO2(110) reached up to 39.1% and 2.5 mA·cm-2at -1.05 V, respectively, in contrast to 31.8% and 2.2 mA·cm-2for Cu/CeO2(100), 29.6% and 1.7 mA·cm-2for Cu/CeO2(111). The superior ECR activity of Cu/CeO2(110) could be attributed to a strong synergy between Cu NPs and CeO2(110) facets, which resulted in more stabilized Cu1+species, thus promoting C-C coupling, formation and desorption of C2H4. Our work provides a simple and effective avenue for enhancing the ECR toward C2H4formation by crystal facet engineering.
Supporting Information:available free of charge via the internet at http://www.whxb.pku.edu.cn.