Cu@UiO-66 Derived Cu+-ZrO2 Interfacial Sites for Efficient CO2 Hydrogenation to Methanol
2021-06-02YanqiuWangZixinZhongTangkangLiuGuoliangLiuXinlinHong
Yanqiu Wang, Zixin Zhong, Tangkang Liu, Guoliang Liu , Xinlin Hong
College of Chemistry and Molecular Sciences, Wuhan University, Wuhan 430072, China.
Abstract: Cu/ZrO2 catalysts have demonstrated effective in hydrogenation of CO2 to methanol, during which the Cu-ZrO2 interface plays a key role. Thus, maximizing the number of Cu-ZrO2 interface active sites is an effective strategy to develop ideal catalysts. This can be achieved by controlling the active metal size and employing porous supports. Metal-organic frameworks(MOFs) are valid candidates because of their rich, openframework structures and tunable compositions. UiO-66 is a rigid metal-organic skeleton material with excellent hydrothermal and chemical stability that comprises Zr as the metal center and terephthalic acid (H2BDC) as the organic ligand. Herein, porous UiO-66 was chosen as the ZrO2 precursor, which can confine Cu nanoparticles within its pores/defects. As a result, we constructed a Cu-ZrO2 nanocomposite catalyst with high activity for CO2 hydrogenation to methanol. Many active interfaces could form when the catalysts were calcined at a moderate temperature, and the active interface was optimized by adjusting the calcination temperature and active metal size.Furthermore, the Cu-ZrO2 interface remained after CO2 hydrogenation to methanol, as confirmed by transmission electron microscopy (TEM), demonstrating the stability of the active interface. The catalyst structure and hydrogenation activity were influenced by the content of the active component and the calcination temperature; therefore, these parameters were explored to obtain an optimized catalyst. At 280 °C and 4.5 MPa, the optimized CZ-0.5-400 catalyst gave the highest methanol turnover frequency (TOF) of 13.4 h-1 with a methanol space-time yield (STY) of 587.8 g·kg-1·h-1 (calculated per kilogram of catalyst, the same below), a CO2 conversion of 12.6%, and a methanol selectivity of 62.4%. In situ diffusereflectance infrared Fourier transform spectroscopy (DRIFTS) of CO adsorption over the optimized catalyst revealed a predominant, unreducible Cu+ species that was also identified by X-ray photoelectron spectroscopy (XPS). The favorable activity observed was due to this abundant Cu+ species coming from the Cu+-ZrO2 interface that served as the methanol synthesis active center and acted as a bridge for transporting hydrogen from the active Cu species to ZrO2. In addition,the oxygen vacancies of ZrO2 promoted the adsorption and activation of CO2. These vacancies and Cu+ trapped in the ZrO2 lattice are the active sites for methanol synthesis from CO2 hydrogenation. The X-ray diffraction (XRD) patterns of the catalyst before and after reaction revealed the stability of its structure, which was further verified by time-on-stream(TOS) tests. Furthermore, in situ DRIFTS and temperature-programmed surface reaction-mass spectroscopy (TPSR-MS)revealed the reaction mechanism of CO2 hydrogenation to methanol, which followed an HCOO-intermediated pathway.
Key Words: CO2 hydrogenation; Methanol synthesis; Cu+-ZrO2 interfaces; Cu/ZrO2 catalysts; UiO-66
1 Introduction
Over the past two centuries, the consumption of fossil fuels has created numerous problems, especially CO2excessive emissions. New sustainable and green solutions to address the increasing global energy demands and the need to protect the environment are highly desirable1. Methanol is an important intermediate product in the formation of many industrial chemicals and is also considered to be a promising vehicle fuel with high performance. Catalytic hydrogenation of CO2to methanol is believed to be a process with huge potential for alleviating impacts of the greenhouse effects and realizing energy sustainable development2. This reaction has been intensively studied not only for the industrial application but also for the deep understanding of catalyst structure-activity relationship and reaction mechanism3-10. However, the regulation of methanol synthesis activity with improved selectivity over a proper catalyst is still very desired.
It has been documented that copper-based catalysts are highly active in CO2hydrogenation to methanol11-14, which have been widely used in this process of CO2hydrogenation owing to its high catalytic performance and the moderate price. Typically, Cu species always combine with metal oxides (such as ZnO10,15-19,ZrO26-8,20-25, and CeO226-29) making more active sites for better performance towards methanol synthesis. The activity and selectivity of the catalysts strongly depend on the metal-oxide interface and the active metal size. ZrO2has received considerable attention as the support of copper-based catalysts due to its unique properties. For instance, ZrO2is known to promote both methanol production rate and the selectivity because of the enhanced CO2adsorption and activation23. As a result, zirconia as a structure promoter or more frequently as a support has been applied in a number of catalytic reactions in recent years30-33. In order to promote the methanol synthesis activity, maximizing Cu-ZrO2interfacial sites by lowering the size of Cu nanoparticles (NPs) is regarded as one of the best strategies of catalyst design.
Metal-organic frameworks (MOFs) have been widely applied in the area of catalysis due to its unique reticular structure and abundant scattered metal sites34-40. What is more important,MOFs are advantageous in interfacing with other catalytic active metals inside the framework owing to their nanosized metal oxide secondary building unites (SBUs) and tunability of their compositions, hence allowing us to construct abundant active interfaces effectively36. Inspired by these progresses, we exploited porous UiO-66 to confine Cu nanoparticles and abundant Cu-ZrO2interfaces were then formed via controlled calcination in air. Different calcination temperatures and active metal contents were investigated obtaining the best CZ-0.5-400 catalyst which gives the highest methanol turnover frequency(TOF) of 13.4 h-1at 280 °C and 4.5 MPa. We also investigated the reaction pathway over the Cu/ZrO2catalysts with the help of in situ characterization technique that reveals the reaction follows HCOO-intermediated pathway.
2 Experimental section
2.1 Catalyst preparation
2.1.1 Synthesis of Cu@UiO-66 precursor
UiO-66 was synthesized using formic acid (AR) as the defect modulator by hydrothermal synthesis according to the Ref. 41.And then, 0.53 g of UiO-66 were dispersed into 50 mL of methanol (AR) by ultrasound for 30 min. A certain amount of CuAc2·H2O (AR,Aladdin, Shanghai) was added into above dispersion and stirred for 1 h at room temperature next. The Cu/Zr molar ratio was set at 0.5, 0.7 and 0.9. Afterwards, excess NaBH4(AR, Sinopharm Chemical Reagent, Shanghai) solution was rapidly added to reduce Cu2+with stirring continually for 2.5 h. NaBH4was dissolved in methanol with a concentration of 1.45 mg·mL-1the molar quantities of which were five times the molar quantities of Cu2+. The precipitation was collected by centrifugation and washed alternately with methanol and ethanol(AR) for several times and then dried overnight in vacuum at 60 °C.
2.1.2 Synthesis of CZ-x-T catalysts
Cu@UiO-66 precursor was calcined in a muffle furnace for 4 h at 350, 400 and 450 °C respectively with a ramp rate of 1 °C·min-1, getting the final CZ-x-T catalysts, where x and T stand for Cu/Zr molar ratio and calcination temperature,respectively. In the end, all catalysts were reduced under 10% H2/Ar flow at 300 °C before catalyst characterization and performance tests.
2.2 Catalyst characterization
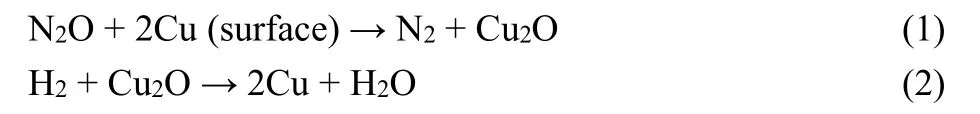
Multipoint Brunauer-Emmett-Teller (BET) measurements and the pore structure were analyzed by a Micromeritics ASAP-2010 automatic N2adsorption system (America). The XRD patterns were obtained by a Rigaku Miniflex600 (Japan) X-ray diffractometer with a Cu Kα(λ = 0.15406 nm) radiation source between 10° and 80° at a step rate of 10 (°)·min-1. Scanning electron microscopy (SEM) was performed on a FEI Verios460 instrument (America). Transmission electron microscopy(TEM) images were obtained by a JEM-2100F electron microscope (Japan). The dispersion behavior and particle size of surface metallic Cu in catalysts was measured by N2O oxidation and the followed H2reduction titration on a Micromeritics Autochem 2920 (America). The samples were reduced by 5%(volume fraction, the same below) H2/Ar (30 mL·min-1) at 573 K for 2 h before the surface metallic copper species was preoxidized by N2O (30 mL·min-1) at 323 K for 0.5 h. The gas was switched into Ar (30 mL·min-1) for 0.5 h to remove the residual N2O. And then 5% H2/Ar at a flow rate of 30 mL·min-1was fed into system. While the temperature ramped from room temperature to 573 K at a heating rate of 10 K·min-1, and thermal conductivity detector (TCD) signal recorded synchronously. The absolute amount of surface Cu atoms is calculated according to H2consumption in the following Eqs. (1) and (2).
The temperature-programmed surface reaction-mass spectra(TPSR-MS) of CO2+ H2co-adsorption were collected to explore the reaction path of CO2hydrogenation performed at Micromeritics Autochem ASAP-2920 system (America) along with an on-line Hiden QIC-20 mass spectrometer (America).Before the test, about 30 mg of catalyst was placed in a quartz tube reactor to be pre-reduced under 5% H2/Ar stream (30 mL·min-1) for 2 h at 300 °C. When the system was cooled down to room temperature, 5% CO2/Ar and 5% H2/Ar mixed flow is imported into the reactor with the total flow velocity of 30 mL·min-1. The pre-adsorption lasted for 30 min before the TPSR-MS test. During the test, the temperature rose from room temperature to 800 °C at a rate of 10 °C·min-1and the MS signal of H2, CO2, CO, H2O, HCOOH and CH3OH appearing in the process was recorded at the same time.
In situ diffuse-reflectance infrared Fourier transform spectroscopy (DRIFTS) results were obtained by a Bruker Vertex 70 device (Germany) equipped with an MCT detector.Before the test, 4-10 mg of catalyst was placed in the in situ chamber before the chamber was installed in the infrared pool.The sample was reduced under 10% H2/Ar with a flow rate of 30 mL·min-1and after that the gas was switched to high purity argon with the same flow velocity lasting for 30 min. When the system was cooled down to the target temperature and the corresponding background spectrum was collected for subsequent analysis. For in situ DRIFTS of CO adsorption, the gas was switched to 5% CO/He stream with a flow rate of 30 mL·min-1. The adsorption was performed at 100 °C for 30 min under atmospheric pressure, and then sweep the adsorbed sample by 10% H2/Ar stream at a flow rate of 30 mL·min-1and the timeresolved DRIFTS images were collected at the same time. For in situ DRIFTS of CO2and H2reaction, the gas was switched to a stream of the CO2/H2mixture (1/3 by volume) at a flow rate of 30 mL·min-1under 0.3 MPa. And the time-resolved DRIFTS images were collected synchronously at 100, 150, 200 and 250 °C, respectively.
2.3 Activity measurements
The catalyst activity measurements were conducted in a stainless steel fixed-bed tube reactor (WFSM-3060, TianJin).The reactor was filled with quartz cotton at appropriate height and 0.1 g of catalyst was mixed with 0.4 g of quartz sand fully.The mixture was evenly distributed over the quartz cotton in the reaction tube. Before the reaction test, sample was pretreated under 10% H2/Ar flow with a rate of 30 mL·min-1for 2 h at 300 °C. After the system was cooled to room temperature, the reaction gas of CO2/H2mixture (1/3 by volume, GHSV of 21600 mL·g-1·h-1) was fed into the reactor and the pressure was adjusted at 4.5 MPa. Different reaction temperature (230-280 °C) was investigated. The products were monitored online by gas chromatograph equipped with Porapak-Q packed column and thermal conductivity detector.
3 Results and discussion
3.1 Characterization of material structure and reducibility
The preparation of Cu/ZrO2catalysts was illustrated in Scheme 1. First, the porous UiO-66 was used to confine Cu nanoparticles (Cu NPs) via the pre-impregnation and followed reduction of Cu2+by excess NaBH4. Cu/ZrO2catalysts were constructed via calcination of Cu@UiO-66 precursor in air at 350, 400 and 450 °C. The final catalyst is denoted as CZ-x-T,where x and T are the atomic ratio of Cu to Zr in the recipe and calcination temperature, respectively. And the Cu+-ZrO2interface took shape during calcination, reduction and reaction process. Fig. 1 shows the structure characterization of UiO-66 and CZ-x-T catalysts. SEM image in Fig. 1a shows the 3D octahedral microstructure of UiO-66. TEM images and XRD pattern of Cu@UiO-66-0.5 precursor confirm the maintaining of UiO-66 structure (Figs. S1 and S2, in Supporting Information,the same below), indicating the impregnation of Cu has not completely destroyed the structure of UiO-66. Note that, it is observed that the small Cu NPs exist inside the UiO-66 matrix(see Fig. S1), suggesting the confinement of Cu by the structure of UiO-66. After Cu was impregnated into UiO-66, Cu@UiO-66 as the precursor was then calcined at different temperatures to obtain CZ-x-T catalysts. At last, all these catalysts were reduced under H2flow at 300 °C before the characterizations.
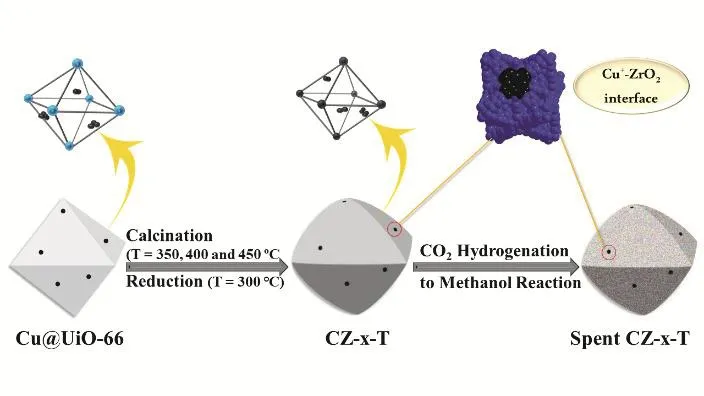
Scheme 1 Illustration of synthesis and evolution of Cu/ZrO2 catalysts for methanol synthesis.
After calcining in air, the morphologies of CZ-x-T catalysts went through structural collapse and deformation compared with the 3D octahedral structure of UiO-66, as shown in SEM images(Fig. 1a-d), which may promote the formation of interfaces between Cu and ZrO2. Microstructure characteristics of calcined catalysts with chopped Brunauer-Emmett-Teller (BET) surface area (30-50 m2·g-1) compared with UiO-66 supporter (1291.8 m2·g-1) (Table S1) verifies the collapse of open-framework structure. It is concluded that the higher the calcination temperature, the smaller the surface area from BET surface area of CZ-0.5-300 (49.1 m2·g-1) and CZ-0.5-450 (32.1 m2·g-1). In term of the effect of Cu content, the octahedral structure of CZ-0.7-400 catalysts calcined with higher Cu loading was almost completely destroyed compared to CZ-0.5-400 (Fig. 1c,d). This indicates that increasing Cu loading damages the maintaining of support structure due to the strong interaction between Cu and ligands of UiO-66. It is thus concluded that both high calcination temperature and loading Cu result in destroying the octahedral structure of UiO-66. N2adsorption-desorption isotherms of calcined catalysts (Fig. S3) belong to type IV isotherm,indicating the existence of mesoporous structures. Pore-size distributions derived from N2desorption isotherms (Fig. S4)suggest that the catalysts still possess the mesoporous structures after calcination. TEM image of CZ-0.5-400 catalyst (Figs. 1e and S5) shows the particles keep three-dimensional structure with rough surface, which is consistent with the SEM analysis.The lattice fringe of 0.276 nm in Fig. S5 implies the formation of tetragonal ZrO2(t-ZrO2). As metallic Cu was exposed to air during TEM characterization process, a lattice fringe of 0.252 nm of CuO (11)plane was observed (Fig. S5).

Fig. 1 Structure characterization of the reduced CZ-x-T catalysts. SEM images of (a) UiO-66 and reduced CZ-x-T catalysts: (b) CZ-0.5-350,(c) CZ-0.5-400 and (d) CZ-0.7-400; (e) TEM image of CZ-0.5-400; (f) XRD patterns of all the reduced CZ-x-T catalysts.
XRD patterns (Fig. 1f) were obtained to investigate the structure evolution of catalysts with different calcination temperature and Cu loading. The pattern shows (101), (002),(112) and (211) lattice planes of tetragonal ZrO2(t-ZrO2) at 30.2°, 50.4°, 35.3° and 59.9° (PDF#79-1767). Note that, the broad peak at ca. 30.2° appears except CZ-0.5-450, implying the existence of amorphous ZrO2(a-ZrO2) that can be turned into t-ZrO2at higher calcination temperature. Thus, CZ-0.5-450 catalyst has the strongest diffraction peaks belonged to t-ZrO2.The signals at 43.3°, 50.4° and 73.8° are assigned to (111), (200)and (220) diffraction peaks of metallic Cu (PDF#85-1326). And the (111), (200) and (220) diffraction peaks of Cu2O are also observed at 36.5°, 42.5° and 61.6°, respectively (PDF#78-2076),indicating the existence of Cu2O due to the strong metal-support interactions (SMSIs). With the increase of Cu content and calcination temperature, the diffraction peaks of CuO and Cu sharpen due to the agglomeration of copper species. Generally speaking, metallic Cu species come from the reduction of Cu2+,and Cu2O may originate from the reduction of embedded Cu2+in ZrO2crystal lattice that are difficult to reduce thoroughly. It is reported that Cu+species are observed in the CuO reduction pathway in Cu/ZrO2catalysts42-44. And the quite stable Cu+as intermediate Cu species in the CuO reduction are formed as active species in the steam reforming of methanol over Cu/ZrO2catalysts44,45. Grabowski et al.6suggested that the sites of Cu+next to oxygen vacancy sites of ZrO2works as acid centers active toward methanol synthesis. We thus propose that ZrO2facilitates the formation of Cu+-ZrOxinterfaces that act as active sites through trapping copper.
We next explored the reducing capacity of CZ-x-T catalysts.The reduction of Cu species highly depends on its dispersion,crystallinity and particle size. Usually, small CuO particles are reduced more easily than larger CuO particles or well crystallized CuO. The H2-TPR profiles of CZ-x-T catalysts (Fig.2) show two main peaks, one of which is at the lower temperature region (460-480 K). The lower temperature region is attributed to the reduction of highly-dispersed CuO species on the surface. The higher temperature (500-530 K) is assigned to crystallized CuO in bulk phase or highly-dispersed copper species in a strong interaction with the support. As revealed by TPR profiles, high calcination temperature can not only affect the interaction of Cu species and ZrO2supporter but also facilitate the production of surface highly-dispersed CuO species. With increasing Cu loading, the aggregation CuO species and its grain growth occur, leading to the increase in reduction temperature. In a word, increasing calcination temperature and decreasing Cu contents promote the reduction of copper, which stands for the increase in reducibility of catalyst.

Fig. 2 H2-TPR profiles of CZ-x-T catalysts.
3.2 Catalytic activity in methanol synthesis
We then evaluated the activity of the CZ-x-T catalysts in methanol synthesis from CO2hydrogenation at a temperature range from 230 to 280 °C. Fig. 3 shows the catalytic results including CO2conversion, methanol selectivity, space-time yield (STY) of methanol and the relationship of CO2conversion and methanol selectivity. Due to the exothermic character of methanol synthesis (ΔrH(298K)= -49.5 kJ·mol-1) and endothermic character of reverse water gas shift (RWGS)(ΔrH(298K)= 41.2 kJ·mol-1)22, CO2conversion (Fig. 3a) and CO selectivity (Fig. S6) show an increase trend as the actual reaction is under kinetic control, while methanol selectivity (Fig. 3b)shows a opposite trend as the reaction temperature increases.
As revealed by the methanol STY distributions (Fig. 3c), the methanol STY of the CZ-x-T catalysts increase with the temperature rising. For the CZ-0.5-T catalysts with the low Cu content, CZ-0.5-400 shows the highest methanol STY at all reaction temperatures and its value reaches 587.8 g·kg-1·h-1at 280 °C. Interestingly, CZ-0.5-350 has the highest methanol selectivity but the poorest CO2conversion among all the catalysts, with methanol selectivity of more than 79.2% at the expense of CO2conversion of below 7.6%.
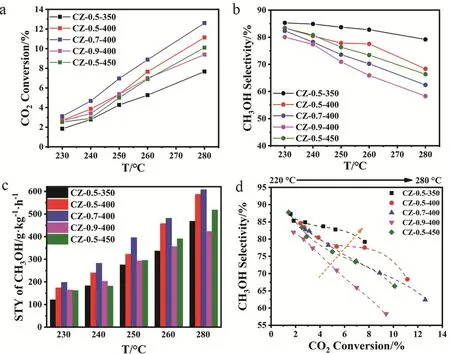
Fig. 3 Catalytic activity: (a) CO2 conversion, (b) methanol selectivity, (c) methanol STY and (d) methanol selectivity as a function of CO2 conversion at different temperatures.
The calcination temperature of 400 °C is chosen for further investigation of Cu loading effects. Compared with other CZ-x-400 catalysts, CZ-0.7-400 exhibits the higher methanol STY of 607 g·kg-1·h-1at methanol selectivity of 62.4% and CO2conversion of 12.6% at 280 °C. Then we investigated the dispersion behavior of surface metallic Cu in catalyst by N2O oxidation and the followed H2reduction titration (Table 1). The actual Cu dispersion is determined by exposed Cu atoms/total Cu atoms.
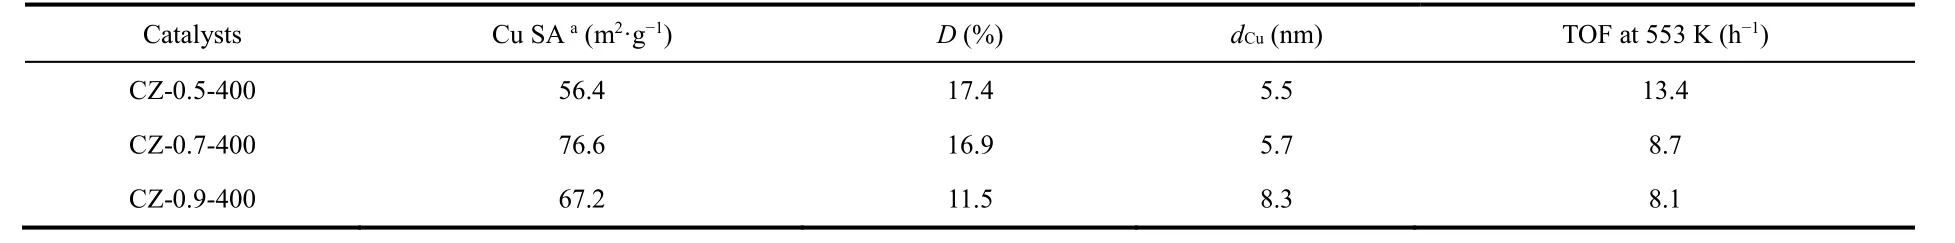
Table 1 Dispersion behavior, particle size of surface metallic Cu in catalysts and the calculated methanol TOF.
As revealed by Table 1, the Cu surface area and Cu particle size increase as the Cu loading increases, which agrees well with above discussion. And the dispersion decreases from 17.4% of CZ-0.5-400 to 11.5% of CZ-0.9-400. The turnover frequency(TOF) for methanol synthesis is then calculated according to the methanol STY divided by the amount of surface Cu atoms,assuming all the surface Cu atoms take part in this reaction. CZ-0.5-400 gives the highest TOF of 13.4 h-1. The excellent catalytic ability could be attributed to the high Cu dispersion and the moderate Cu particle size (5.5 nm). The methanol selectivity as a function of CO2conversion is visualized in Fig. 3d to make a fair comparison of catalyst activity. It is clear that the trend line for CZ-0.5-350 is in the region of higher methanol selectivity than others. However, its CO2conversion is the lowest compared with other catalyst at the same reaction temperature, getting a poor methanol STY. By comparison, CZ-0.5-400 has the excellent performance in terms of methanol selectivity and CO2conversion. What’s more, a time-on-stream (TOS) test of 30 h was performed to examine the long-term stability of CZ-0.5-400 at 260 °C (Fig. S7) which exhibits good durability for 30 h, in terms of CO2conversion, methanol selectivity and yield. We have compared reaction performance of CZ-0.5-400 with other reported ZrO2-containing Cu-based catalysts (see Table 2). And then, CZ-0.5-400 catalyst was employed to investigate the structure evolution during reaction process and reaction pathway.
3.3 Structure evolution
In order to further understand catalytic active sites, we conducted TEM and XRD characterization of spent catalysts.The surface of the spent CZ-0.5-400 was coarser than that of the reduced sample but the rough octahedron structure could still be observed, manifesting the good structure stability (Fig. 4a). For XRD patterns of spent catalysts (Fig. 4c), except the very sharp peaks belonging toquartz sand that wasn’t singled out completely, we can conclude that there is no much structural change over catalyst after reaction. Cu0and Cu+are the two main existential states of Cu species in which Cu+may be the main active site. After the reaction, diffraction peak at 30.2° has a tendency to sharpen over catalyst, indicating a further crystallization of ZrO2during reaction process. In particular, the sharpt-ZrO2diffraction peaks in the XRD pattern of CZ-0.5-400(red line in Fig. 4c) compared with the reduced sample (red line in Fig. 1f) could be observed obviously. After the long-period TOS test, the structure of spent CZ-0.5-400 has no noticeable change (Fig. S8). We then investigated the change of Cu particlesize after different reaction time according to Cu (111) lattice plane (Table S2). It is found that the average size of Cu particles increases from 5.1 to 12.7 nm due to a slight aggregation of particles during reaction.
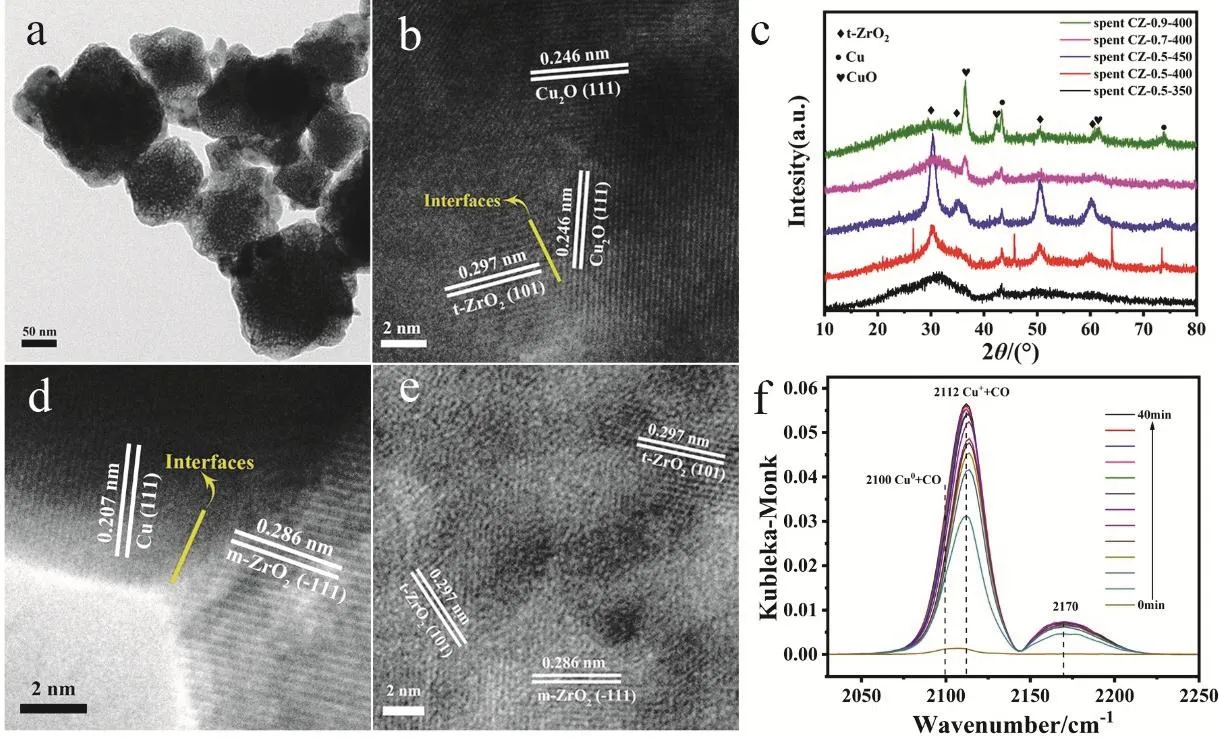
Fig. 4 TEM images of spent CZ-0.5-400 after CO2 hydrogenation reaction (a, b, d and e), (c) XRD patterns of all spent CZ-x-T catalysts and(f) in situ DRIFTS spectra of CO adsorption on reduced CZ-0.5-400.
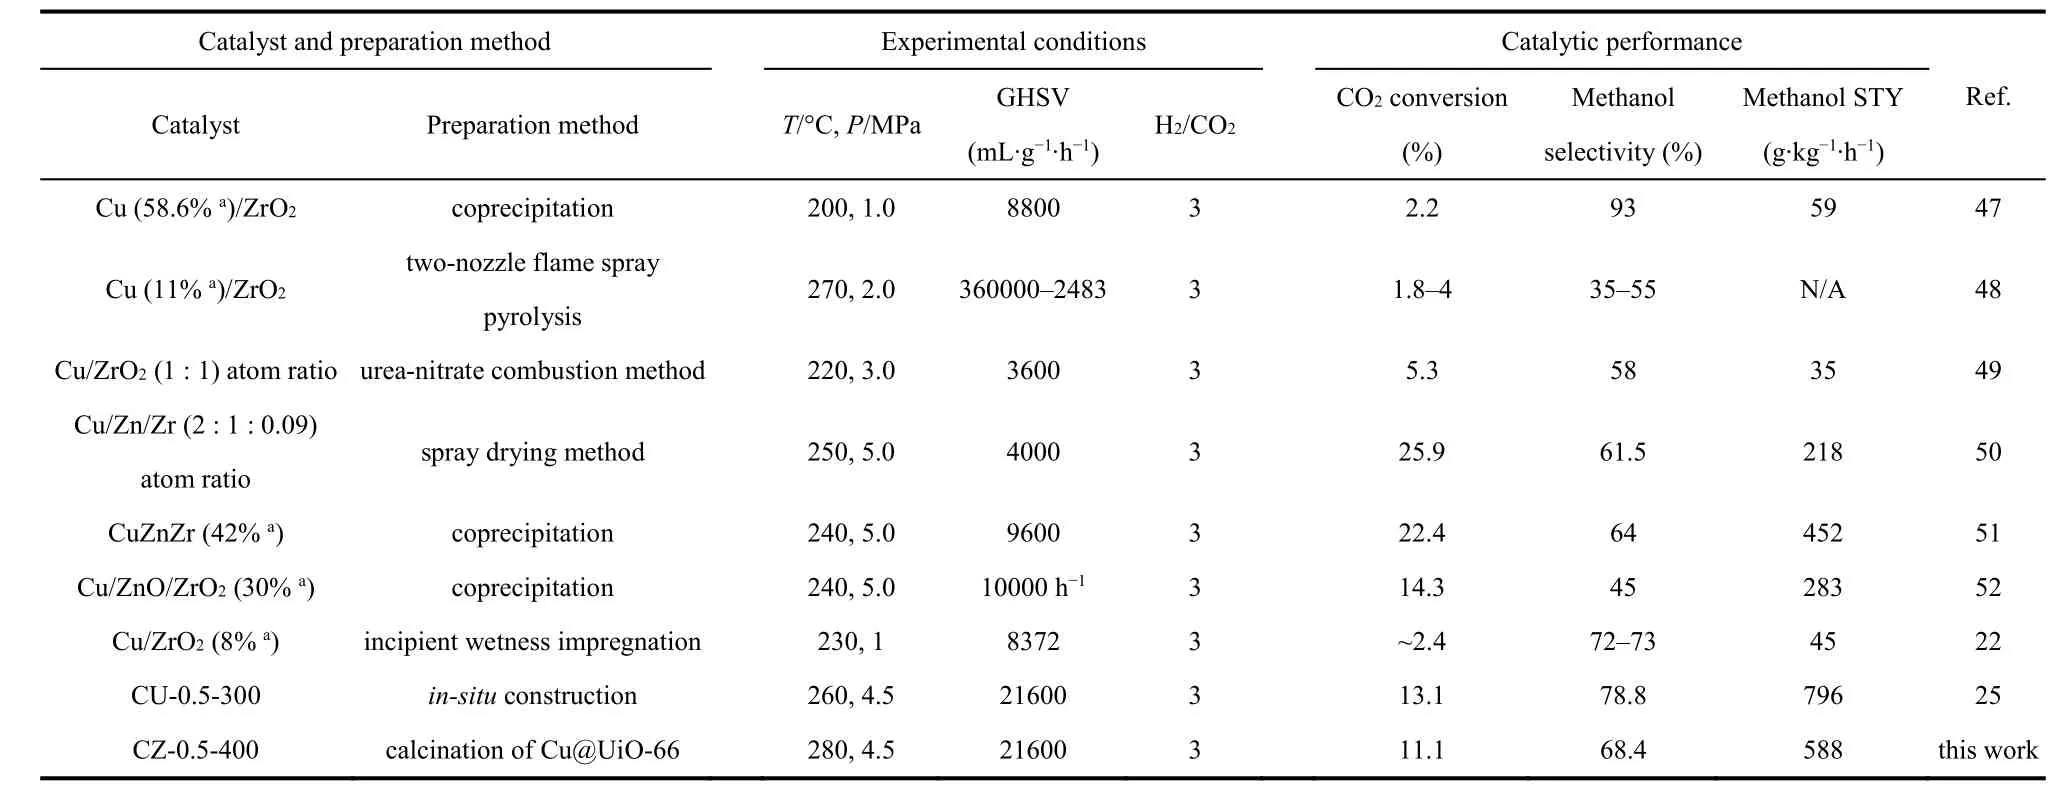
Table 2 Comparison of activities over our CZ-0.5-400 catalyst with other reported ZrO2-containing Cu-Based catalysts in methanol synthesis reaction.
The lattice fringes of 0.286 nm in Fig. 4d and e belong to(11)lattice plane of monoclinic ZrO2(m-ZrO2), which meansm-ZrO2wasin situtransformed from a-ZrO2. In Figs. 4b, d and S9, we can see the existence of the interfaces between Cu species and ZrO2from the close contact between Cu2O (111), Cu (111)or CuO (111) andt-ZrO2(101) or m-ZrO2(11)lattice fringes.It is worth noting that most of CuO is on the surface of the catalyst (Fig. S9b), which means that CuO is most likely oxygenated from Cu or Cu2O by air during the TEM test. It has been accepted that Cu-ZrO2interface is the active sites over ZrO2supported copper-based catalysts5,23,53,54. However, among the three types of ZrO2(m-ZrO2,t-ZrO2,a-ZrO2), which one is the most active phase is still controversial. Rhodeset al.24suggested that Cu/m-ZrO2is more active than Cu/t-ZrO2toward methanol synthesis from CO, while Witoonet al.8found that TOF of methanol over Cu/t-ZrO2is much higher than a-ZrO2and m-ZrO2. The high TOF of methanol is caused by a strong Cu-ZrO2interaction and a high surface concentration of atomic hydrogen to CO2. There is also a point that a-ZrO2is more active. Tadaet al.7reported that Cu/a-ZrO2is highly active and selective in the direct synthesis of methanol from CO2hydrogenation as the result of high dispersion of Cu species and weak adsorption of methanol. Regardless of the above controversy, it can be proposed that the reaction takes place at the interface between Cu species and ZrO2. The high activity is attributed to the formation of Cu-ZrO2interface during calcination and reaction conditions. And the active interface is optimized by adjusting calcination temperature and active metal size.
In order to figure out the valence state of Cu, we next performedin situDRIFTS of CO adsorption over CZ-0.5-400(Fig. 4f). The vibration frequency of 2170 cm-1is assigned to gaseous phase CO molecules. There is a characteristic vibration frequency at 2112 cm-1which is assigned to the adsorption of CO on Cu+55,56. The asymmetry of CO adsorption band is caused by the coexistence of a small amount of Cu0. The stretching vibrations of CO bonded to the surface copper metal sites is about 2100 cm-1suggesting Cu0and Cu+are the two main existential states and this result agrees well with XRD patterns.We can also see the same result from the DRIFTS spectra of CO adsorption swept by Ar (Fig. S10). XPS and Auger spectra were also used to identify the valence of Cu species. Fig. 5 shows Cu 2pand CuLMMspectra. In Fig. 5a, the main peak of Cu 2p3/2at 932.5 eV belongs to low-valence Cu0/Cu+species and the peak of 933.6 eV is ascribed to Cu2+because of the partial oxidation of catalyst surface when exposed in air. The Cu-LMMAuger XPS spectrum in Fig. 5b is fitted into three peaks: 572.6, 570.3 and 568.5 eV corresponding to Cu+, Cu2+and Cu0, respectively57,which proves the existence of a large portion of Cu+species in the catalyst.
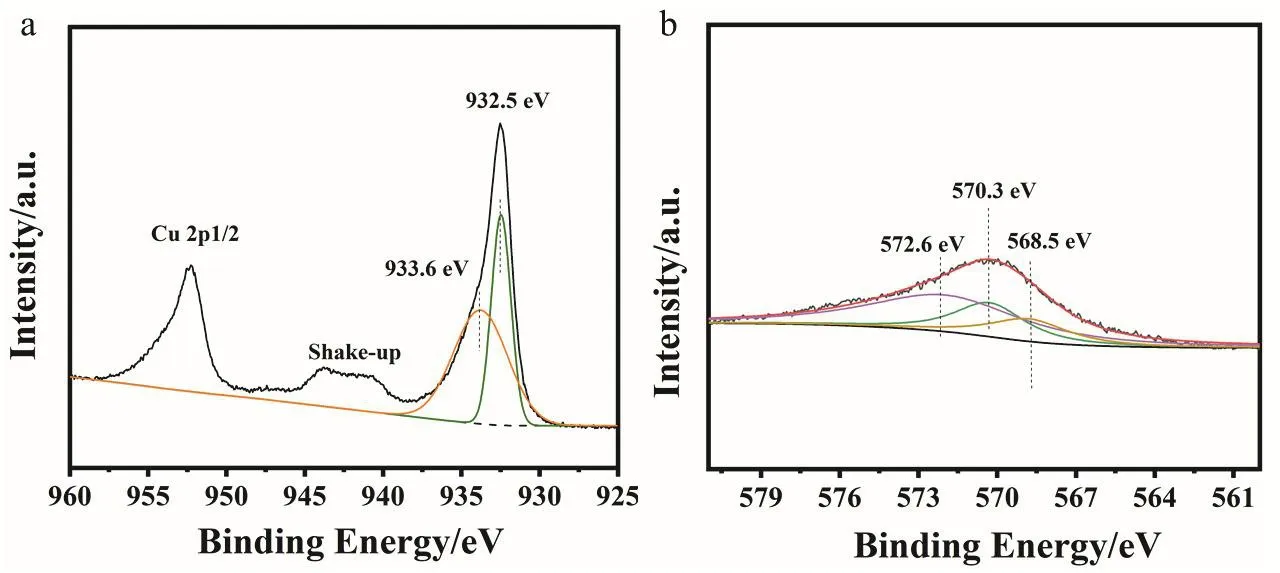
Fig. 5 Deconvolution of (a) Cu 2p and (b) Cu-LMM Auger XPS spectra for the CZ-0.5-400 catalyst.
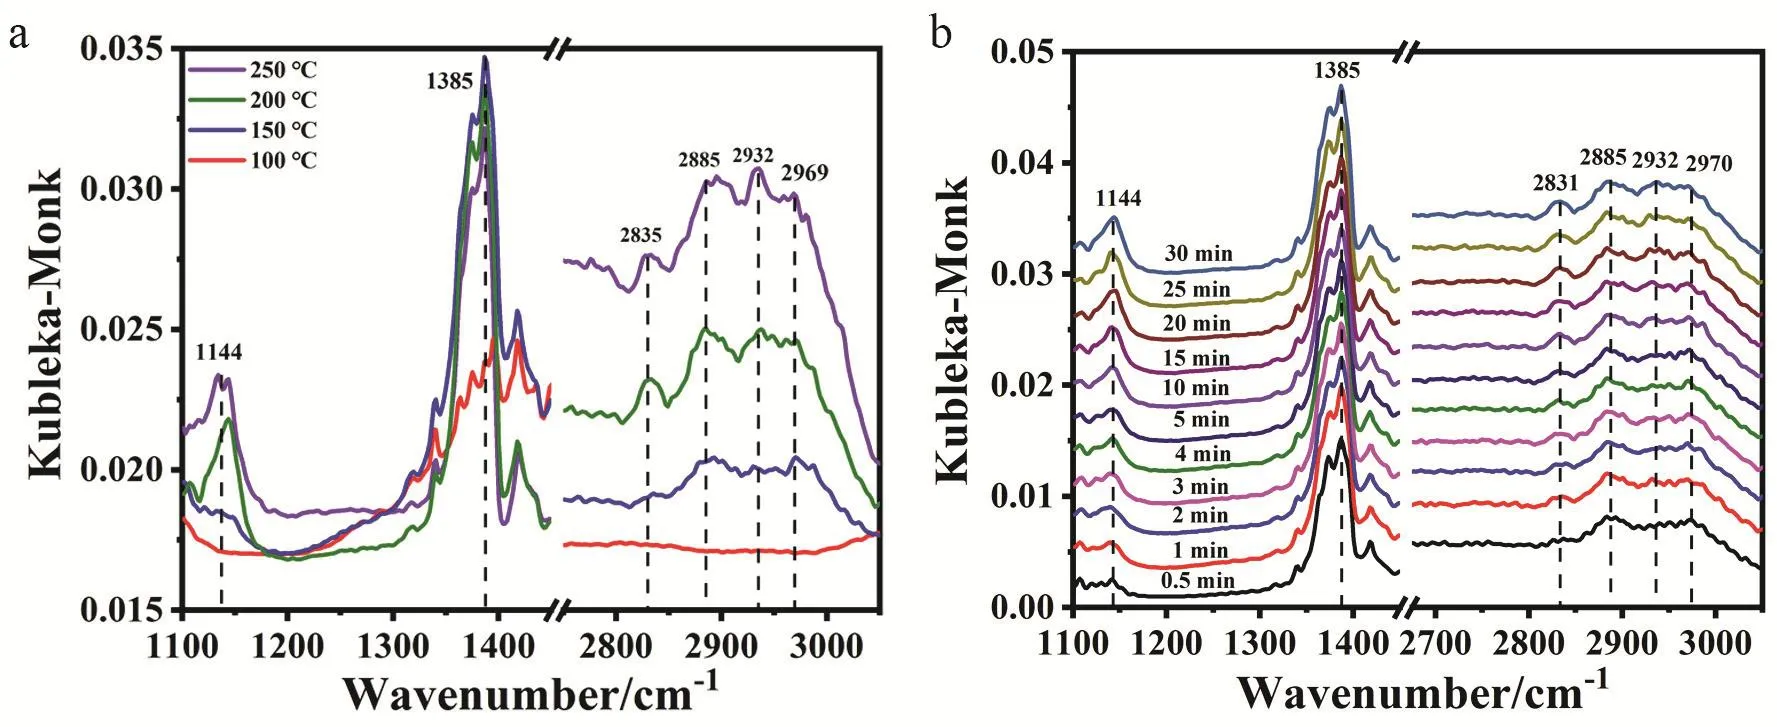
Fig. 6 Study on surface reaction mechanism over CZ-0.5-400. (a) In situ DRIFTS spectra of CO2 + H2 co-adsorption taken at a reaction temperature range from 100 °C to 250 °C and (b) dynamic IR spectra with exposure time at 200 °C.
As we all know, Cu0can be easily reduced from CuOxspecies under hydrogenation conditions over Cu/ZnO/Al2O3catalysts58.In this Cu/ZrO2catalyst system, there are considerable amount of Cu+in both the reduced and spent catalysts. Combined with above XRD patterns and TEM images, we can conclude that Cu@UiO-66 precursor transformed into the form of polymorphous ZrO2supported Cu catalysts under air calcination conditions. In this process, plenty of Cu-ZrO2interfacial sites were built, and Cu+species generated at the interface. Grabowskiet al.6suggested that the presence of oxygen vacancy sites on the Cu/ZrO2catalysts provides stabilization of Cu+cations. We think ZrO2could facilitate the formation of Cu+species that are trapped by the ZrO2lattice. As the reaction progresses, more tetragonal and monoclinic ZrO2was produced making the stable existence of Cu+species. The favorable activity may come from the formation of abundant Cu+species adjoining ZrO2.What’s more, the Cu-ZrO2interface could act as a bridge of transporting hydrogen from active Cu species to ZrO2. On the other hand, the oxygen vacancy of ZrO2promotes the adsorption and activation of CO2. Thus, we can draw a conclusion that, Cu-ZrO2interface is the reaction active center and both Cu+trapped in ZrO2lattice and oxygen vacancy are the active site of methanol synthesis from CO2hydrogenation.
3.4 Reaction pathway investigation
In situ diffuse reflectance Fourier transform infrared spectroscopy (DRIFTS) and temperature-programmed surface reaction-mass spectroscopy (TPSR-MS) were conducted for better understanding the reaction mechanism of CO2hydrogenation to methanol. Fig. 6a shows the IR spectra taken at different reaction temperatures over the CZ-0.5-400 sample,from which we can see all the peaks intensify with increasing reaction temperature, indicating that the process of CO2hydrogenation requires some energy barrier and high temperature is beneficial to this process. The signals at 2969,2885 and 1385 cm-1are assigned to δ(CH) + νas(OCO), ν(CH)and β(CH) of format species (HCOO*), respectively23,59. At 100 °C, there is almost no signal and the weak signals of HCOO*appear when the temperature is increased to 150 °C. The signals at 2932, 2835 and 1144 cm-1are assigned to νas(CH3), νs(CH3)and ν(CO) of methoxy species (CH3O*), respectively23,53,59.CH3O* begins to emerge at 200 °C, indicating the high energy barrier for its formation. At 250 °C, the peak intensity of HCOO*declines with the rising intensity of CH3O*. We can easily see the gradual increase in the CH3O*/HCOO* intensity ratio from the peaks of 2885 and 2932 cm-1from 150 to 250 °C. This phenomenon could also be observed in the dynamic change of IR spectra taken at 200 °C on the same sample in Fig. 6b. The intensity of signals (1144, 2835 and 2932 cm-1) assigned to CH3O* increases with increasing exposure time. And the signals assigned to HCOO* almost have no change, which is to say, the intensity ratio of CH3O* to HCOO* is getting increase. It can be thus concluded that CH3O* comes from the continuing hydrogenation of HCOO*. We next performed TPSR-MS measurements of CO2+ H2co-adsorption over CZ-0.5-400 (Fig.S11). At 349 K, MS signals of CO2(m/z = 44) and HCOOH (m/z= 46) are observed. The former is manifested as the desorption of CO2pre-adsorbed on the catalysts. The latter HCOOH signal is due to the reaction of co-adsorbed CO2and H2on the catalyst.At 407 K, we can observe H2(m/z = 2) consumption along with the production of H2O (m/z = 18) as a result of the reaction of surface OH group with dissociated hydrogen atom. At the same time, MS signal of CH3OH (m/z = 32) is observed with no CO(m/z = 28) signal. Combined with our previous works25, we believe methanol synthesis from CO2hydrogenation follows a HCOO*-intermediated pathway. Thereinto, CO2is firstly adsorbed on ZrO2and then goes through hydrogenation to HCOO* species with atomic hydrogen being supplied by spillover from active Cu species at Cu+-ZrO2interface. HCOO*undergoes stepwise hydrogenation to CH3O*. Then, subsequent reaction follows the pathway CH3O* → CH3OH* → CH3OH(g).
4 Conclusions
In summary, we have demonstrated an effective method for the design of interfacial sites of Cu/ZrO2catalyst. In this strategy, UiO-66 was exploited to confine Cu particles and plenty of Cu-ZrO2interfaces were built via controlled calcination conditions. At the same time, abundant Cu+species were stabilized by the Cu-ZrO2interfaces. The optimized CZ-0.5-400 catalyst shows the highest methanol TOF of 13.4 h-1with CO2conversion of 11.1% and methanol selectivity of 68.4% at 280 °C and 4.5 MPa. Such good performance is attributed to the production of abundant Cu+-ZrO2interfacial sites. This work would provide a method to fabricate active interfacial sites derived from MOF materials.
Supporting Information:available free of charge via the internet at http://www.whxb.pku.edu.cn.
Author Contributions: The manuscript was written through contributions of all authors. All authors have given approval to the final version of the manuscript.