Grain refinemen and weak-textured structures based on the dynamic recrystallization of Mg-9.80Gd-3.78Y-1.12Sm-0.48Zr alloy
2021-05-21YunweiGuiLingxiaoOuyangYujieCuiHuakangBianQuananLiAkihikoChia
Yunwei Gui, Lingxiao Ouyang, Yujie Cui, Huakang Bian, Quanan Li, Akihiko Chia
a Department of Materials Processing, Graduate School of Engineering, Tohoku University, 6-6-11 Aoba, Aramaki, Aoba-ku, Sendai 980-8579, Japan
b Institute for Materials Research, Tohoku University, 2-1-1 Katahira, Aoba-ku, Sendai 980-8577, Japan
c School of Materials Science and Engineering, Henan University of Science and Technology, Luoyang 471023, China
d Collaborative Innovation Center of Nonferrous Metals, Henan Province, Luoyang 471023, China
Received 13 April 2020; received in revised form 30 May 2020; accepted 11 June 2020
Available online 30 June 2020
Abstract
Keywords: Magnesium-rare earth (Mg-Re) alloy; Grain refinement Discontinuous dynamic recrystallization (DDRX); Continuous dynamic recrystallization(CDRX); Hot indirect extrusion.
1. Introduction
Magnesium (Mg) and its alloys possess some remarkable properties, such as low density, high specifi strength,and high specifi stiffness [1,2,3]. However, its poor lowtemperature plasticity, particularly for rare earth Mg alloys,is a major disadvantage [3,4]. In general, there is only one athermal and easily activated basal 〈a〉 slip that does not easily meet the criteria of fi e independent slip systems [5,6].Another {10-12} tensile twinning, which has a low critical resolved shear stress at low temperatures, can only accommodate a limited strain of less than 10% [7,8]. Although other slip systems such as the pyramidal 〈c+a〉 slip and twining types like {10-11} can be activated by hot deformation, they are unlikely to achieve homogeneity throughout the material[9].
Besides slip and twinning, dynamic recrystallization(DRX) has an important role in Mg alloys during hot deformation in refinin coarse grains and avoiding the formation of microcracks [10,11,12,13]. Many studies have focused on the conventional mechanism of discontinuous DRX (DDRX)in Mg alloys with low stacking fault energy (SFE), which is divided into two separate stages of grain nucleation and growth. Nevertheless, the DRX grain size distribution of a homogeneous microstructure is not readily achieved due to different nucleation times, and partial dynamic grain growth of early-nucleated DRX grains [14,15,16]. Continuous DRX(CDRX) is also observed in low-SFE Mg alloys subjected to
https://doi.org/10.1016/j.jma.2020.06.001
2213-9567/© 2020 Chongqing University. Publishing services provided by Elsevier B.V. on behalf of KeAi Communications Co. Ltd. This is an open access article under the CC BY-NC-ND license (http://creativecommons.org/licenses/by-nc-nd/4.0/) Peer review under responsibility of Chongqing University high strain rates [17,18]. A texture was observed, such that the orientation of DRX grains was nearly comparable to that of the parent grains of the Mg alloy undergoing CDRX [19].Many efforts have been conducted to weaken this texture. For instance, the addition of Li and Y can alter SFE and activate non-basal 〈c+a〉 dislocations; thus, leading to a weaker basal texture compared with that of pure Mg [20]. Consequently, a uniform DRX grain microstructure with small grain size and weak texture is desirable and requires further investigation using hot deformation.
Severe plastic deformation methods such as hot indirect extrusion, equal channel angular pressing, and multi-directional forging are applied to achieve an ultrafin grain microstructure [12,13]. Hot indirect extrusion develops a uniform fl w pattern because no friction-induced heat is generated, and the alloys can be economically produced into fin grain microstructure by DRX [21,22,23]. However, the DRX mechanism during this process is yet to be systematically studied.
The commonly used Mg alloys, such as Mg-Al series alloys, have poor high-temperature mechanical properties.When the temperature exceeds 150°C, the strength of the alloys decreases significantl with increasing temperature,which seriously restricts their application.Rare earth elements are currently the most effective alloy elements to improve the high temperature mechanical properties of magnesium alloys.They can refin the microstructure, form a high melting point phase,and a solid solution with Mg alloys,thereby improving the high temperature mechanical properties of these alloys.For instance, the equilibrium solid solubility of gadolinium(Gd) and yttrium (Y) in Mg is large, decreasing with the temperature, hence presenting good solid solution strengthening and precipitation strengthening effects. Moreover, Gd and Y can also form a high melting point rare earth compound phase with Mg, which can effectively improve the high temperature mechanical properties of the alloy [24,25,26].
Samarium (Sm) is the element with the highest solid solubility of cerium (Ce) group in the Mg matrix (5.8%, mass fraction), which is close to the atomic size of Mg and can form up to fi e binary compounds with Mg.The solid solubility of Sm in Mg also decreases with decreasing temperature,so Sm has an excellent strengthening effect in Mg alloys[27].However, there are few systematic studies on hot deformation behavior of rare earth Mg alloys with Sm and high Gd (Gd≥9%, mass fraction). Therefore, in this paper, we selected the Mg-9.80Gd-3.78Y-1.12Sm-0.48Zr alloy and systematically studied the effects of various strains during hot indirect extrusion on the grain refinemen of the alloy using electron backscatter diffraction (EBSD). The DRX mechanism during hot indirect extrusion is also discussed.
2. Materials and methods
A newly developed Mg-RE alloy (Mg-9.80Gd-3.78Y-1.12Sm-0.48Zr, wt%) ingot was prepared by melting pure commercial Mg(99.95 wt%),Mg-(25 wt%)Gd,Mg-(25 wt%)Y, Mg-(20 wt%) Sm and Mg-(20 wt%) Zr in a crucible furnace at 1013K for 15min under CO2/SF6atmosphere (99:1 vol ratio). Subsequently, the melt was poured into a mold and cooled in air to 293K. An electron discharge machine(EDM) was used to cut a cylinder. The solution treatment was conducted for the cylindrical specimen at (798K, 10h),followed by water quenching. Instant indirect extrusions, with an extrusion ratio of 10, an extrusion rate of 25mm/s, were performed after a preheat treatment (773K, 10min) and then water quenching. The schematic diagram of this process is shown in Fig. 1a.
To analyze the microstructure evolution based on different strains, six specimens were cut by EDM at 5mm intervals along the extrusion direction (ED), starting from the bottom of the extruded bar (Fig.1b), labeled as Stage Ⅰ-Ⅵ(from low to high strain). The specimens were then polished using SiC grinding papers from #220 to #3000, followed by polishing for 5h using an automatic lapping machine with an oxide polishing suspension. Microstructural analyses of six as-extruded specimens were conducted using EBSD with an orientation microscope (TexSEM Laboratories, Inc., Provo, UT) attached to a field-emissio scanning electron microscope (FESEM)at 15kV acceleration voltage and 0.3μm step size. The microstructure observation was carried out in the central position of each stage (black boxes in Fig. 1b). The average grain size of each stage was then calculated from three different positions in every stage and the black box.
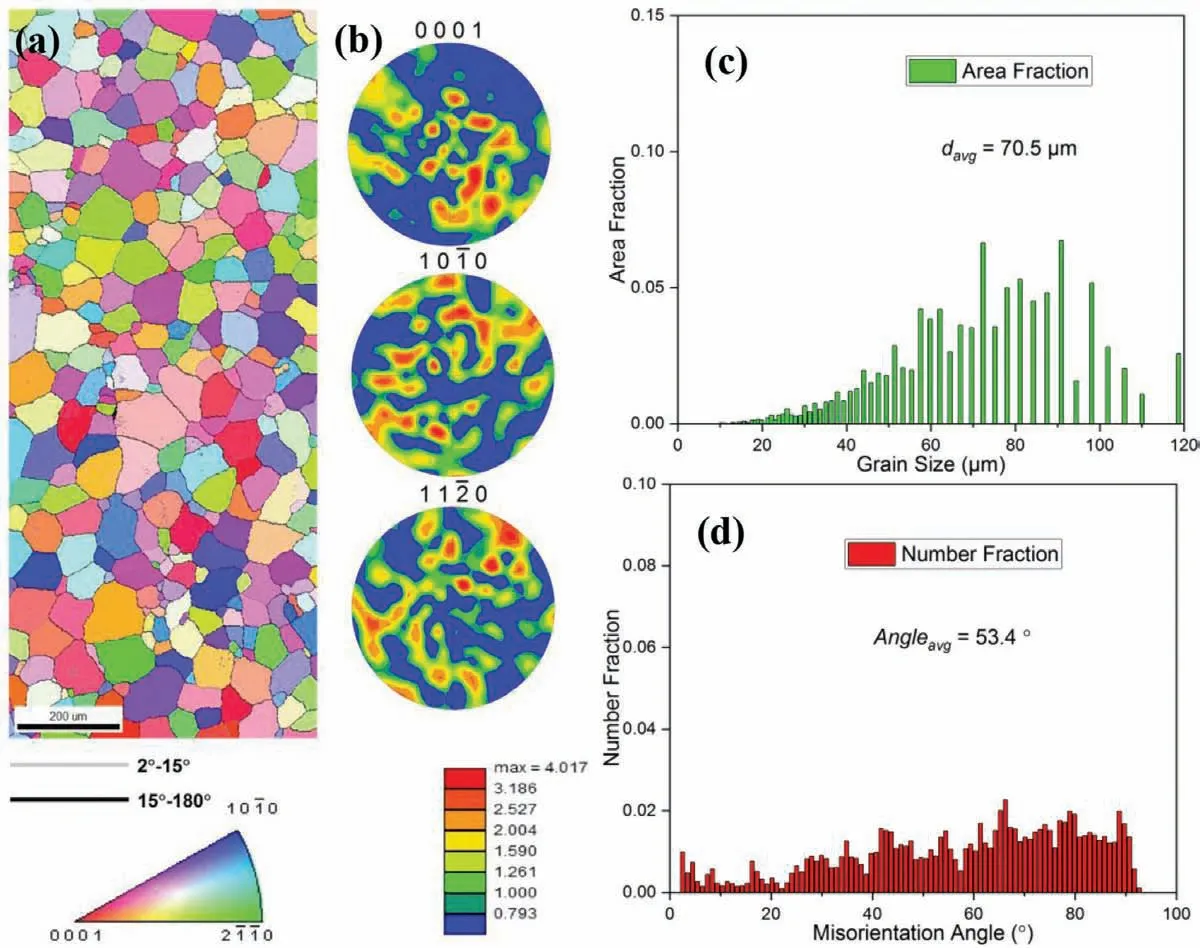
Fig. 2. Initial microstructure of the alloy after the solution treatment (a) IPF map; (b) The corresponding pole figure of {0001}, {10-10}, and {11-20}; (c)Grain size distribution; (d) Misorientation angle distribution.
3. Results
3.1. Initial microstructure
Fig. 2 shows the initial microstructure of the Mg-9.80Gd-3.78Y-1.12Sm-0.48Zr alloy subjected to solution treatment at 798K for 10h and then, quenched in water to 293K before hot indirect extrusion. The inverse pole figur (IPF) in Fig. 2a shows coarse grains without annealing twins. The average grain size is 70.5±5.2μm (Fig. 2c). The three overall polar figure of {0001}, {10-10}, and {11-20} reveal a weak texture (Fig. 2b). Therefore, the influenc of texture on the initial microstructure of the recrystallization process was not considered in the present study. The average misorientation angle (θavg) is 53.4° (Fig. 2d). The grain boundaries mainly consist of HAGBs with misorientation angles larger than 15°Only a small fraction of LAGBs (between 2° and 15°) are observed.
3.2. Microstructure evolution
Fig.3 shows the IPF maps of Mg-9.80Gd-3.78Y-1.12Sm-0.48Zr alloy subjected to hot indirect extrusion at various strains. At the initial stage of hot extrusion (Stage Ⅰ) in Fig. 3a, a coarse polycrystalline microstructure is observed with a set of twins-traversing coarse grains. With further deformation (Stage Ⅱ) in Fig. 3b, deformed coarse grains become slightly elongated and a few fin grains are observed along the original grain or twin boundaries.The occurrence of fin grains indicates dynamic softening induced by DRX after reaching a critical strain during hot extrusion. The fraction of fin recrystallization grains continues to increase during StageⅢ(Fig. 3c). This mixture of original large grains surrounded by fin recrystallization grains is regarded as the necklacetype microstructure, which reflect incomplete recrystallization. Finally, Fig. 3d, e, and f show the microstructure subjected to higher strains (Stage Ⅳ, Ⅴ, and Ⅵ). Deformed grains are gradually replaced by a large amount of recrystallization grains. The extent of recrystallization reaches its maximum at the highest strain (Stage Ⅵ), where complete recrystallization is almost achieved.
3.3. Grain size distribution evolution
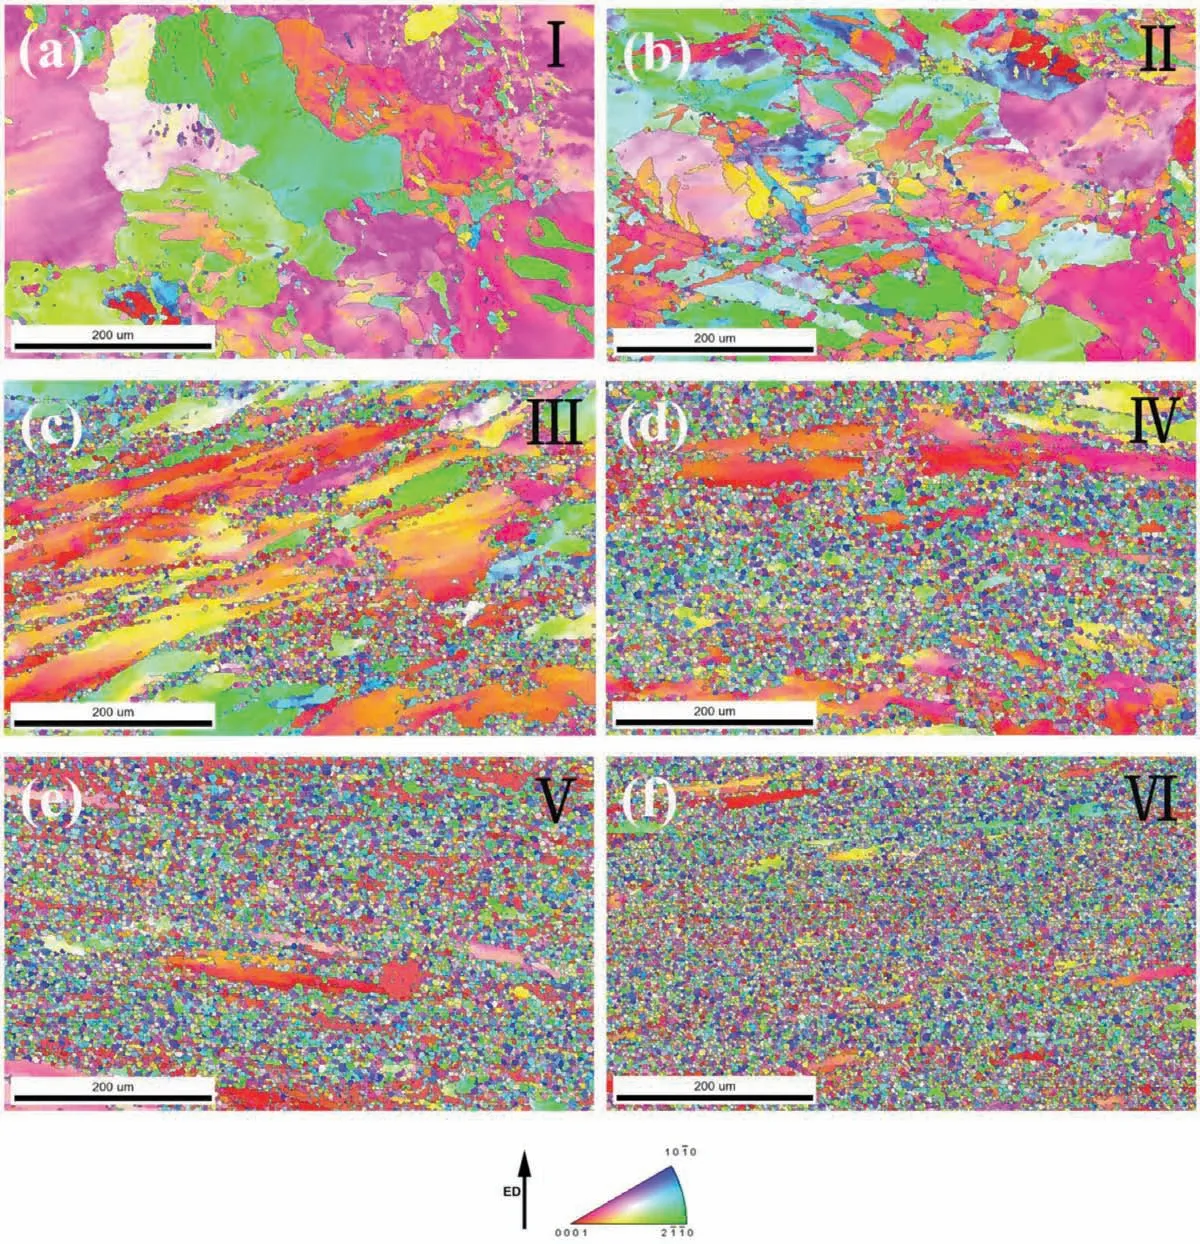
Fig. 3. IPF maps of Mg-9.80Gd-3.78Y-1.12Sm-0.48Zr alloy subjected to various strains (Stage Ⅰ-Ⅵ) during hot indirect extrusion.
The grain size distribution of various indirect extrusion conditions is shown in Fig. 4. In Stage Ⅰ, the average diameter of the overall grain size davgis 113.5±18.6μm,which is larger than that of the initial microstructure(70.5±5.2μm) due to the pre-heating treatment (773K,10min). The average grain sizes decrease with increasing strain from 53.2±10.3μm (Stage Ⅱ), 36.8±5.4μm (StageⅢ), 14.6±3.3μm (Stage Ⅳ), 8.9±1.5μm (Stage Ⅴ) to 5.2±0.6μm (Stage Ⅵ). This indicates that the coarse grains of the solution-treated sample are significantl refine by hot indirect extrusion. Furthermore, the grain size distribution gradually decreases from 0 to 189.9μm (Stage I) to 0-37.2μm (Stage VI). This narrowed range of the grain size distribution verifie a further increase in the extent of recrystallization, which agrees with the IPF maps in Fig. 3.
3.4. Misorientation distribution evolution
Fig. 5 shows the misorientation angle distributions at different strains. The evolution of the misorientation angle is closely related to the extent of recrystallization. Larger average misorientation angles due to the occurrence of new grains with HAGBs indicate the higher extent of recrystallization.The average misorientation angle (θavg) of Stage Ⅰis 20.8°Large fraction of LAGBs accounts for the low θavgvalue;thus, indicating that the microstructure evolution is still at the initial stage. When the strains increase (Stages Ⅱ, Ⅲ, Ⅳ,Ⅴ, and Ⅵ), θavgis 25.1°, 37.6°, 48.6°, 53.0°, and 54.4°, respectively. This indicates the extent of recrystallization was enhanced with increased strain, and the maximum reached at Stage Ⅵ. In addition, two peaks of the misorientation angle at 56±5° and 86±5° are observed at Stages Ⅰand Ⅱ, respectively. The rotation axis is 〈10-10〉 around 56±5° in Fig. 5a and 〈2-1-10〉 around 86±5° in Fig. 5b and their peaks are verifie as caused by {10-11} compression twins and {10-12} tensile twins, respectively. However, similar peaks of the misorientation angle are not observed in Stages Ⅲ-Ⅵ, indicating the disappearance of twins upon recrystallization.
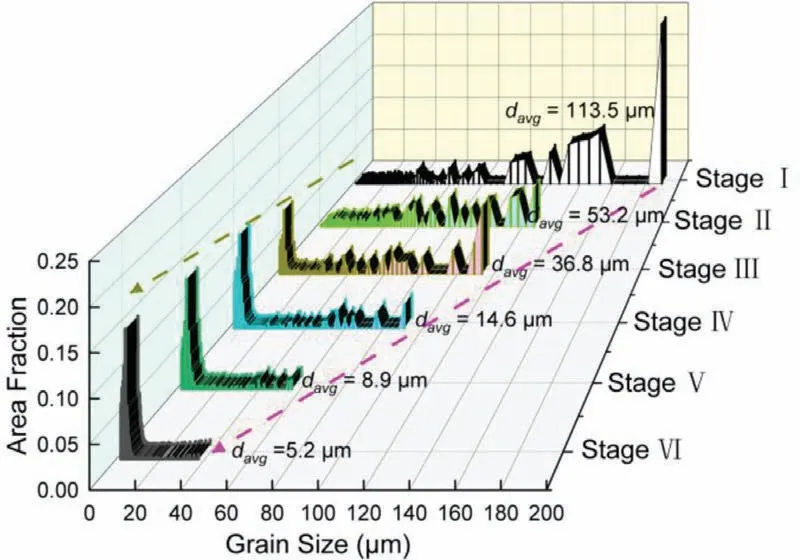
Fig. 4. Average grain size distribution of Mg-9.80Gd-3.78Y-1.12Sm-0.48Zr alloy subjected to various strains (Stage Ⅰ-Ⅵ).
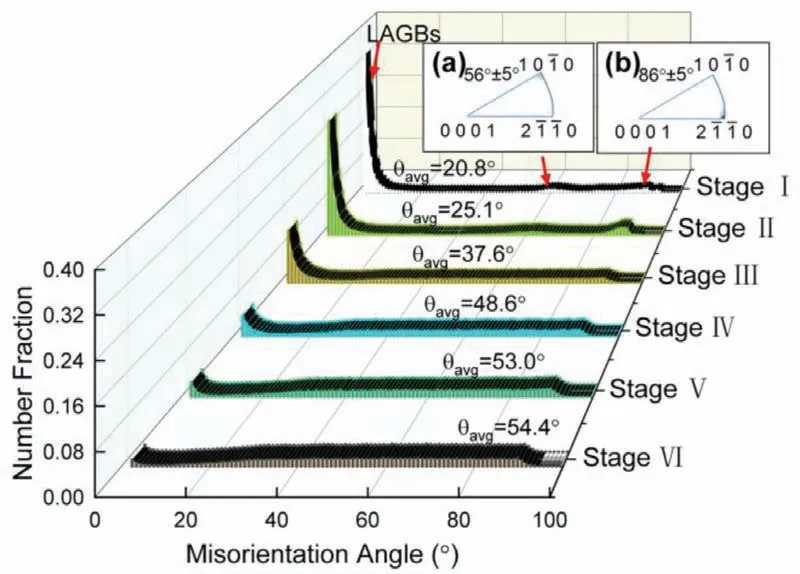
Fig. 5. Misorientation angle distribution of Mg-9.80Gd-3.78Y-1.12Sm-0.48Zr alloy subjected to various strains (Stage Ⅰ-Ⅵ).
3.5. Grain boundary maps
The orientation imaging microscopy(OIM)maps depicting the grain boundaries of Mg-9.80Gd-3.78Y-1.12Sm-0.48Zr alloy at different strains are shown in Fig. 6 for HAGBs(>15°) (black lines), and LAGBs (2~15°) (green lines). In addition, two types of twin boundaries, {10-11} compression twins (blue lines) and {10-12} twins (red lines) in StagesⅠand Ⅱ, respectively, are also depicted. Under initial strain conditions (Stages Ⅰand Ⅱ), a large fraction of LAGBs is observed in the interior of both matrix grains and twins. There are also several fin grains formed along the original and twin boundaries in Stages Ⅱ. As the strain is increased to Stage Ⅲ, the twin boundaries completely disappear and are replaced by recrystallization grains, which is consistent with the results in Fig. 5. The fraction of LAGBs gradually decreases, whereas the fraction of HAGBs increases with increasing strain in Stages Ⅳ, Ⅴ, and Ⅵ. In Stage Ⅵ, most boundaries are composed of HAGBs, indicating that recrystallization was almost completed.
4. Discussion
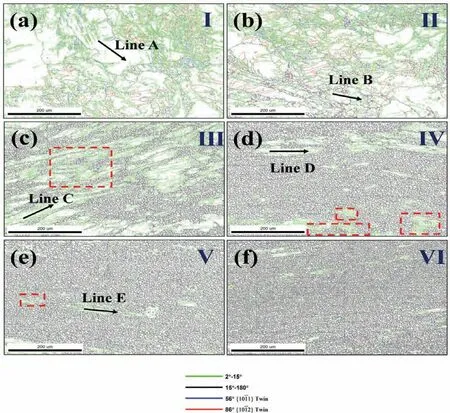
Fig. 6. Boundary maps of Mg-9.80Gd-3.78Y-1.12Sm-0.48Zr alloy after hot indirect extrusion at various strains (Stage Ⅰ-Ⅵ). Black lines refer to HAGBs(>15°), green lines for LAGBs (2~15°), blue lines for {10-11} compression twin boundaries, and red lines for {10-12} twin boundaries. (For interpretation of the references to color in this figur legend, the reader is referred to the web version of this article.)
Grains are significantl refine during the hot indirect extrusion process. However, this refinin mechanism needs to be further clarified Fig. 7 shows amplifie maps obtained by EBSD for the highest strain (Stage Ⅵ). Fig. 7a shows a large number of fin grains with a mean size of 3.4±0.2μm(Fig. 7e). Moreover, a minimal presence of LAGBs (green lines) are also observed in Fig. 7b. These results indicate a completely recrystallized microstructure. However, the recrystallization microstructure in Fig. 7a can not simply be regarded as DRX grains because these fin grains may contain dislocation-free static recrystallization (SRX) grains formed during the cooling stage after hot deformation [28,29]. The kernel average misorientation (KAM) calculation [30,31] and grain average misorientation (GAM) calculation [32,33] are applied to differentiate DRX, SRX, and deformed structures.For KAM calculation of a certain point (Pi), misorientations between the center point (kernel) and all surrounding points(each labeled as j) are calculated and then averaged, which is given by the following expression [34]:

where N is the number of surrounding points and Δθijis the corresponding misorientation between i and j. GAM calculation is another grain-based function used to identify local orientation variations of each grain (labeled as Gi) [35]:

where n is the number of pixels in the interior of each grain.Herein, DRX grains are define as equiaxial fin grains with HAGBs [36]

It is known that a high KAM or GAM values within a grain indicate a high density of substructures associated with a high density of dislocations in the grain interior. Many substructures form in deformed grains after the hot deformation,resulting in higher corresponding KAM or GAM values. Deformed grains are define as those having KAM or GAM>1° Compared with deformed grains, there are fewer residual substructures in DRX grains because these grains formed at the cost of stored energy provided by substructures. DRX grains are define as those having KAM or GAM <1° but/= 0° SRX grains are dislocation-free new fin grains. SRX grains are define as those having KAM or GAM=0° [13].KAM and GAM calculation by Eqs. (1) and (2) are shown in Fig. 7c and d, respectively. The points are mostly green or light blue, which represents dislocation-residual. Furthermore, KAM and GAM distributions are illustrated in Fig. 7f and g, with largest values of less than 1° but not equal to 0°,which is typical for a complete DRX condition observed at the highest strain (Stage Ⅵ) in the study.
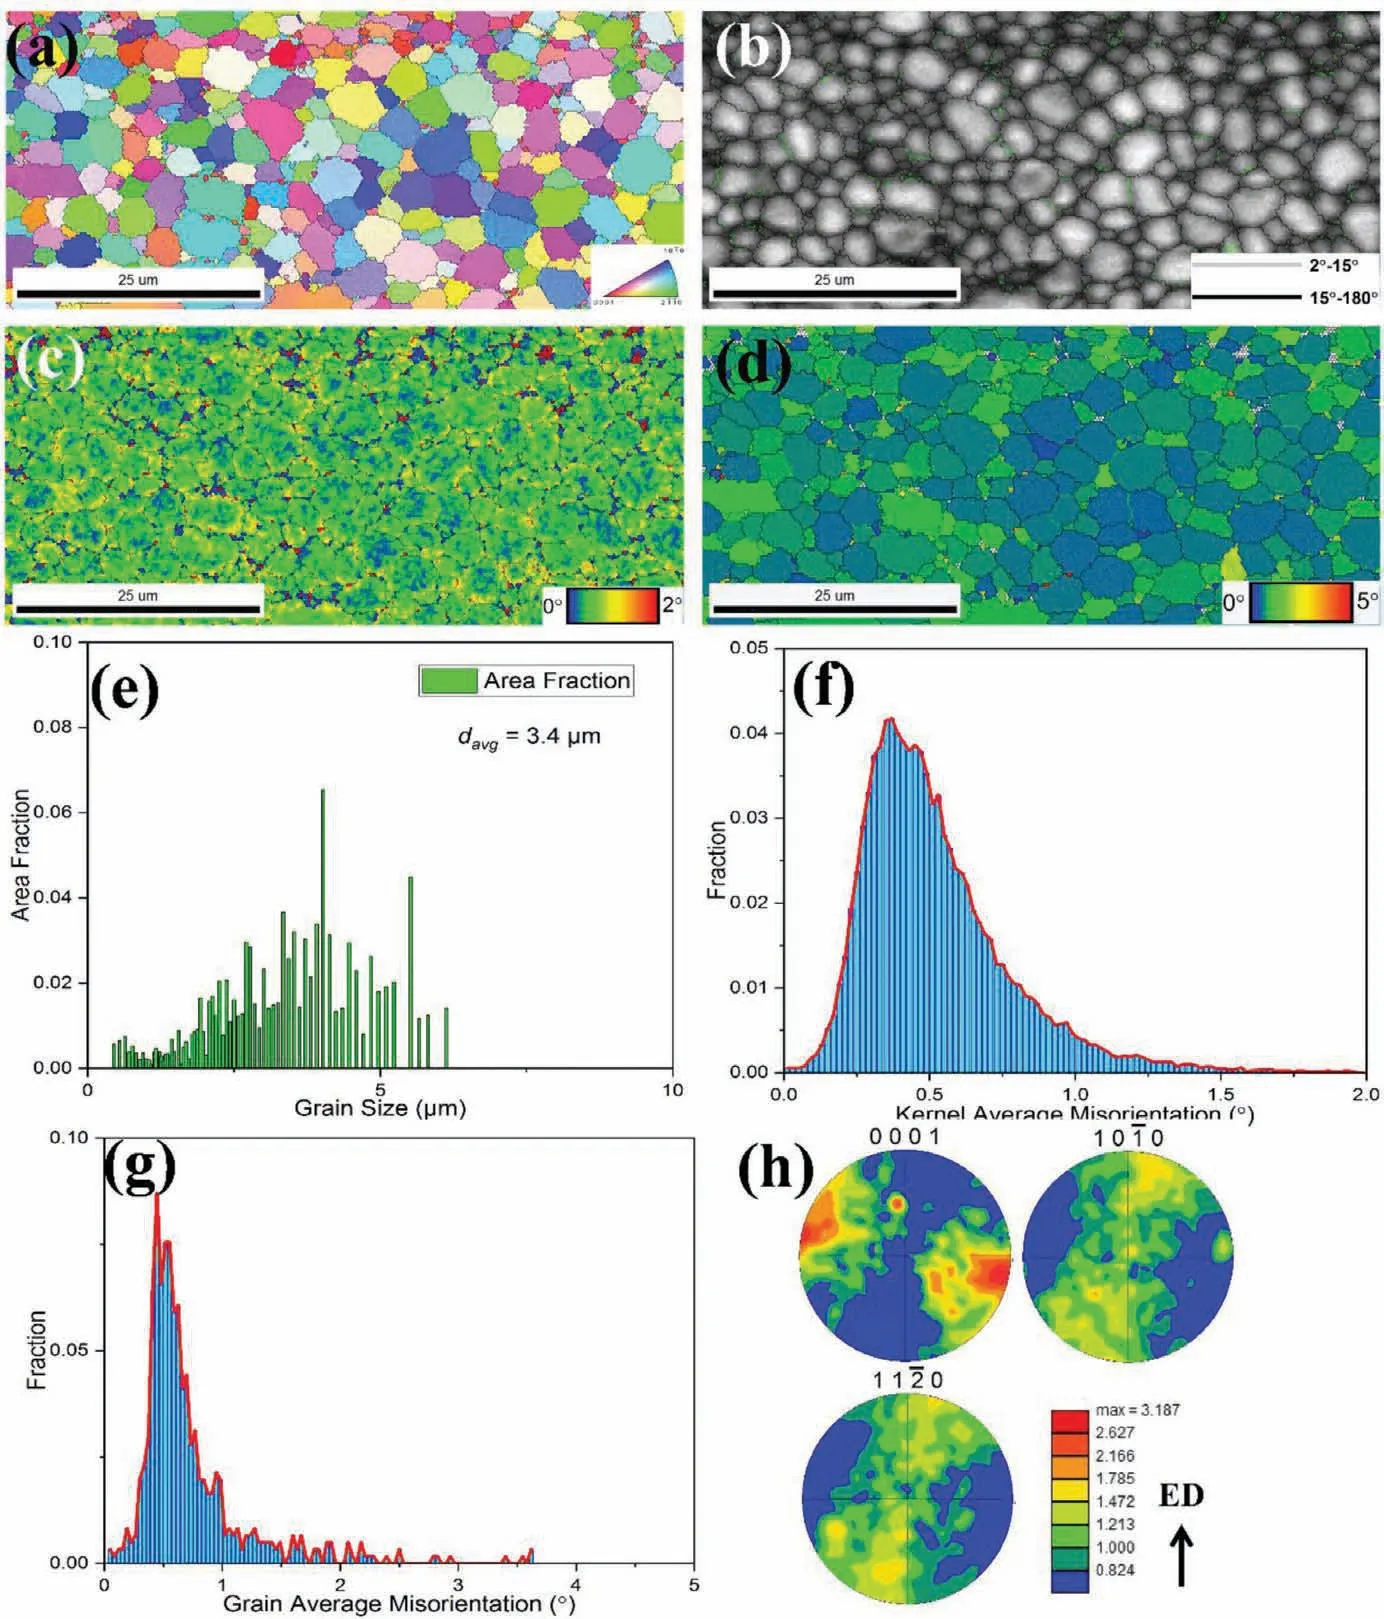
Fig. 7. Enlarged (a) IPF map, (b) Boundary map and the corresponding (c) KAM and (d) GAM map, (e) Grain size distribution, (f) KAM and (g) GAM value distribution, and (h) Pole figure of Mg-9.80Gd-3.78Y-1.12Sm-0.48Zr alloy at Stage Ⅵ.
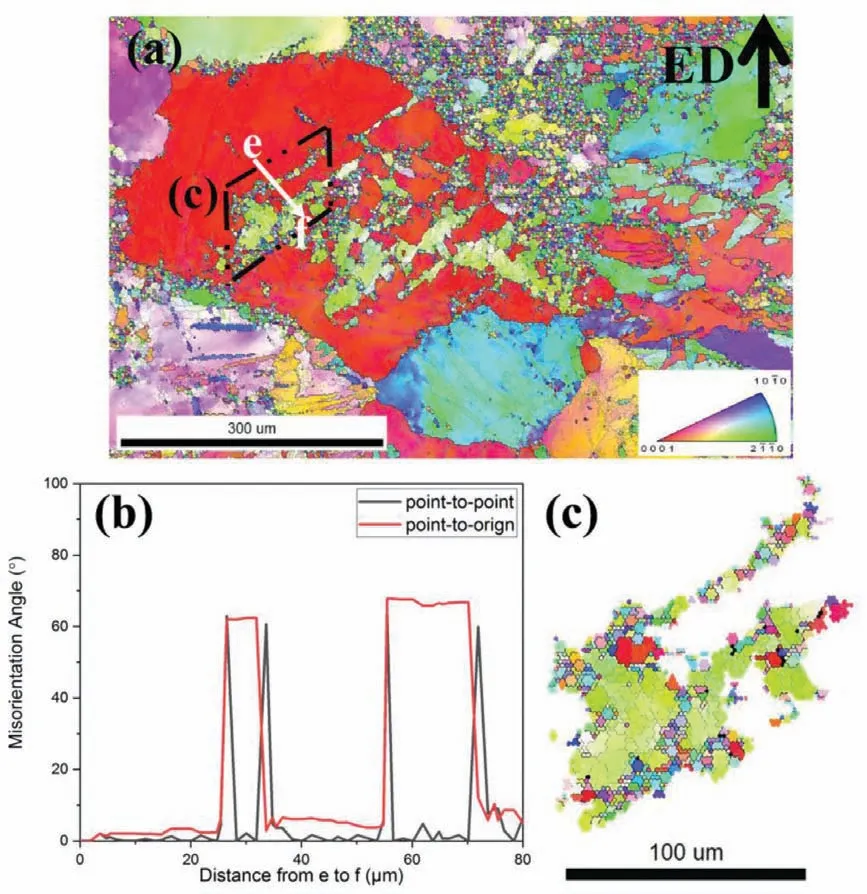
Fig. 8. Maps from the EBSD data of Stage II, (a) IPF map showing a mixture of twins, DRX grains, and deformed grains; (b) Misorientation measurements along Line e-f; (c) Subgrains with LAGBs (grey lines) and DRX grains with HAGBs (black lines) of the typical twin-DRX zone in (a).
In addition, pole figure of {0001}, {10-10}, and {11-20}in Fig. 7h reveal a weak texture. This may be attributed to the addition of rare earth elements, such as Y and Gd, which can induce comparatively weaker textures [37,38,39,40]. For instance, adding Y on the deformation mode results in the transformation of basal slip and tensile twinning into compression twinning and dislocation <c+a>slip. This enables more grain orientations to stabilize, resulting in a more randomized texture [39]. Another possible reason is the completely different orientation nuclei provided by DDRX [41],which contributes to the weak texture. The orientations of new grains through DDRX lead to weak textures as the crystal orientation of DDRX nuclei is not related to the original deformed grains [41,42].
In the OIM map of Stage Ⅰand Ⅱ(Fig. 6a and b), a large fraction of twins formed into original coarse grains. Deformation twins are sensitive to the stress level in Mg-based alloys and tend to form at relatively high strain rates during instantaneous indirect extrusion, with short deformation time[43,44,45]. Fig. 8b shows 56° {10-11} compression twins confirme by misorientation measurements by Line e-f in Fig. 8a. The volume fraction of twins effectively increases the density of HAGBs, which decreases the average size of original coarse grains. Fig. 8c shows a typical twin-DRX zone in Fig. 8a (black dotted box). Original twin boundaries become bulged and new DRX grains form along the bulged boundaries. This indicates that a typical DDRX process occurs along twin boundaries. With increased strain, the accumulated dislocations readily accumulate adjacent to HAGBs (original and twin boundaries) and increase the stored energy, leading to the formation of new grain nuclei along the twin boundaries [46,47]. As a result, the sites created by twin boundaries associated with significan stored energy will increase and finall lead to more nucleation of DDRX grains [48]. As mentioned, DDRX grains tend to grow (migration of grain boundaries) at the expense of residual substructures in the matrix grain after nucleation,which results in different grain sizes of DRX grains along HAGBs (original and twin boundaries) [49]. However, there are no nonhomogeneous grain sizes observed in complete recrystallization (Fig. 3c) because the growth of DDRX grains is difficul due to the short deformation time in this study.Besides, occurrence of effective dynamic recovery-mediated CDRX also take account for it. A CDRX process characterized by a significan number of LAGBs (grey lines) is also observed in Fig. 8c. The dislocation arrangement by climb and cross-slip can be readily activated at high deformation temperatures, such as 773K and high strain rates [50,51,52].
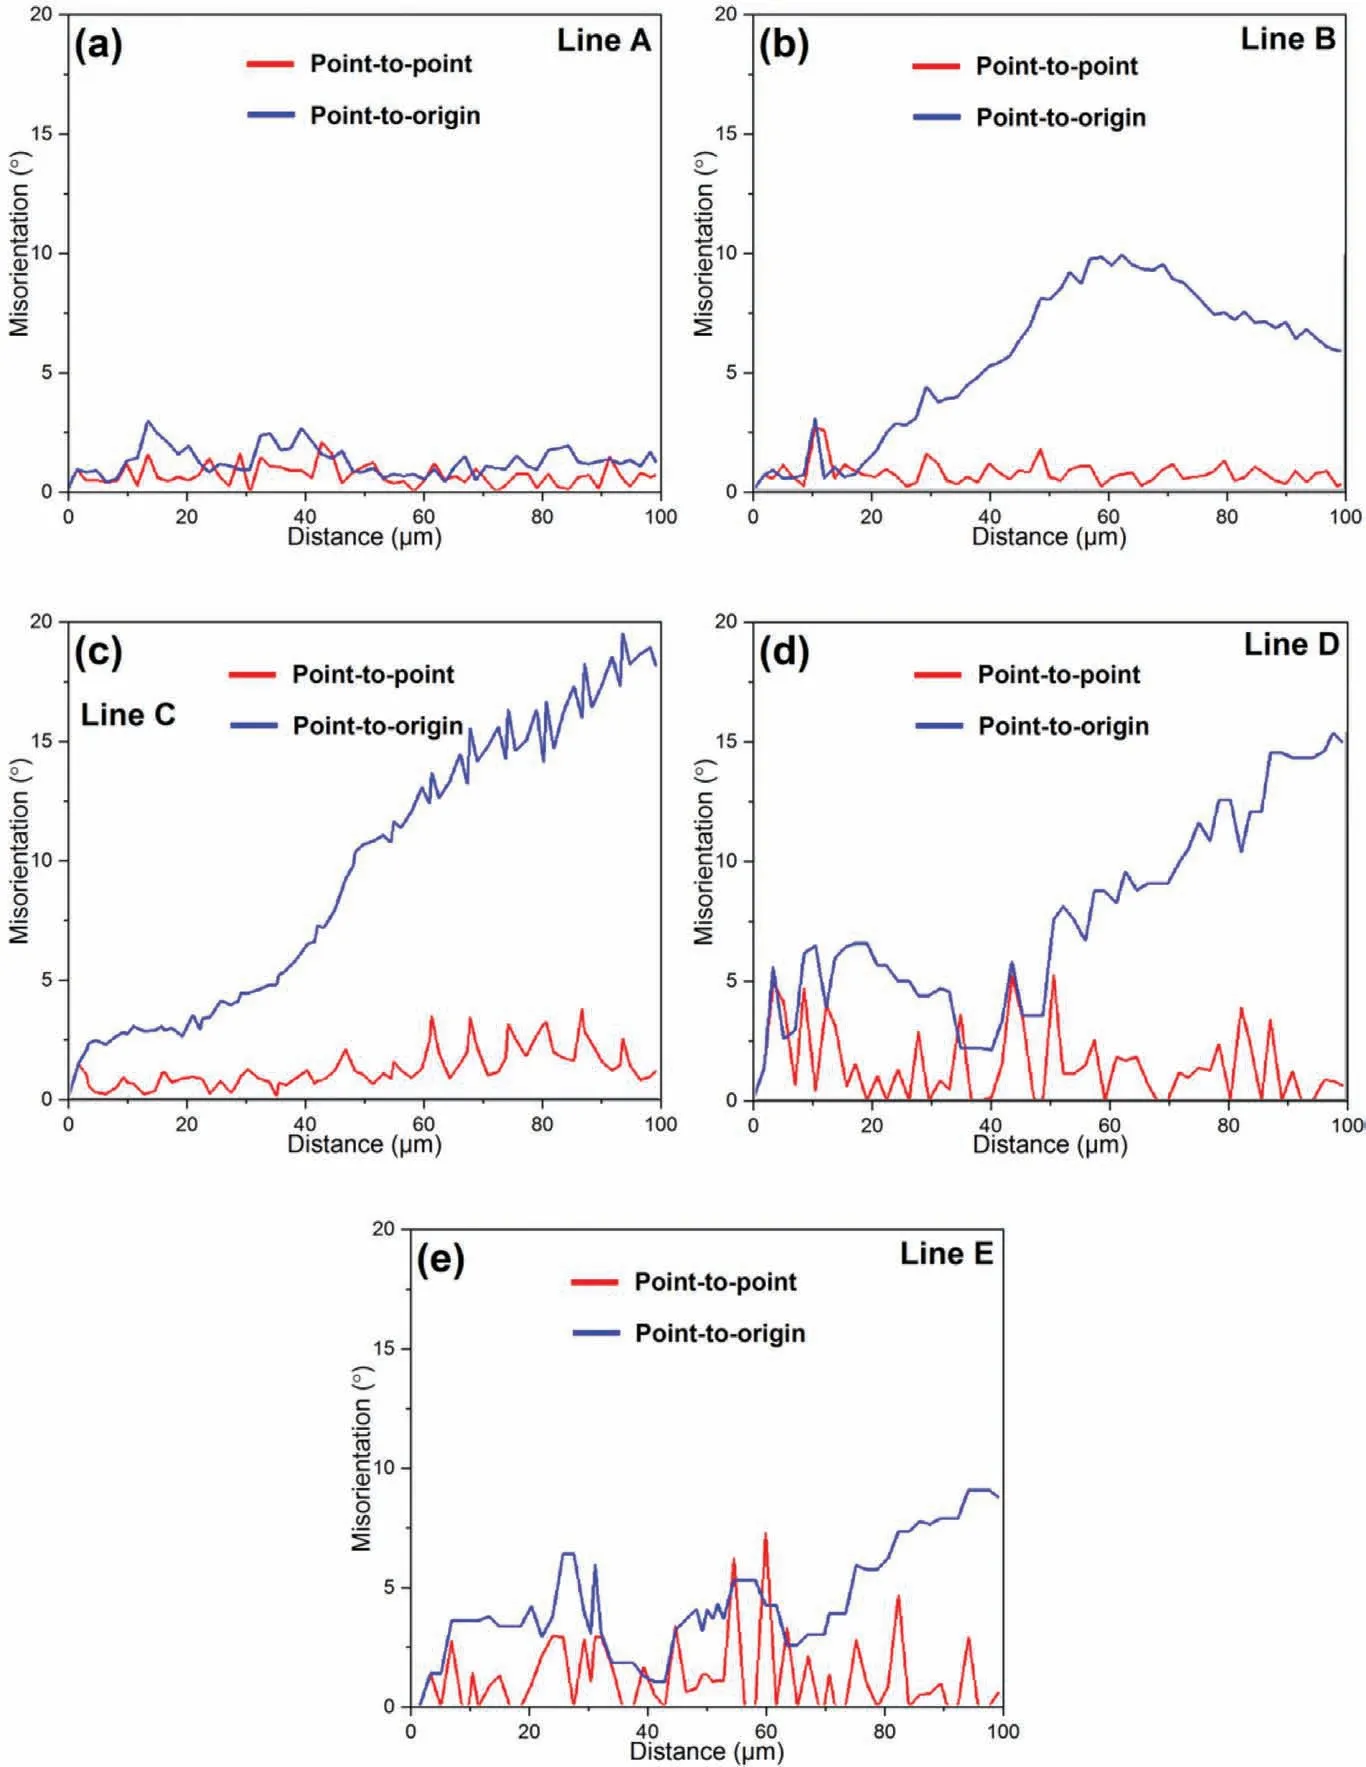
Fig. 9. Orientation gradient measured by Line A-E in Fig 6.
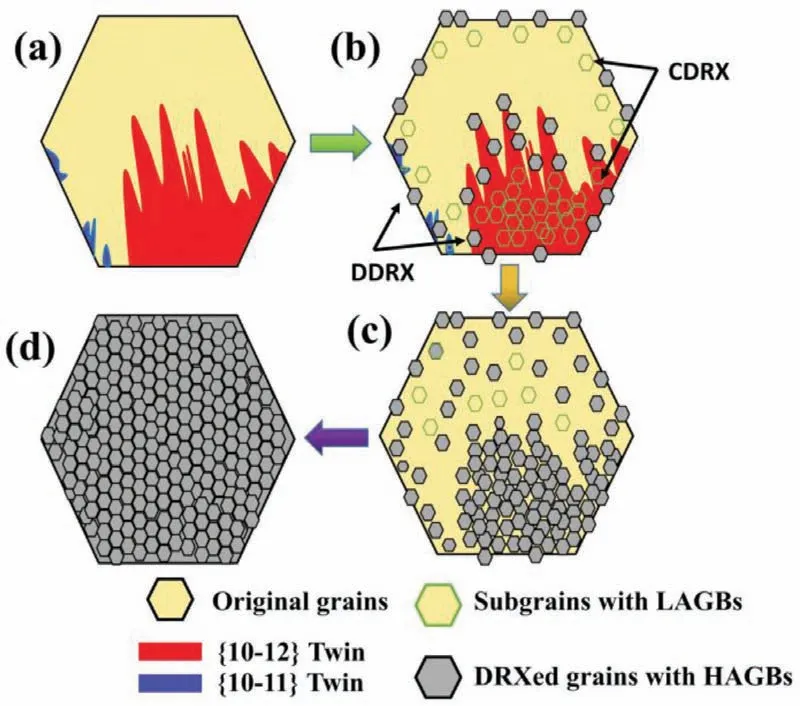
Fig. 10. Schematic diagram of the grain refinemen mechanism for Mg-9.80Gd-3.78Y-1.12Sm-0.48Zr alloy during hot indirect extrusion.
The evolution of the orientation gradient in the grain interior is also investigated by measuring orientation gradient with increased strain (Stages Ⅰ-Ⅵ). Fig. 9 shows the orientation gradients marked along Lines A-E in Fig. 6. For low strains(Fig.9a),both local(point-to-point)misorientation and cumulative(point-to-origin)misorientation in deformed grains are detected to be less than 2° and 3°, respectively, indicating extremely low misorientation gradients. For higher strains(Fig. 9b), the local misorientation increases slightly, whereas the cumulative misorientation also rises above 5° but does not exceed 10°, indicating the development of progressive subgrain rotation at a relative early stage of hot deformation.When the strain is increased to Stage Ⅲwhere there are a large number of fin grains, the cumulative misorientations highlighted by Line C gradually increases and exceeds 15°for ~75μm. Meanwhile, the corresponding local misorientation in Line C varies from 2 to 3°, which is higher than that of Lines A and B. As a result, the occurrence of CDRX is verifie by the transformation of LAGBs(2-15°)into HAGBs(>15°) at intermediate strain. Likewise, the accumulated misorientation gradient characterized by point-to-origin values exceeding 15° is also detected for Line D. LAGBs, indicated by a local misorientation of >2° in Line D, increase to ~5°at several local misorientations, which may have been formed by progressive rotation between adjacent subgrains [52]. Finally, for Line E, local misorientation shows the maximum value of ~7° at 63μm. Moreover, LAGBs in the deformed grain interior are connected to form subgrains (green lines,highlighted by red dotted boxes in Fig. 6c, d, and e) with similar grain size to that of new DRX grains (black lines).This observation conclusively demonstrates the occurrence of CDRX process by the evolution of LAGBs to HAGBs in deformed grains.
In summary, Fig. 10 illustrates the DRX process for Mg-9.80Gd-3.78Y-1.12Sm-0.48Zr alloy during hot indirect extrusion. At the initial strain stage, deformed twinning occurs in Fig. 10a. In Fig. 10b, with increasing strain, DDRX grains occur along both twin and matrix grain boundaries. Subgrains characterized by a sizable fraction of LAGBs are formed by dislocation arrangements in the twins and original grain interior. LAGB networks gradually increase their misorientation through progressive rotation of subgrains, finall resulting in HAGBs (DRX grains), which replace the twins and interior of deformed grains (Fig. 10c). Finally, a homogenous and complete DRX microstructure is achieved, as observed in Fig. 10d.
5. Conclusions
In the present study, the grain refinemen of the newly developed Mg-9.80Gd-3.78Y-1.12Sm-0.48Zr alloy was achieved by instantaneous hot indirect extrusion. The effects of activated twins and the criteria of refine DRX microstructures after hot deformation were discussed.The mechanism of the DRX process in grains during hot indirect extrusion was also explained.The main conclusions are as follows:
1. The coarse grain microstructure of the alloy was signifi cantly refine during instantaneous hot indirect extrusion.A homogeneous microstructure with a weak texture was obtained.
2. The extent of DRX increases with increasing strain and reaches a maximum at the highest strain. KAM and GAM maps obtained by EBSD data were applied to differentiate DRX and SRX grains from deformed grains. A typical DRX condition without SRX grains was observed in StageⅥ.
3. Two main twin types in the Mg alloys were activated at the initial deformation stage, which consisted of 86° {10-12} tensile twins and 56° {10-11} compression twins. The twin boundaries provided more sites for DDRX grain nuclei. Besides the DDRX process, the CDRX process involved a progressive increase in the misorientation of subboundaries as LAGBs evolved into HAGBs in grains. By combining DDRX and CDRX processes, a weak textured fine-grai microstructure was achieved.
Declaration of Competing Interest
None
Acknowledgement
The authors, Quanan Li and Yunwei Gui, are grateful for the financia support from the National Natural Science Foundation of China (Grant no. 51571084). Yujie Cui gratefully acknowledge the financia support from the Grant-in-Aid for Early-Career Scientists (Grant no. 18K14024). Yunwei Gui would like to acknowledge financia support from the China Scholarship Council (Grant No. 201908410208).
杂志排行
Journal of Magnesium and Alloys的其它文章
- Mechanism of Mn on inhibiting Fe-caused magnesium corrosion
- An efficien and comparative adsorption of Congo red and Trypan blue dyes on MgO nanoparticles: Kinetics, thermodynamics and isotherm studies
- Twin recrystallization mechanisms in a high strain rate compressed Mg-Zn alloy
- Corrosion behaviour and cytocompatibility of selected binary magnesium-rare earth alloys
- Correlation between test temperature, applied load and wear transition of Mg97Zn1Y2 alloy
- Residual stress and precipitation of Mg-5Zn-3.5Sn-1Mn-0.5Ca-0.5Cu alloy with different quenching rates
