Effect of corrosion inhibiting compounds on the corrosion behaviour of pure magnesium and the magnesium alloys EV31A, WE43B and ZE41A
2021-05-21AkifSoltanMatthwDargushZhimingShiFionaJonsBarryWoodDarrnGrrardAndrjAtrns
Akif Soltan, Matthw S. Dargush, Zhiming Shi, Fiona Jons, Barry Wood,Darrn Grrard, Andrj Atrns
a School of Mechanical and Mining Engineering, The University of Queensland, Brisbane, Qld 4072, Australia
b UQ Materials Performance, The University of Queensland, Brisbane, Qld 4072, Australia
c Centre for Microscopy and Microanalysis, The University of Queensland, Brisbane, Qld 4072, Australia
d Defence Materials Technology Centre, DMTC Limited, Level 2, 24 Wakefield Street, Hawthorn, Vic 3122, Australia
eDefence Science and Technology Group, 506 Lorimer Street, Fishermans Bend, Vic 3207, Australia
Received 5 November 2019; received in revised form 22 April 2020; accepted 22 July 2020
Available online 6 October 2020
Abstract
Keywords: Magnesium; Weight loss; Hydrogen evolution; XPS; FTIR; Corrosion inhibition.
1. Introduction
1.1. Corrosion inhibiting compounds
The poor corrosion resistance of Mg alloys limits their more widespread acceptance as a construction material [1-10]. Adequate performance often requires surface treatments,coatings [11-25] and organic [26-34] and inorganic [35,36]corrosion inhibitors. Long chain organic compounds such as amides and carboxylates have been effective in inhibiting corrosion in steels [37]. A large number of small molecules have been studied as modulators for Mg corrosion [38,39].Calado et al. [40] studied tri(bis(2-ethylhexyl)phosphate)(Ce(DEHP)3) as a novel corrosion inhibitor for AZ31. Corrosion inhibitors may be characterised by their inhibition efficien y η, which may be evaluated using:

Corrosion inhibiting compound (CIC) have practical application if damage of the coating on the Mg helicopter gearbox occurs while the helicopter is on a ship at sea on active duty. Under these circumstances, a temporary corrosion inhibiting compound(CIC)can allow that helicopter to continue on duty. This is a temporary protection that allows continued helicopter use until the helicopter can be brought in for proper maintenance and repair of the protective coating. That is the background for the current research.
Commercial products include the corrosion inhibiting compounds (CICs) Ardrox 3961, LPS 2, LPS 3 and AMLGuard,which were designed to provide short term corrosion protection for metallic components,during manufacturing,transport,storage and maintenance.These have been used in the maintenance of aircraft,including navy aircraft[41-44].There is significan information for aluminium, steels and copper alloys,which is not reviewed herein. In contrast, there is little information regarding the action of these CIC on Mg. This is the reason for this research.These CICs contain organic inhibitors such as benzotriazole, phosphates and barium petroleum sulfonates. The existing information regarding these inhibitors is reviewed herein.
Benzotriazole, an ingredient in Ardrox 3961, was an effective corrosion inhibitor for copper, iron and aluminium alloys,and acted by forming a protective fil [45-51]. Benzotriazole had mixed results for Mg alloys [29,52-54]. There was mild inhibition at the low concentration of 0.0005M but a substantial increase in the corrosion rate for higher concentrations[52]. Similarly, 0.02M benzotriazole was found to be effective [54] but the effectiveness sharply decreased with increasing concentration. Benzotriazole also increased the corrosion resistance of anodised AZ91A [29].
Petroleum sulfonates (including barium sulfonate in AMLGuard)are added to lubricants to inhibit rust and displace water [55-58]. 0.5% barium/calcium sulfonate improved the rust inhibition of mineral oil film [56], attributed to the surfaceactive properties, and the substantial side molecular chains.Similarly, 0.2% barium sulfonate increased the protectiveness of wax coatings on mild steel[59],attributed to the long chain of the sulfonate. Sodium dodecylbenzenesulphonate (SDBS)inhibited copper corrosion at 5×10⁻⁴mol dm-3, but inhibition efficien y decreased at higher concentrations [60]. Gao et al.[61]found that the inhibition efficien y of 16mM SDBS was 50% for AZ91D, whereas the efficien y was 98% in combination with 8-hydroxyquinoline (8HQ). The increase in efficien y was attributed to the adsorption of SDBS on the porous Mg(8HQ)2corrosion film Sodium dodecyl sulphate was found to be an effective Mg corrosion inhibitor by suppressing both the anodic and hydrogen evolution reactions[34,62].
Other long chain organic compounds such as carboxylates and amides have also been found effective in inhibiting aqueous corrosion of Mg alloys[32,33,63]which acted as cathodic[32] and mixed-type corrosion inhibitors [33,63].
Esters and alkanes, present in LPS 2 and LPS 3, provide some corrosion protection. Baker and Zisman [37] found that many esters provided adequate rust inhibition in concentrations above 0.5% in the ASTM D665 rust inhibition tests.Similarly,Tao et al.[64]found that 3,5-dimethylbenzoic acid [1,2,4] triazol-1-ylmethyl ester (DBT) in small concentrations provided good corrosion inhibition to mild steel in 1M HCl. Esters have been effective corrosion inhibitors for aluminium, copper and magnesium alloys [65-70]. Bartley et al. [69] found that a series of alkyl esters inhibited copper corrosion and found that the inhibition efficien y increased with increasing concentration and chain length.
Alkanes have been widely studied as corrosion inhibitors [71-82]. Felh˝osi et al. [71,73,82] found that α, ω diphosphono-alkane acted as an anodic inhibitor on iron spontaneously forming a well-ordered self-assembled layer on the surface. The inhibition strongly depended on concentration and on the molecular structure, with alkyl chains with odd numbers of methylene groups providing better protection. Alkane derivatives may form self-assembled monolayers to inhibit corrosion [72,74,76]. Nozawa et al. [74] found that alkanethiols formed a packed layer on iron with an inhibiting efficien y of 76%. Laibinis and Whitesides [72] reported that monolayers were formed by ω-terminated alkanethiolates on gold, silver and copper. de Souza et al. [76,79] found that alkane diphosphonates reduced the corrosion of Al alloys.
1.2. Research aims
This study aims to evaluate the effectiveness of the four CICs to provide temporary corrosion protection to pure Mg and the Mg alloys EV31A, WE43B and ZE41A in 3.5wt%(0.6M) NaCl solution saturated with Mg(OH)2.
2. Materials and methods
2.1. Specimen preparation
The Mg alloys, EV31A, WE43B, and ZE41A were supplied by Magnesium Elektron, Manchester, UK, in the cast heat-treated condition, as used in military helicopters, as in the prior research [83,84]. EV31A and WE43B had received the T6 heat treatment whilst ZE41A had been subjected to the T5 heat treatment. The T6 heat treatment for WE43B consisted of the solution heat treatment at 525°C for 8 h followed by precipitation hardening at 250°C for 16 h. For EV31A the heat treatment comprised of 8 h at 520°C and 16 h at 200°C. For ZE41A, the T5 heat treatment was 2 h at 330°C and 16 h at 170-180°C. Pure cast Mg was supplied by Achemetal Tungsten and Molybdenum Co, Luoyang,Henan, China.
The specimen designation was AB-CI-XX, where AB indicated EV, WE, ZE and PM (for pure Mg), CI indicated corrosion inhibitor, and XX was the specimen number.Table 1 presents the chemical compositions, analysed using Inductively Coupled Plasma Optical Emission Spectroscopy(ICP-OES) by Spectrometer Services, Coburg, Vic, Australia.The WE43B, ZE41A and pure-Mg specimens were 10mm x 10mm x 5mm in size. EV31A specimens had dimensions of 20mm x 10mm x 5mm. The specimens were progressively ground to fine grit emery paper on each face with 4000 grit being used in ethanol in the fina step, followed by cleaning in ethanol.
Each specimen was coated by dipping the specimen, suspended by nylon fishin line, into the CIC for 120 s and air drying for 48 h. Ardrox 3961 and LPS 2 formed an oily surface coating of low viscosity after drying. LPS 3 created a waxy film AMLGuard resulted in solid surface film
The immersion tests were conducted in triplicates. The specimens were immersed in the solution by nylon fishin line, as in prior research [4,8]. Bare pure Mg was also testedbecause these specimens were from a heat different to those in the prior studies [83,84].

Table 1 Chemical composition (wt%) of the Mg alloys, EV31A, WE43B, ZE41A and pure Mg.
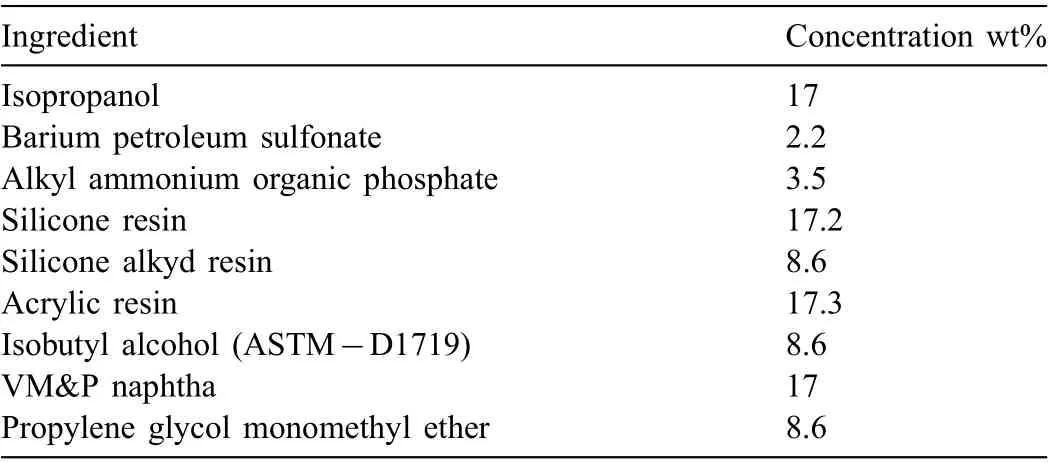
Table 2 Composition of AMLGuard as provided in specificatio MIL-DTL-85054C(AS) 2002.
The four, commercial, petroleum-based CICs were Ardrox 3961 supplied by Chemetall PLC Germany;LPS 2 and LPS 3,supplied by LPS Labs,USA;and AMLGuard supplied by QC Lubricants USA. Ardrox 3961 was a mixture of liquid hydrocarbons, mineral oils, fatty acid esters, organic acids, anionic surfactants, and 1H-benzotriazole (as a corrosion inhibitor).LPS 2 was a lubricant with corrosion inhibiting properties and contained C14-20 aliphatics (as the main ingredient), heavy naphthenic distillate,and white mineral oil.LPS 3 was a mixture of (a) a medium aliphatic naphtha petroleum solvent as the main ingredient, (b) a heavy hydrotreated paraffini distillate, (c) hydrotreated light petroleum distillates, (d) propylene glycol monobutyl ether, and (e) xylene. Table 2 presents the composition of AMLGuard as in the specificatio MIL-DTL-85054C(AS) 2002 [85]
2.2. SEM examination
Scanning electron microscopy (SEM) examination of the corrosion morphology used the 6610 SEM equipped with an Oxford Xmax SDD EDS, after carbon coating using a CTR QT150TES, to a thickness of 25μm. The Hitachi SU3500 SEM was used to examine the CICs. Regions were analysed by energy dispersive X-ray spectroscopy (EDS) to determine the chemical elements present.
2.3. FTIR analysis
Fourier-Transform Infrared Spectroscopy (FTIR) analysed the composition of the CICs. The attenuated total reflectanc(ATR) FTIR spectrum of each CIC was obtained using a Perkin Elmer Spectrum 100. Eight scans were performed on each sample at a scan speed of 0.2. Each CIC was coated onto a glass slide and dried at room temperature for 48 h.Analysis was performed on the residue remaining after drying that was pressed directly onto the diamond zinc selenide crystal, the internal reflectio element of the ATR.
2.4. XPS analysis
X-ray photoelectron spectra (XPS) were obtained for representative specimens coated with each CIC.These specimens were (i) the Mg alloys and pure Mg coated with Ardrox 3961 and LPS 2 immersed for 7 days,and(ii)the Mg alloys coated with LPS 3 and AMLGuard with minor corrosion after 21 days immersion.
XPS used a Kratos Axis ULTRA X-ray photoelectron spectrometer incorporating a 165mm hemispherical electron energy analyser. The incident radiation was monochromatic Al Kα X-rays(1486.6eV)at 225W(15kV,15mA).Survey scans were taken at an analyser pass energy of 160eV and highresolution scans at 20eV. Survey scans were carried out over the 1200-0eV binding energy range with 1.0eV steps and a dwell time of 100ms. High-resolution scans used 0.05eV steps and a 250ms dwell time.After the initial general survey,ion milling for 60 s was performed after which the specimens were re-examined. The analysis chamber had a base pressure of 1.0×10⁻⁹torr and a pressure during sample analysis of 1.0×10⁻⁸torr. Atomic concentrations were calculated using the CasaXPS version 2.3.14 software and a Shirley baseline,using the Kratos library of relative sensitivity factors (RSFs).Peak fittin of the high-resolution data was also carried out using the CasaXPS software.
2.5. Immersion tests
The immersion tests were conducted in 3.5wt% (0.6M)NaCl solution saturated with Mg(OH)2at 24±1°C. The pH was 10.3. The solution was saturated with Mg(OH)2because corrosion of Mg rapidly increases in pH to 10.3 because of the low solubility of Mg(OH)2. Prior solution saturation with Mg(OH)2avoided solution changes during the immersion tests. The effect of the immersion period was studied using three immersion periods, namely 7, 14 and 21 days.
The volume of the evolved hydrogen provided an instantaneous measurement of the corrosion rate, because corrosion of each Mg atom evolves one molecule of H2gas by theoverall Mg corrosion reaction [3,8];
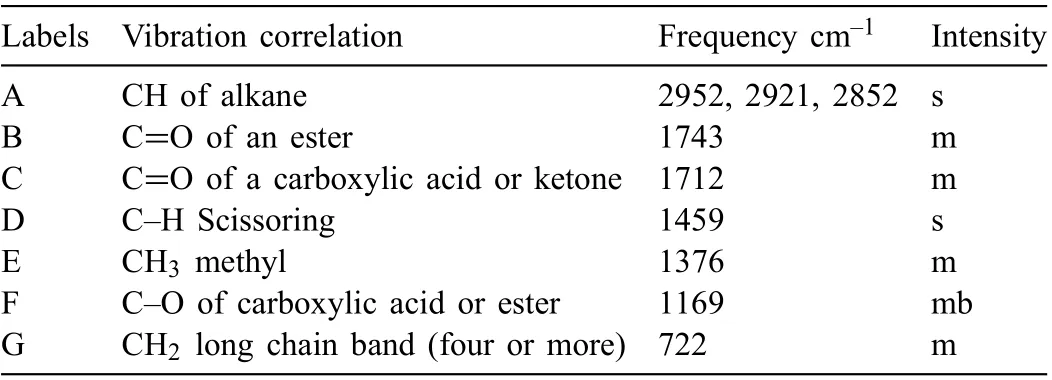
Table 3 Summary of Ardrox 3961 FTIR analysis where intensity descriptions are m- medium, b - broad, s - strong.

The instantaneous corrosion rate PH(mm y-1) was evaluated from [3,6,7,9,83]:

where VH(mL cm-2d-1) is the hydrogen evolution rate. The specifi hydrogen evolution volumes v1, v2… vn(volume of hydrogen divided by specimen surface area) were measured at corresponding times t1, t2, … tn. The instantaneous corrosion rate was evaluated by rearranging Eq. (3) to (as in prior research [83,84]):

and PH=PHnfor n=1 and 2. Because corrosion rates cannot have negative values, all negative values of VHwere assigned the value of 0.01mL cm-2d-1.
After the immersion test, the specimens were washed with distilled water, cleaned in solvents in steps to remove the remaining CICs,cleaned in a chromic acid solution with a composition of 200g L-1CrO3+2g L-1AgNO3at 24°C±1°C to remove all the corrosion products without removing any Mg metal [7,86,87], washed with distilled water, dried with an air jet air and in a desiccator for at least one day to completely remove all adsorbed surface water, weighed and the corrosion rate evaluated using [3,6,7,9,83,87,88]:

3. Results
3.1. FTIR examination
Tables 3-6 provide a summary of the FTIR analysis of the CICs. Fig. 1 presents a typical FTIR spectra, that for Ardrox 3961. Ardrox 3961 is formulated from liquid hydrocarbons,mineral oil, a fatty acid ester, organic acids, anionic surfactants and 1-H-benzotriazole, which consists of a benzene (an aromatic), and a triazole which is a heterocyclic compound composed of two carbons and three nitrogens. Table 3 indicates that the FTIR spectrum displayed a predominance of an alkane with ester and carboxylic acid or ketone groups. Corrosion inhibitors are typically added in low concentrations and the 1-H benzotriazole was not at sufficien concentration for detection. SEM/EDS analysis was not performed to determine the presence of nitrogen on the dried material as an oily fil resulted, which would become volatile when analysed by SEM.
LPS 2 contained C14-20 aliphatic as the major component and minor amounts of heavy hydrotreated naphthenic distillate (severe) and white mineral oil (petroleum). The inhibiting compound (and active ingredient) was identifie as the heavy naphthenic distillate. Table 4, a summary of the FTIR spectrum of LPS 2, indicated a predominance of an alkane, a methyl aliphatic with aromatic ester and aromatic alkene groups. The spectrum had three peaks labelled as I, N and O, accurate verificatio of which were difficult The peak labelled as F may also contain a sulfonate which was also difficul to accurately verify. Hydrotreated heavy naphthenic distillates are a complex mixture of hydrocarbons containing carbons in the range of C20 to C50 with few normal paraffin(CnH2n+2). The hydrocarbons include, saturated, aromatic and polar hydrocarbons, asphaltenes and dimethyl sulfoxide,a polar aprotic solvent.White mineral oil consists of saturated hydrocarbons,with carbons in the range of C15 to C50.White mineral oil has the IUPAC name of disodium;(8Z)-7-oxo-8 (phenylhdrazinylidene) naphthalene-1,3-disulfonate. Naphthenes are cycloalkanes containing a high proportion of closed ring methylene groups and a component of the inhibitor. A weak band at 1569 cm-1is suggestive of the presence of the naphthene group.

Table 4 Summary of LPS 2 FTIR analysis. Intensity descriptions are w - weak, m - medium, b - broad, s - strong. Peaks I, N and O could not be identifie and therefore are not included in the table.
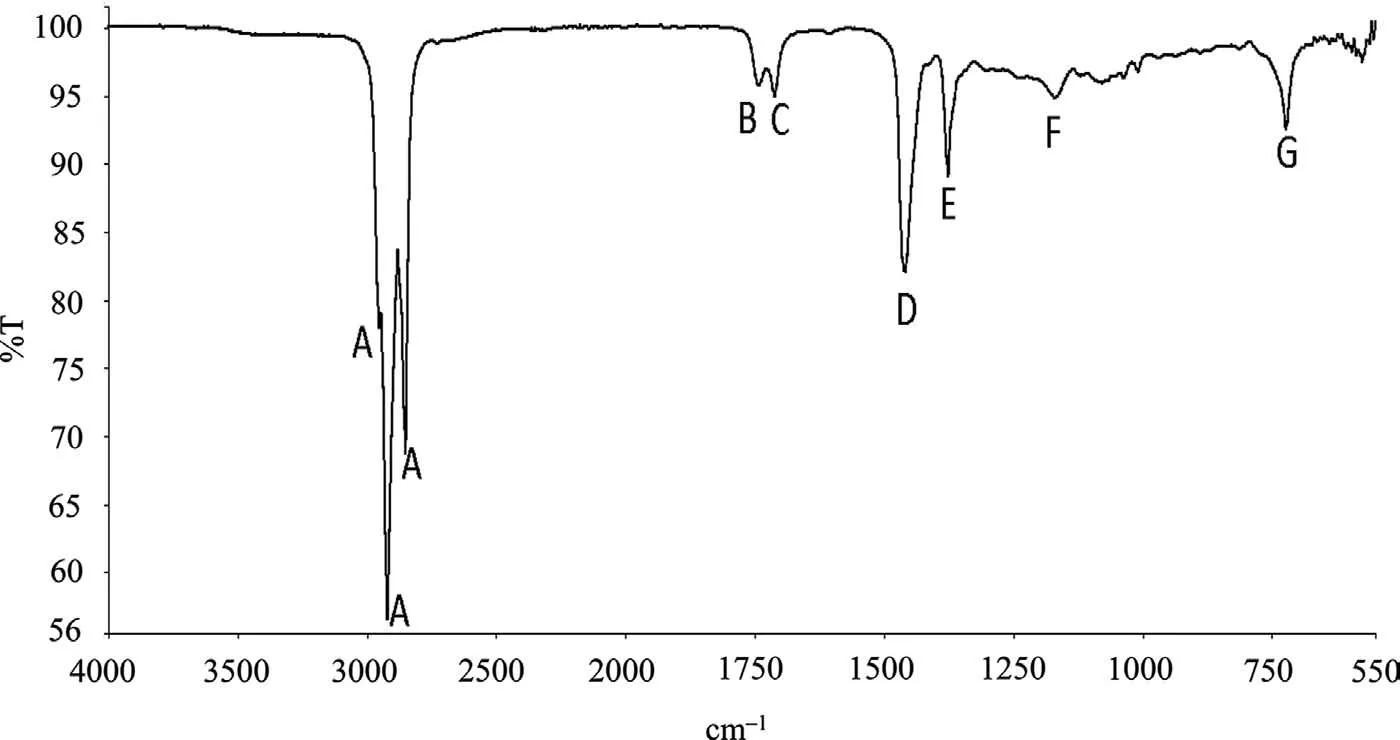
Fig. 1. An annotated FTIR spectrum of Ardrox 3961. Each peak is described in Table 3.

Table 5 Summary of LPS 3 FTIR analysis. Intensity descriptions are w - weak, m - medium, b - broad, s - strong. Peak G could not identifie and consequently is not included in the table.

Table 6 Summary of AMLGuard FTIR analysis. Intensity descriptions are w - weak, m - medium, b - broad, s - strong. Peak N could not identifie and is not included in the table.
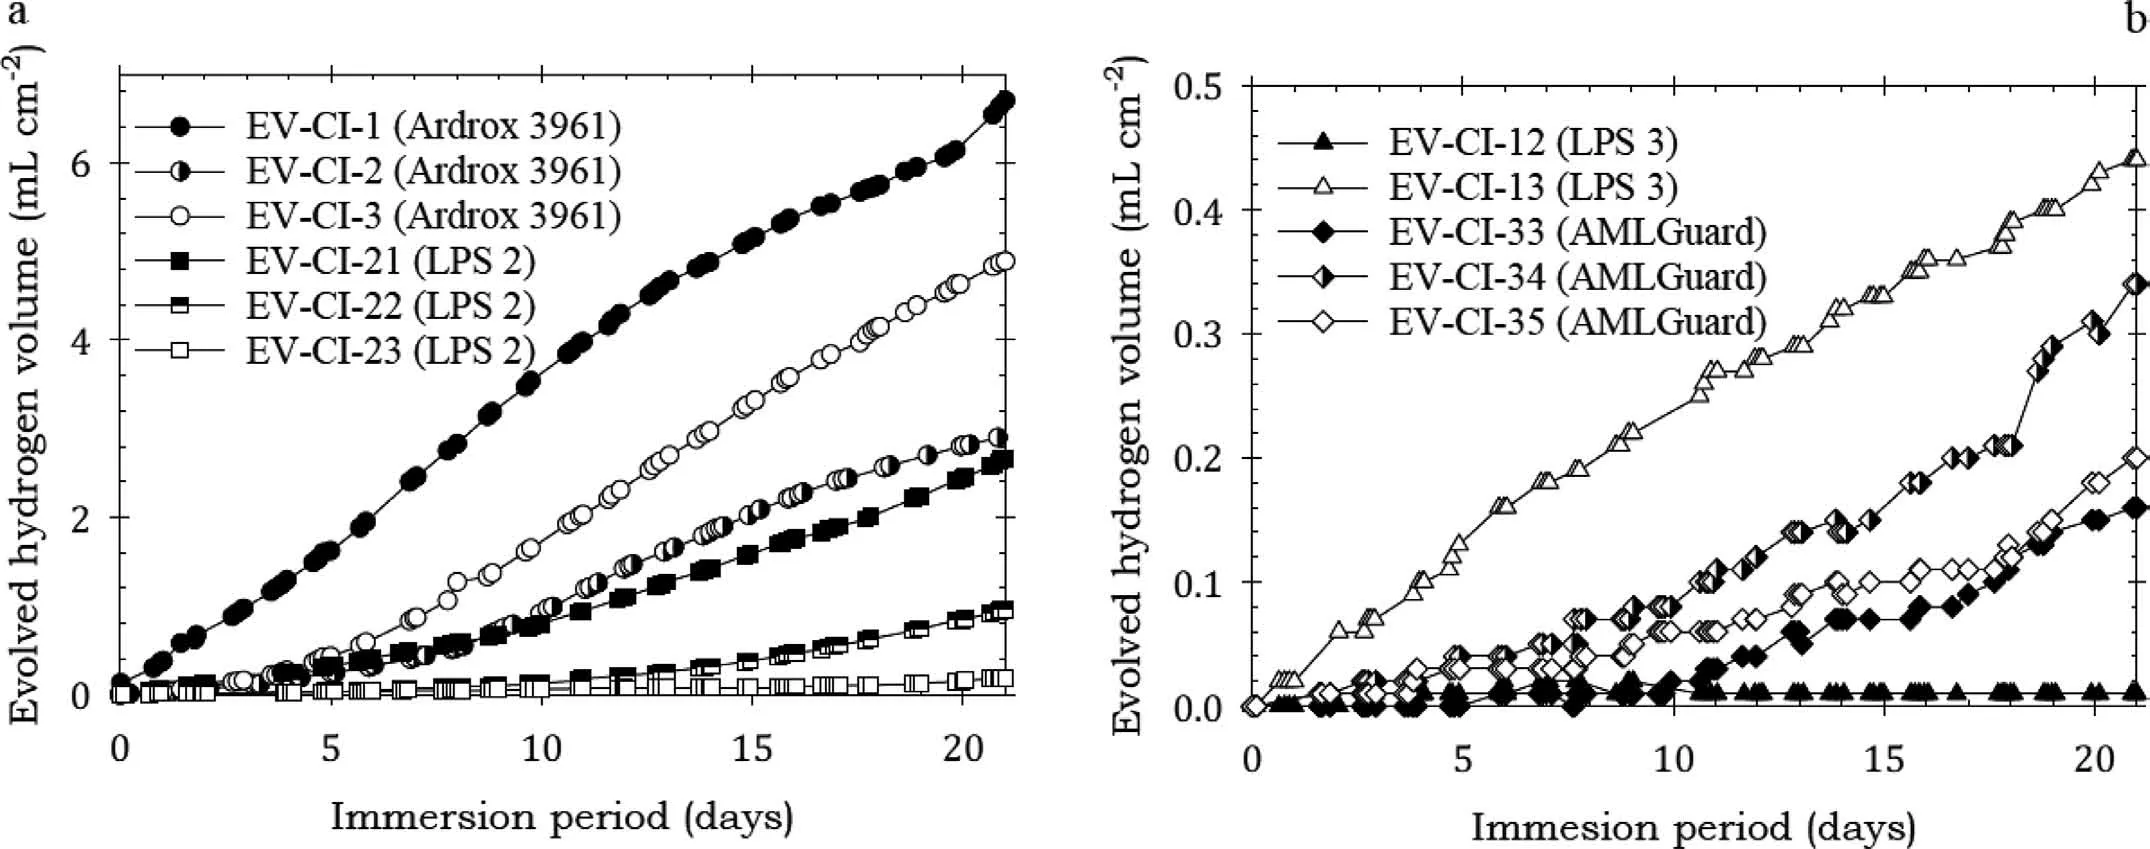
Fig. 2. Normalised hydrogen evolution volume for the Mg alloy EV31A specimens coated with Ardrox 3961, LPS 2, LPS 3 and AMLGuard and immersed for twenty one days in 3.5wt% NaCl solution saturated with Mg(OH)2 at room temperature.
LPS 3 was formulated mostly with solvent naphtha petroleum, a medium aliphatic, a heavy hydrotreated paraffini distillate,a light hydrotreated petroleum distillate,propylene glycol monobutyl ether (alpha isomer), and xylene. The FTIR spectrum for LPS 3 exhibited a predominance of an alkane, heterocyclic ring compounds with ester, methylene and methyl groups, Table 5. The inhibiting compound and active ingredient was the heavy naphthenic distillate. The heterocyclic bands were suggestive of the inhibitor. The SEM/EDS analysis of the fil displayed elements consistent with a hydrocarbon material, with calcium of calcium carbonate.
AMLGuard consisted of isopropanol, isobutanol,petroleum ether,solvent naptha,propylene glycol monomethyl ether, toluene, napthenic distillate light solvent refined isobutyl isobutyrate, proprietary ingredients and barium dionyl napthalensulfonate and ammonium organic phosphate.The FTIR spectrum of AMLGuard displayed a predominance of an aromatic carboxyl group, ester and alkane groups,Table 6. The inhibitors were barium sulfonate and alkyl ammonium phosphate. The SEM/EDS analysis of the fil indicated the presence of barium, sulfur and phosphate,confirmin the presence of the inhibitors.
3.2. Immersion tests
3.2.1. Weight loss and hydrogen evolution
Table A1 in the Appendix presents the corrosion data from the immersion tests in the 0.6M NaCl solution saturated with Mg(OH)2at ambient temperature for the three alloys and pure Mg, all the coatings and the three test periods (7, 14 and 21 days). Average corrosion rates PAHtypically correlated well with PWfor Mg alloys with substantial corrosion rates [3,89].
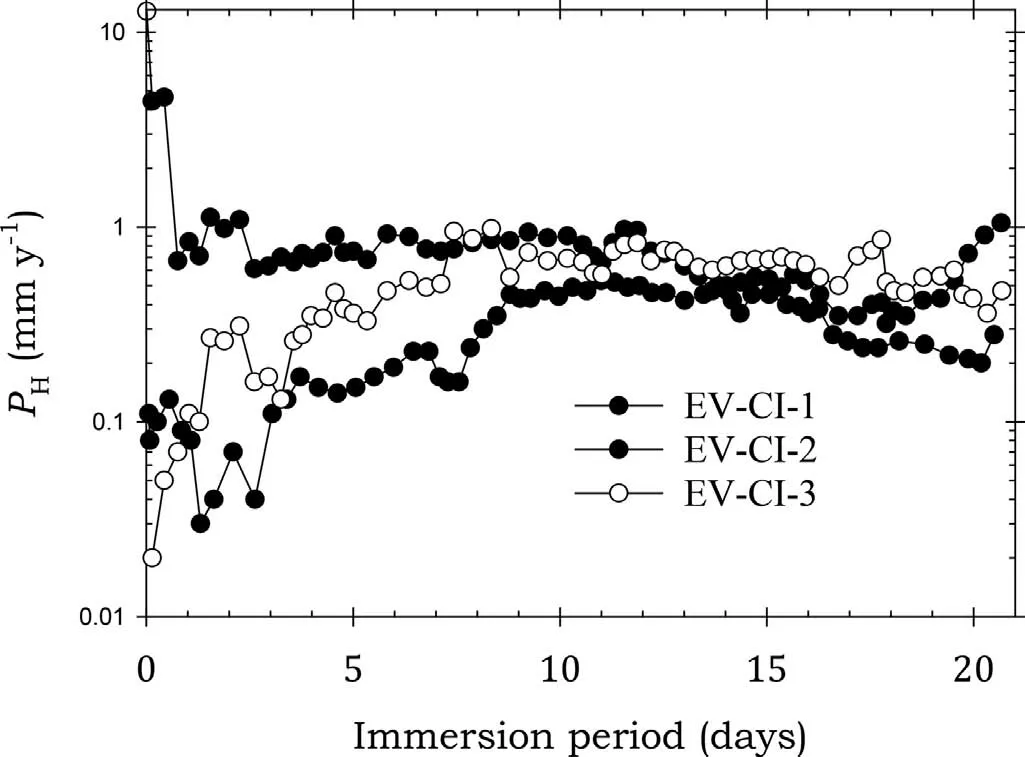
Fig. 3. Instantaneous corrosion rates calculated from hydrogen evolution for the EV31A alloy specimens EV-CI-1, EV-CI-2 and EV-CI-3 coated with Ardrox 3961 and immersed for twenty one days in 3.5wt% NaCl saturated with Mg(OH)2.
Fig. 2 present the normalised hydrogen evolution volume data for EV31A coated with Ardrox 3961, LPS 2, LPS 3 and AMLGuard immersed for 21 days, typical of the hydrogen evolution data for pure Mg and the Mg alloys. The volume of evolved hydrogen increased steadily for most specimens over the test period. In most instances the specimens coated with Ardrox 3961 evolved volumes of hydrogen larger than those coated with other CICs, with a considerable difference in the hydrogen volumes between the alloys.
3.2.2. EV31A
Figs. 3-6 show the instantaneous corrosion rates for EV31A specimens coated with all four CICs and immersed for 21 days. The specimens with Ardrox 3961 had corrosion rates higher than the other specimens. Table 7 documents the average corrosion rates.
Fig. 3 shows that EV31A specimens EV-CI-2 and EV-CI-3 coated with Ardrox 3961 had corrosion rates lower than thatof bare EV31A for the firs 7 days after which the corrosion rates of all three specimens were comparable to that of bare EV31A. This indicated that Ardrox 3961 initially provided protection for the two specimens,but the protection was short lived. This is in agreement with the weight loss data in Table 7 which indicates Ardrox 3961 provided lower average corrosion rates for the specimens exposed for 7 days, indicating corrosion protection on average. However, it is important to note that the corrosion rate of EV-CI-1 was essentially the same as that of bare EV31A for the whole immersion period indicating little corrosion protection in this case. Thus,while Ardrox 3961 provided an average corrosion protection for about 7 days, there was at least one specimen which received no protection.

Table 7 Average corrosion rates calculated from mass loss, PAW including standard deviation (SD) for all alloys tested in 3.5wt% (0.6M) NaCl solution saturated with Mg(OH)2 with and without coating for periods of 7, 14 and 21 days.
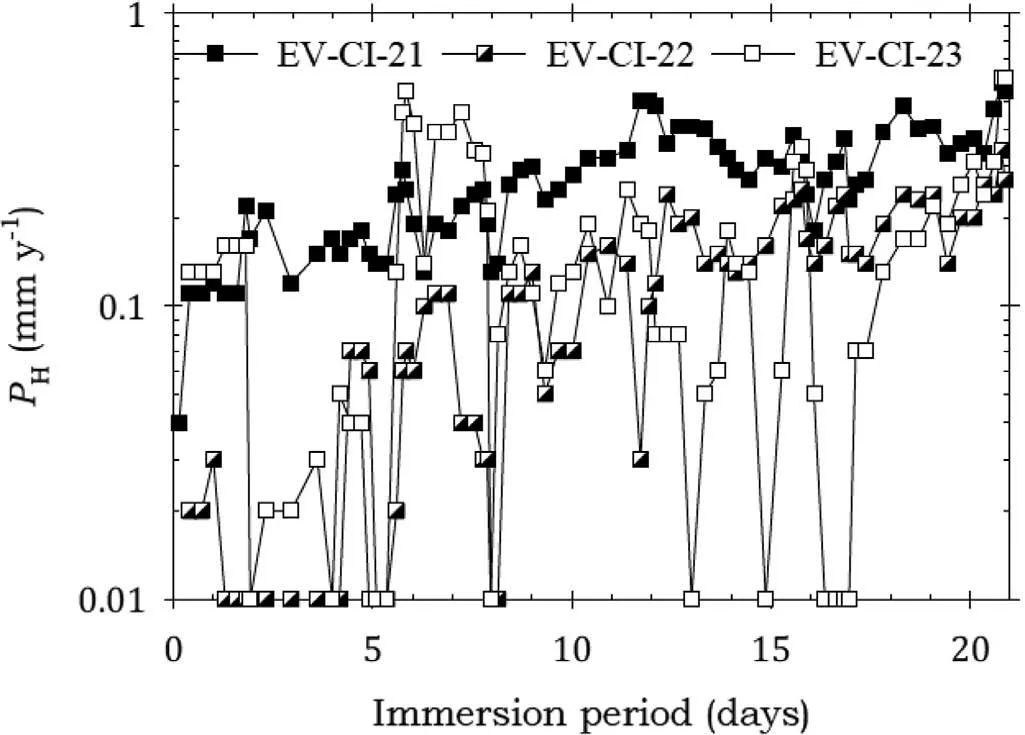
Fig. 4. Instantaneous corrosion rates calculated from hydrogen evolution for the EV31A alloy specimens EV-CI-21, EV-CI-22 and EV-CI-23 coated with LPS 2 and immersed for twenty one days in 3.5wt% NaCl saturated with Mg(OH)2.
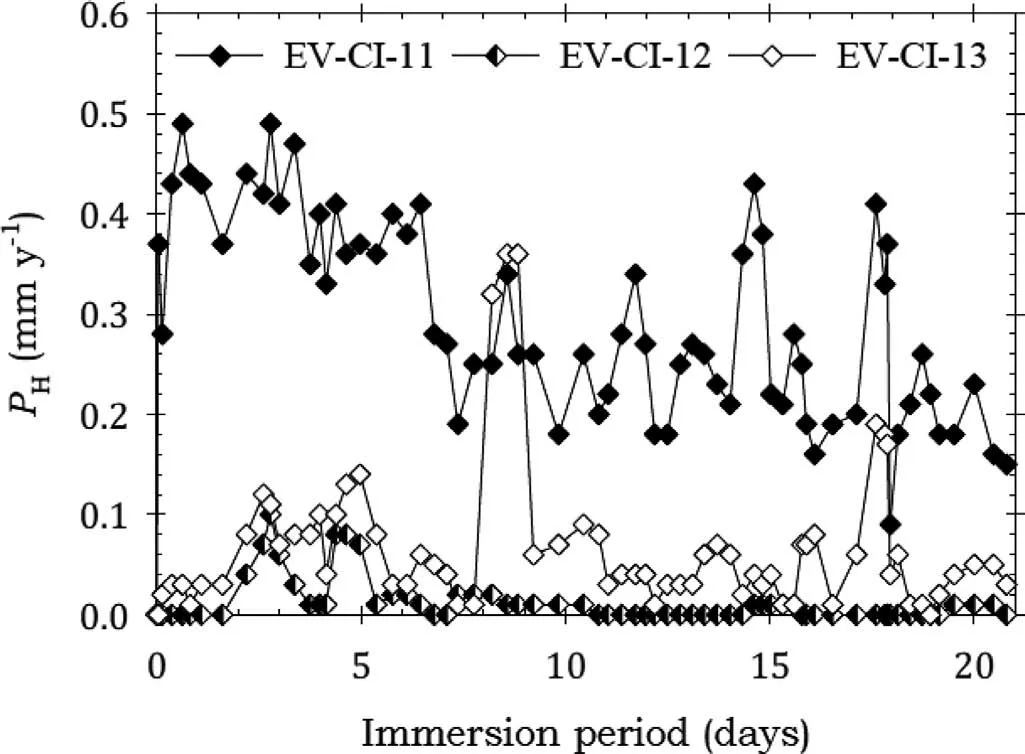
Fig. 5. Instantaneous corrosion rates calculated from hydrogen evolution for the EV31A alloy specimens EV-CI-11, EV-CI-12 and EV-CI-13 coated with LPS 3 and immersed for twenty one days in 3.5wt% NaCl saturated with Mg(OH)2.
Fig. 4 shows that the EV31A specimens coated with LPS 2 had corrosion rates lower than for bare EV31A for most of the immersion test, indicating significan corrosion protection. Furthermore, specimens EV-CI-22 and EV-CI-23 had significantl lower corrosion rates indicating better corrosion protection. The corrosion rate for specimens EV-CI-22 and EV-CI-23 increased steadily with immersion time indicating the slow breakdown of the protection provided by LPS 2.Table 7 indicates that the average weight loss data provided confirmatio that LPS 2 provided corrosion protection for EV31A for 21 days.
Fig. 5 shows that specimens EV-CI-12 and EV-CI-13 coated with LPS 3 had low corrosion rates indicating effective corrosion protection. Specimen EV-CI-11 also exhibited some corrosion protection because the corrosion rate was lower than the bare corrosion rate. The decreasing corrosion rate indicated increasing corrosion protection, which was attributed to corrosion products blocking holidays in the LPS 3 film The weight loss data of Fig. 7 provided confirmatio that LPs 3 provided effective corrosion protection.
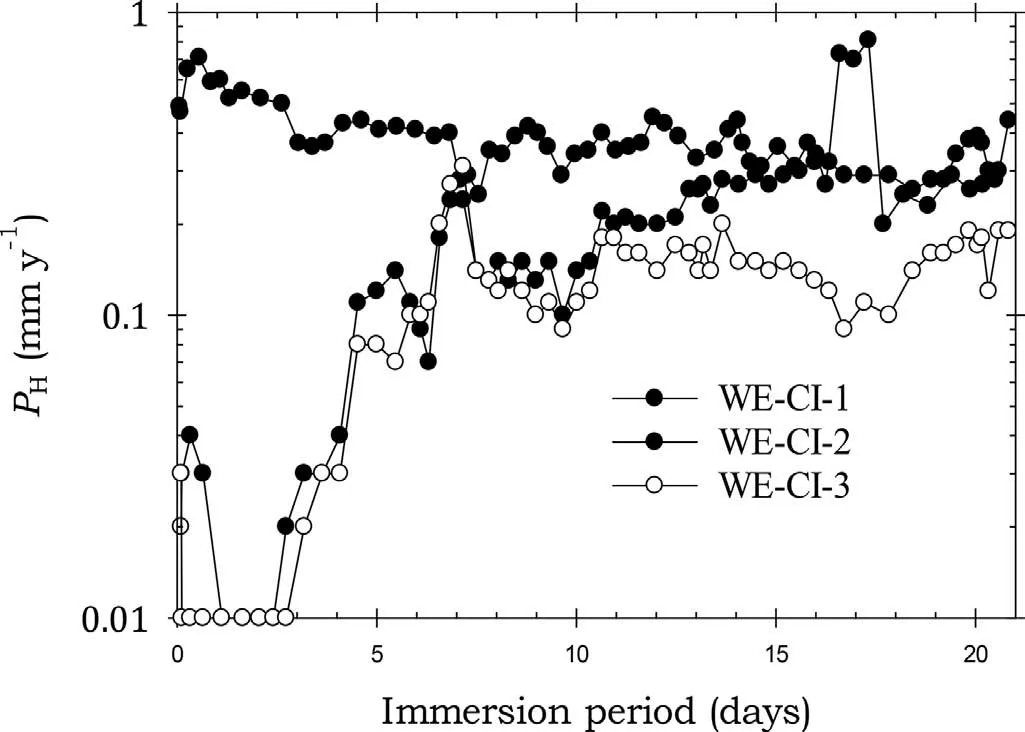
Fig. 7. Instantaneous corrosion rates calculated from hydrogen evolution for the WE43B alloy specimens WE-CI-1, WE-CI-2 and WE-CI-3 coated with Ardrox 3961 and immersed for twenty one days in 3.5wt% NaCl saturated with Mg(OH)2.
Fig. 6 shows that all three specimens coated with AMLGuard displayed low corrosion rates indicative of effective corrosion protection. Again, the effective corrosion protection was confirme by the weight loss data in Table 7.
3.2.3. WE43B
Figs. 7-10 present the instantaneous corrosion rates for WE43B coated with all four CICs and immersed for 21 days.The specimens coated with Ardrox 3961 had corrosion rates higher than the other specimens.
Fig. 7 shows that the Ardrox 3961coated specimens WECI-1 and WE-CI-3 had corrosion rates lower than that of the bare WE43B for about 7 days indicative of effective corrosion protection. The weight loss data also indicated that the average corrosion rate was lower than the bare corrosion rate for the specimens exposed for 7 days. However, the corrosion rate of specimen WE-CI-2 was comparable to that of bare WE43B indicating little corrosion protection.
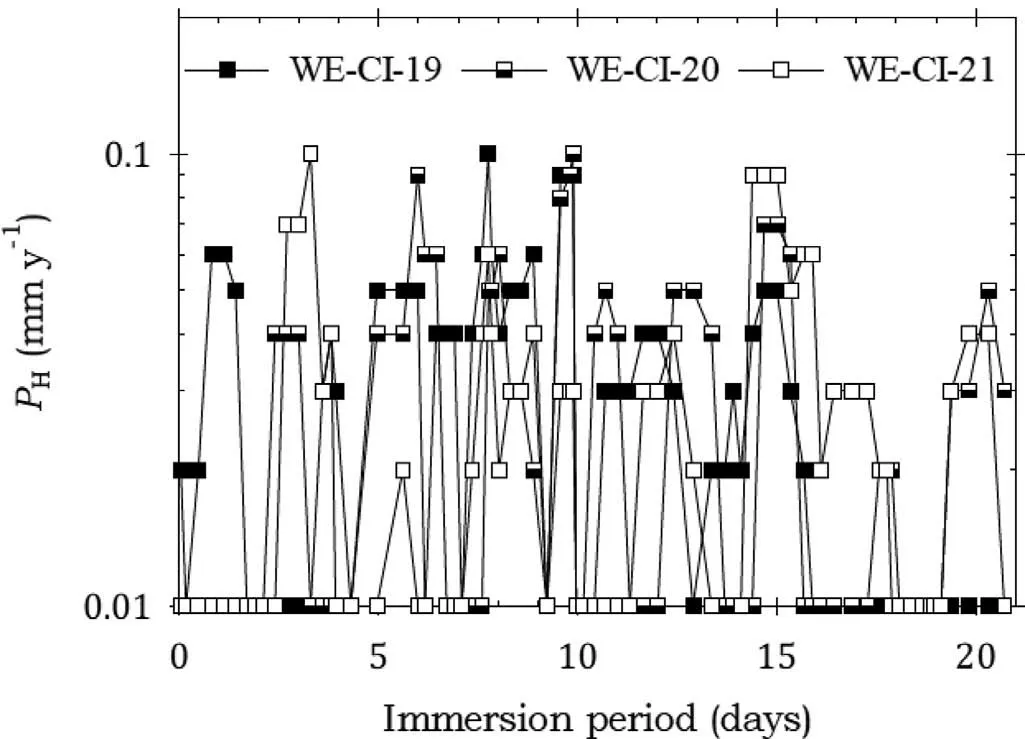
Fig. 8. Instantaneous corrosion rates calculated from hydrogen evolution for the WE43B alloy specimens WE-CI-19,WECI-20 and WE-CI-21 coated with LPS 2 and immersed for twenty one days in 3.5wt% NaCl saturated with Mg(OH)2.
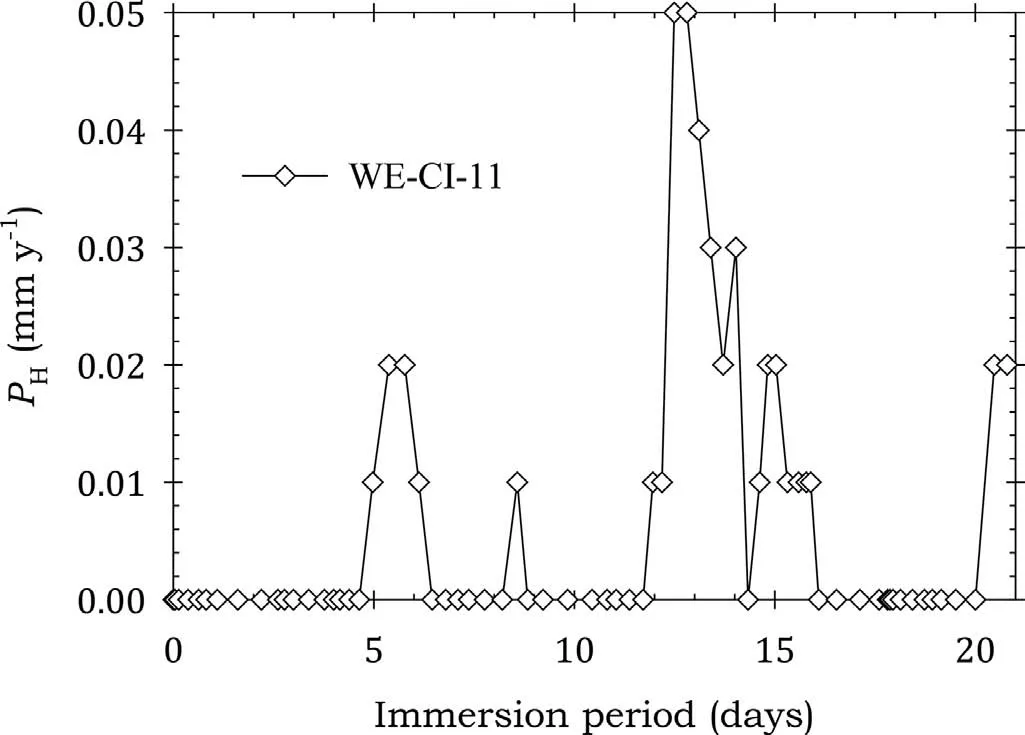
Fig. 9. Instantaneous corrosion rates calculated from hydrogen evolution for the WE43B alloy specimen WE-CI-11 coated with LPS 3 and immersed for twenty one days in 3.5wt% NaCl saturated with Mg(OH)2.
Fig. 8 shows that the corrosion rates for the specimens coated with LPS 2 exhibited low corrosion rates which remained broadly unchanged over the entire test period, indicating effective corrosion protection throughout the immersion test. This was confirme by the data in Table 7.
Fig. 9 Shows that the corrosion rate of specimen WE-CI-11 coated with LPS 3 had low corrosion rates and effective corrosion protection. This was confirme by the data of Table 7.
Fig. 10 shows that the specimens coated with AMLGuard had low corrosion rates in the firs seven days of immersion,after which the corrosion rates began to rise reaching a peak towards the end of the test. This indicated effective corrosion protection for the firs 7 days of the test, and some protection thereafter. Again, there was confirmatio from the low corrosion rates in Table 7.
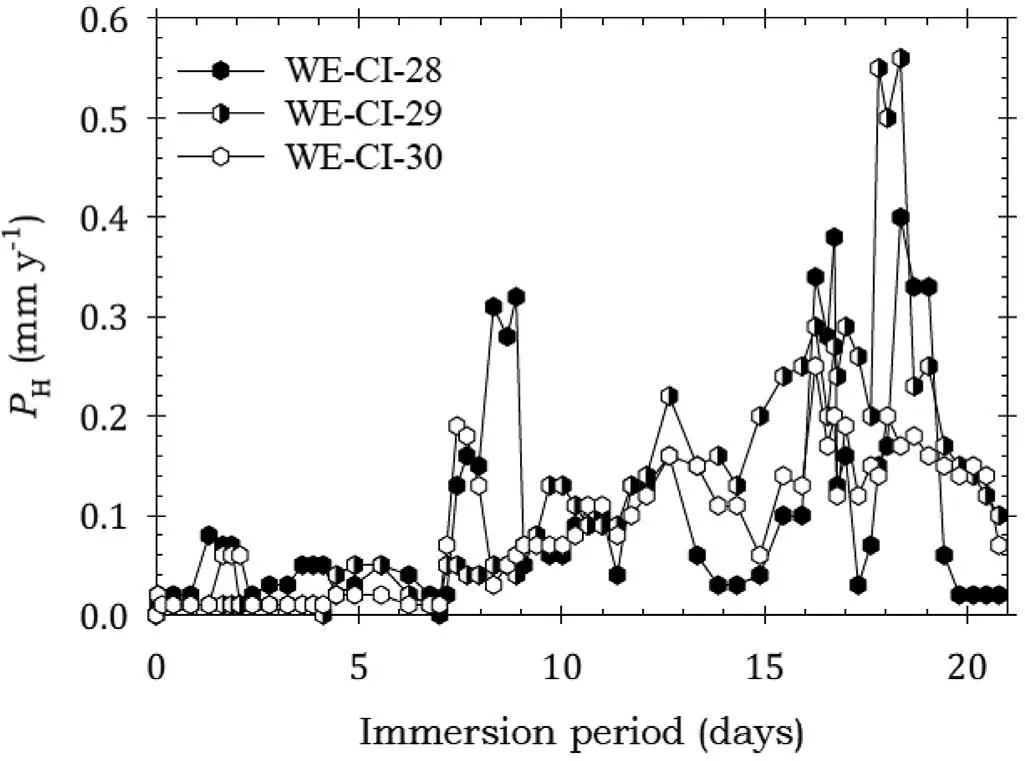
Fig. 10. Instantaneous corrosion rates calculated from hydrogen evolution for the WE43B alloy specimens WE-CI-28, WE-CI-29 and WE-CI-30 coated with AMLGuard and immersed for twenty one days in 3.5wt% NaCl saturated with Mg(OH)2.
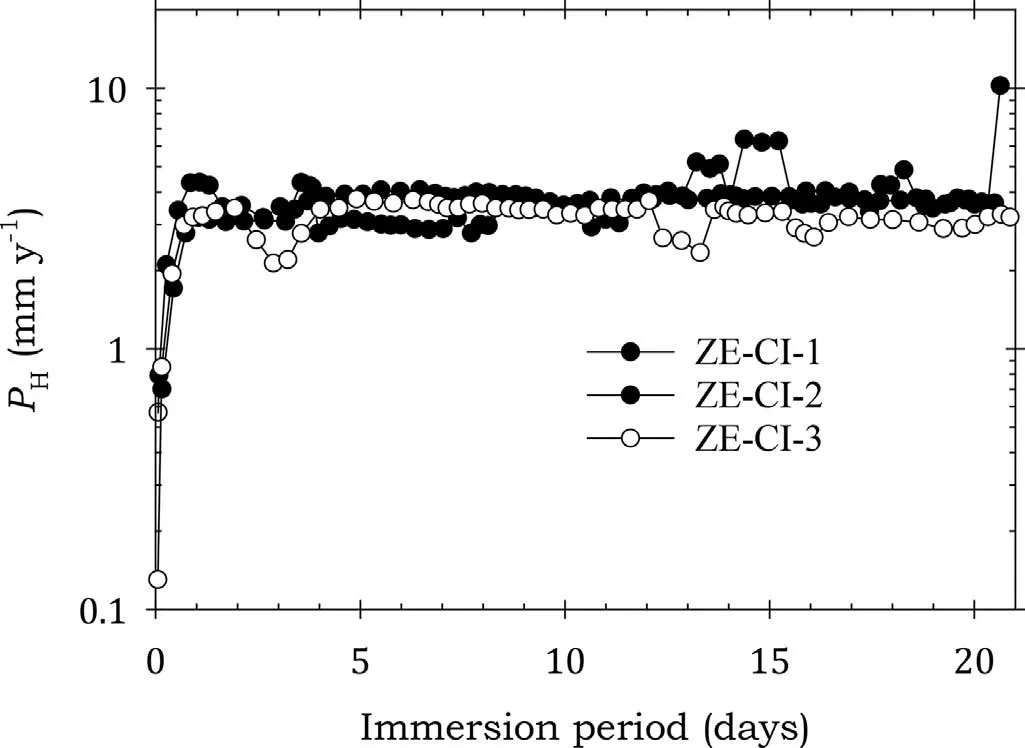
Fig. 11. Instantaneous corrosion rates calculated from hydrogen evolution for the ZE41A alloy specimens ZE-CI-1, ZE-CI-2 and ZE-CI-3 coated with Ardrox 3961 and immersed for twenty one days in 3.5wt% NaCl saturated with Mg(OH)2.
3.2.4. ZE41A
Figs. 11-14 present the instantaneous corrosion rates for the ZE41A alloy specimens coated with the four CICs. There was little difference in corrosion rates between the specimens in each group.
Fig. 11 shows that all the specimens coated with Ardrox 3961 experienced an initial sharp rise in corrosion rates in the firs day of immersion after which the rates stabilised despite some minor scatter and remained essentially unchanged for the remaining test period. This indicated little corrosion protection throughout the corrosion tests. This is consistent with the substantial corrosion rates in Table 7.
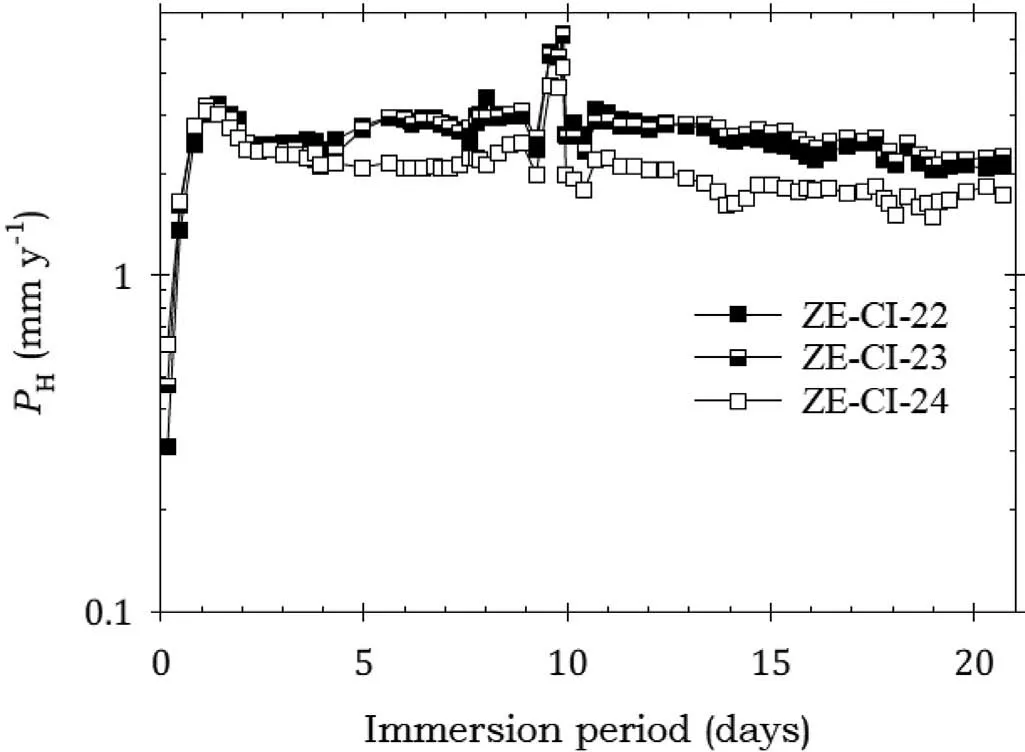
Fig.12. Instantaneous corrosion rates calculated from hydrogen evolution for the ZE41A alloy specimens ZE-CI-22, ZE-CI-23 and ZE-CI-24 coated with LPS 2 and immersed for twenty one days in 3.5wt% NaCl saturated with Mg(OH)2.
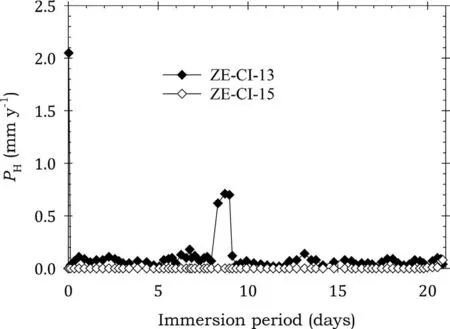
Fig.13. Instantaneous corrosion rates calculated from hydrogen evolution for the ZE41A alloy specimens ZE-CI-13 and ZE-CI-15 coated with LPS 3 and immersed for twenty one days in 3.5wt% NaCl saturated with Mg(OH)2.
Fig.12 indicates that the specimens coated with LPS 2 also exhibited an initial sharp rise in corrosion rates lasting up to two days and followed by their stabilisation, after which the corrosion rates remained essentially unchanged till the end of the test despite a spike which occurred roughly after 9 days. This again indicated little corrosion protection. Again,this was substantiated by the substantial corrosion rates in Table 7.
Fig. 13 shows that the specimens coated with LPS 3 had near zero corrosion rates which remained essentially unchanged over the entire test period except for two substantial spikes experienced by ZE-CI-13. The overall behaviour indicated effective corrosion protection. Table 7 again provide confirmation
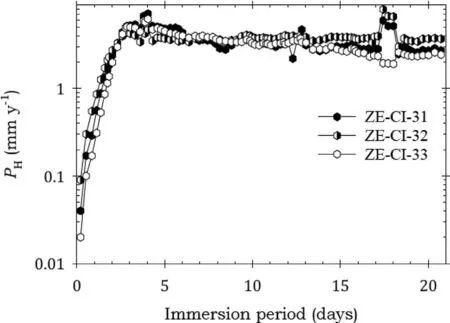
Fig.14. Instantaneous corrosion rates calculated from hydrogen evolution for the ZE41A alloy specimens ZE-CI-31, ZE-CI-32 and ZE-CI-33 coated with AMLGuard and immersed for twenty one days in 3.5wt% NaCl saturated with Mg(OH)2.
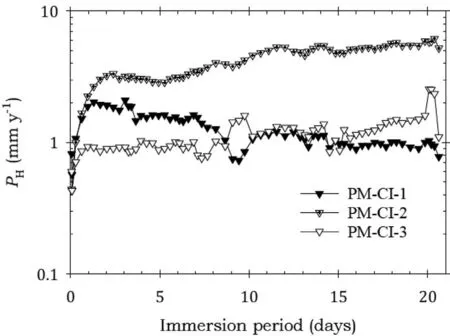
Fig. 15. Instantaneous corrosion rates calculated from hydrogen evolution for the pure Mg specimens PM-CI-1, PM-CI-2 and PM-CI-3 immersed for twenty one days in 3.5wt% NaCl saturated with Mg(OH)2.
Fig. 14 shows that the specimens coated with AMLGuard also had an initial sharp rise in corrosion rates in the firs 3 days of immersion. The corrosion rates later stabilised and remained unchanged for the remaining test period despite some minor scatter. This behaviour indicated little corrosion protection. Again, there was substantiation by the data in Table 7.
3.2.5. Pure Mg
Figs.15-19 show the instantaneous corrosion rates for pure Mg specimens. The bare specimens and those coated with Ardrox 3961 had comparable corrosion rates, Figs 15 and 16, which were considerably higher than those coated with the other CICs.This indicates that Ardrox 3961 provided little corrosion protection.This conclusion was substantiated by the data in Table 7.
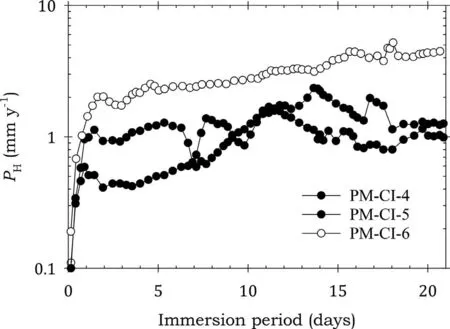
Fig. 16. Instantaneous corrosion rates calculated from hydrogen evolution for the pure Mg specimens PM-CI-4, PM-CI-5 and PM-CI-6 coated with Ardrox 3961 and immersed for twenty one days in 3.5wt% NaCl saturated with Mg(OH)2.
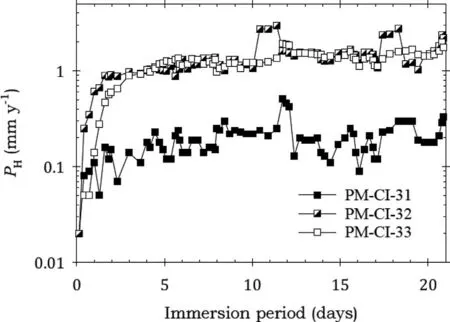
Fig. 17. Instantaneous corrosion rates calculated from hydrogen evolution for the pure Mg specimens PM-CI-31, PM-CI-32 and PM-CI-33 coated with LPS 2 and immersed for twenty one days in 3.5wt% NaCl saturated with Mg(OH)2.
Fig. 17 shows that the specimens coated with LPS 2 also experienced a sharp rise in corrosion rates at the beginning of the immersion lasting up to 2 days after which the corrosion rates broadly stabilised. Specimens PM-CI-32 and PM-CI-33 had similar corrosion rates and considerably higher than for PM-CI-31. Fig. 17 indicates that LPS 2 provided little corrosion protection. Table 7 provided confirmation
Fig. 18 shows that the specimens coated with LPS 3 had small corrosion rates for most of the immersion period, indicating effective corrosion protection. Table 7 provided confimation.
Fig. 19 shows that specimens PM-CI-40 and PM-CI-41 coated with AMLGuard had essentially no corrosion in the firs two days of immersion indicating a delay in the onset of corrosion. Subsequently, the corrosion rates rose sharply and this trend continued for PM-CI-40 for the remaining period. However, the other specimens experienced broad stabilisation of the rates in the latter half of the test, at different times, and the rates remained essentially unchanged till the end of the test. Fig. 19 thus shows that there was effective corrosion protection for only about three days. The data of Table 7 provide confirmation
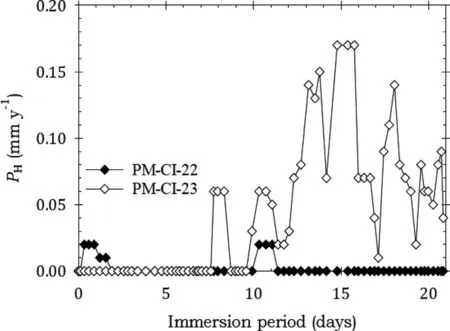
Fig. 18. Instantaneous corrosion rates calculated from hydrogen evolution for the pure Mg specimens PM-CI-22 and PM-CI-23 coated with LPS 3 and immersed for twenty one days in 3.5wt% NaCl saturated with Mg(OH)2.
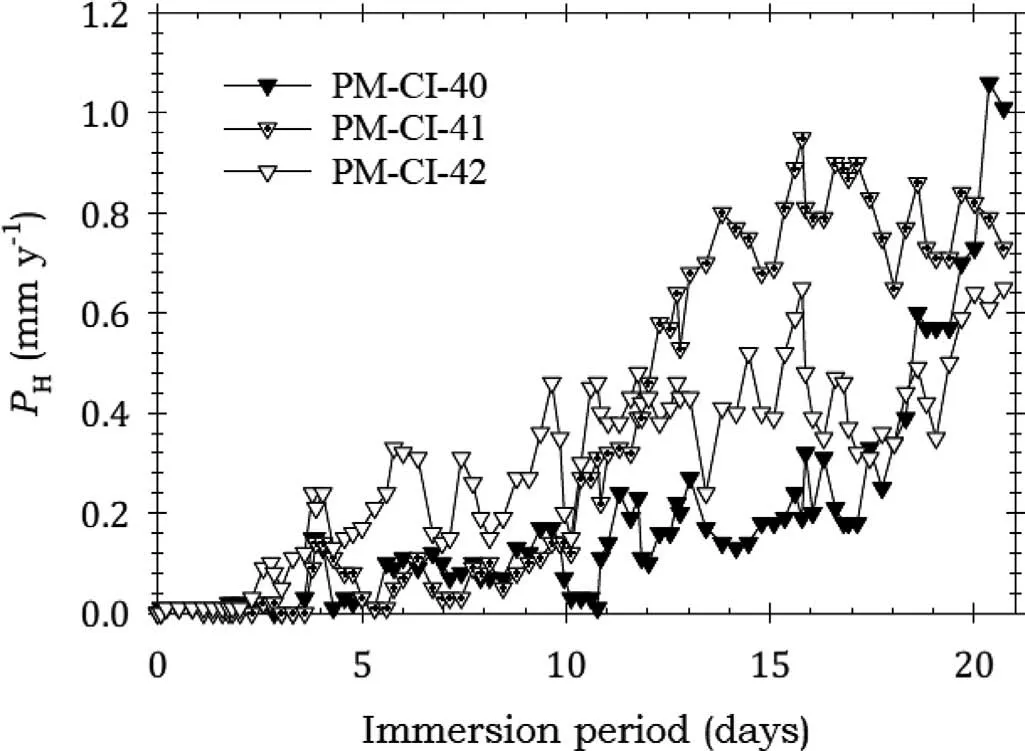
Fig. 19. Instantaneous corrosion rates calculated from hydrogen evolution for the pure Mg specimens PM-CI-40, PM-CI-41 and PM-CI-42 coated with AMLGuard and immersed for twenty one days in 3.5wt% NaCl saturated with Mg(OH)2.
3.3. Average corrosion rates PAW and PAH
Tables 7 and 8 show the average corrosion rates calculated from weight loss PAWand the evolved hydrogen volume PAHfor the three Mg alloys and pure Mg, coated with the four CICs and immersed for 7, 14 and 21 days, including the data on the uncoated alloys EV31A, WE43B and ZE41A extracted from the previous study[83].The same trends were shown by both measurements of corrosion rate, although the corrosion rates PAWtypically gave values that were somewhat higher than PAH.
3.4. Inhibition efficiency of CICs
Table 9 provides inhibition efficien y data for the four CICs applied to the three Mg alloys and pure Mg and immersed for 7, 14 and 21 days, according to Eq. (1). The results show that LPS 3 was effective in providing corrosion protection for all the alloys and pure Mg, whilst the other CICs were less effective.
3.4.1. Alloy EV31A
Table 9 shows that coating with LPS 2, LPS 3 and AMLGuard resulted in (a) inhibition efficiencie above 90% in all cases except for LPS 2 tested for 21 days, (b) the efficien y remained essentially unchanged for LPS 3 and AMLGuard for all three immersion periods, and (c) LPS 3 exhibited the highest efficien y. In the case of LPS 2, the inhibition effi ciency decreased to 88% when tested for 21 days indicating a small reduction in the protectiveness provided by the CIC.Ardrox 3961, however, exhibited inhibition efficien y considerably lower than the other CICs.The inhibition efficiencie for the coatings were in the following decreasing order LPS 3 >AMLGuard >LPS 2 >Ardrox 3961.
3.4.2. Alloy WE43B
Table 9 shows that coating with LPS 3 resulted in inhibition efficiencie above 86% indicating that LPS 3 provided good corrosion protection for WE43B. The inhibition effi ciency of the other coatings decreased in the following order LPS 3 >LPS 2 >AMLGuard >Ardrox 3961.
3.4.3. Alloy ZE41A
Table 9 shows that coating with LPS 3 resulted in inhibiting efficiencie of 100% for all test periods with lower efficiencie for the other coatings. The results show that (a)coating with AMLGuard displayed a considerably lower effi ciency when immersed for periods of 14 and 21 days (b) LPS 2 exhibited more consistency in the efficiencie with some reduction for 21 days, (c) coating with Ardrox 3961 displayed the lowest efficien y values. The efficiencie were in the following decreasing order LPS 3 (100%) >LPS 2 (47%) >AMLGuard (34%) >Ardrox 3961 (29%).
3.4.4. Pure Mg
Table 9 shows that coating with LPS 3 resulted in inhibition efficiencie of 100% for all test periods. For the other coatings they were substantially lower than that for LPS 3. Coating with AMLGuard however displayed efficiencie above 80% for test periods of 7 and 21 days. However, the other two coatings had considerable variation in efficien y values with LPS 2 displaying most variation and low inhibition efficien y for test periods of 7 and 14 days. The efficien cies were in the following decreasing order LPS 3 (100%) >AMLGuard (79%) >LPS 2 (27%) >Ardrox 3961 (17%).
3.5. XPS analysis
Figs. 20-25 present the XPS spectra of the specimens coated with the four CICs.In all cases the spectra consisted ofstrong peaks of carbon, oxygen, magnesium and chromium.The binding energy of Cr was at 576.8eV consistent with hydroxide or oxide of Cr III. The presence of Cr was linked to chromic acid used for cleaning of the specimens after the immersion tests. In addition, XPS analysis of a freshly polished specimen was also carried out to differentiate adventitious carbon from other types. In this case, several steps of ion milling were performed and the area re-examined after each milling step.

Table 8 Average corrosion rates calculated from the evolved hydrogen volume, PAH including standard deviation (SD) for all alloys tested with and without coating in 3.5wt% (0.6M) NaCl solution saturated with Mg(OH)2 with and without coating for periods of 7, 14 and 21 days.
Table 9 Average mass loss Δ and corresponding efficien y values η for all alloys and all coatings tested in 3.5wt% (0.6M) NaCl solution saturated with Mg(OH)2 with and without coating for periods of 7, 14 and 21 days. The values Δ for the uncoated alloys are extracted from the previous study[86,87].
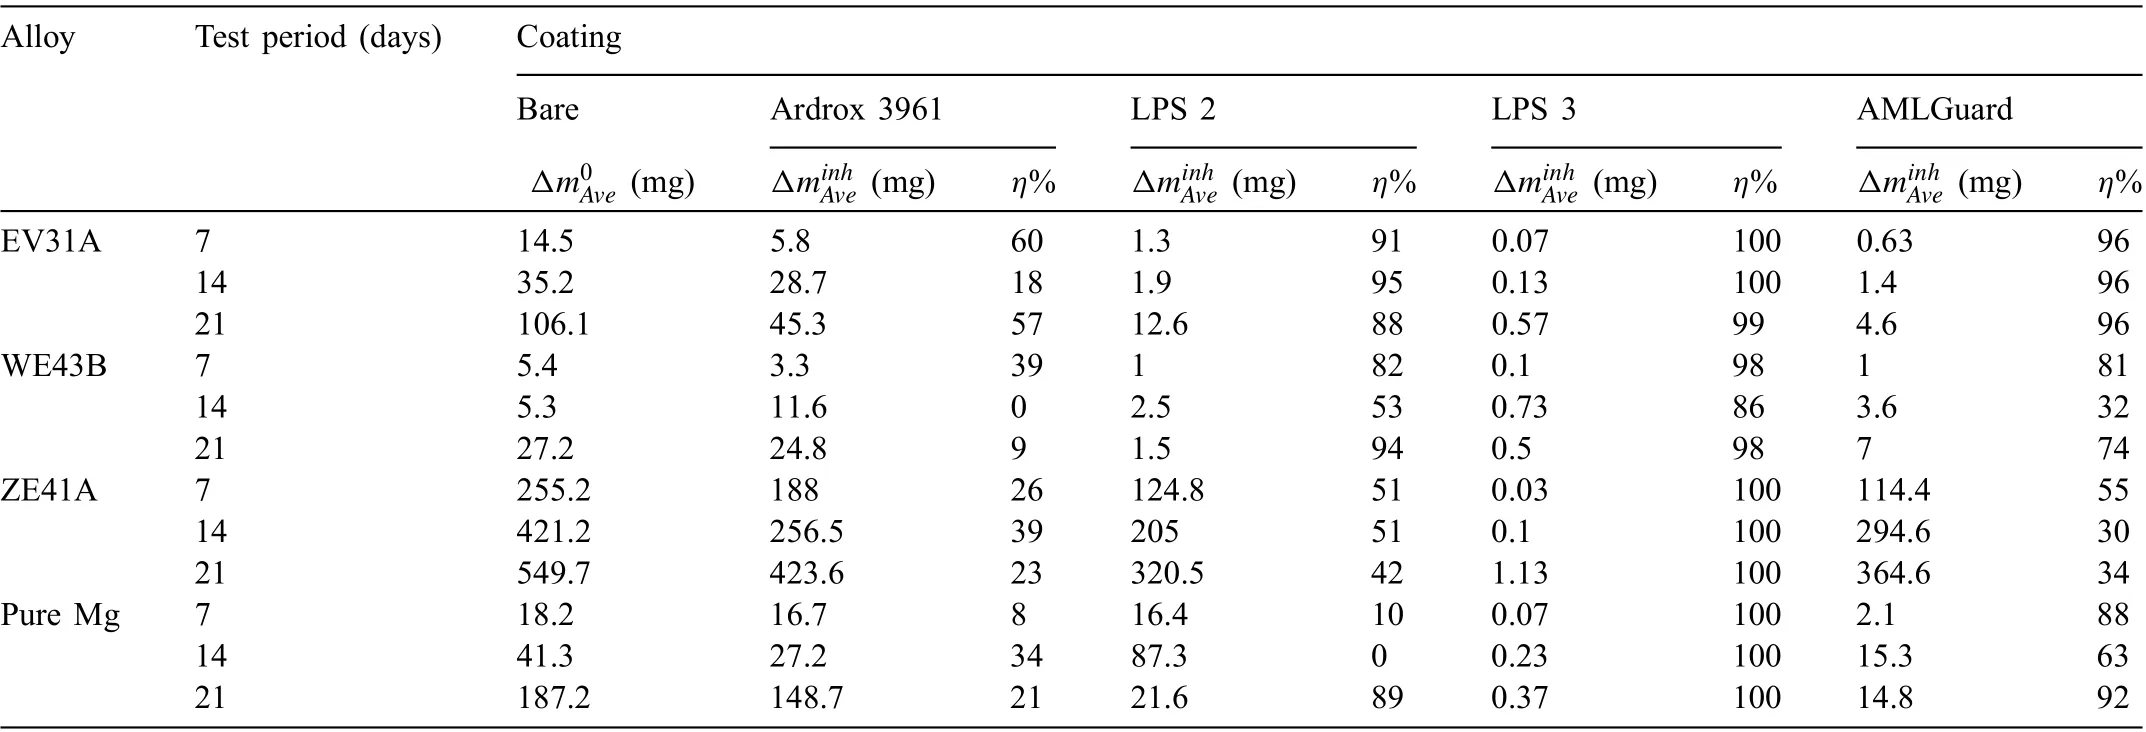
Table 9 Average mass loss Δ and corresponding efficien y values η for all alloys and all coatings tested in 3.5wt% (0.6M) NaCl solution saturated with Mg(OH)2 with and without coating for periods of 7, 14 and 21 days. The values Δ for the uncoated alloys are extracted from the previous study[86,87].
Alloy Test period (days) Coating Bare Ardrox 3961 LPS 2 LPS 3 AMLGuard Δm0Ave (mg) ΔminhAve (mg) η% ΔminhAve (mg) η% ΔminhAve (mg) η% ΔminhAve (mg) η%EV31A 7 14.5 5.8 60 1.3 91 0.07 100 0.63 96 14 35.2 28.7 18 1.9 95 0.13 100 1.4 96 21 106.1 45.3 57 12.6 88 0.57 99 4.6 96 WE43B 7 5.4 3.3 39 1 82 0.1 98 1 81 14 5.3 11.6 0 2.5 53 0.73 86 3.6 32 21 27.2 24.8 9 1.5 94 0.5 98 7 74 ZE41A 7 255.2 188 26 124.8 51 0.03 100 114.4 55 14 421.2 256.5 39 205 51 0.1 100 294.6 30 21 549.7 423.6 23 320.5 42 1.13 100 364.6 34 Pure Mg 7 18.2 16.7 8 16.4 10 0.07 100 2.1 88 14 41.3 27.2 34 87.3 0 0.23 100 15.3 63 21 187.2 148.7 21 21.6 89 0.37 100 14.8 92
3.5.1. Ardrox 3961
Fig.20 presents the XPS spectra of WE43B specimen WECI-8 coated with Ardrox 3961, with associated quantitative data before and after ion milling for 60 s. The surface had high concentrations of carbon and oxygen, smaller quantities of Cr, Mg and C-O, and traces of sulphur. The binding energy suggested that carbon could be adventitious carbon. Ion milling to a depth of 3nm resulted in a large reduction of the carbon, and an increase in O and Mg. This indicates that the carbon rich surface layer was thin.
3.5.2. LPS 2
Fig. 21 shows XPS spectra of the EV31A specimen EVCI-25 coated with LPS 2, with quantitative data before and after ion milling for 60 s. Fig. 22 shows high resolution XPS scans for Mg, Cr, O and C. The surface of the specimen had high concentrations of C and O, and Cr and Mg in smaller quantities. After milling for 60 s the concentrations of (a)O and Mg increased, (b) Cr remained essentially steady, and(c) C decreased indicating that the carbon rich surface layer was thin. The binding energy of C suggests that it could be adventitious carbon. Fig. 22 shows that high resolution analysis revealed that (a) the peak associated with O was broad with different binding energies which were related to those of C-O and hydroxide peaks, (b) the position and shape of the carbon peak was associated with adventitious carbon, and(c) the Mg peaks were associated with Mg metal and Mg oxide/hydroxide, and possibly Mg carbonate.
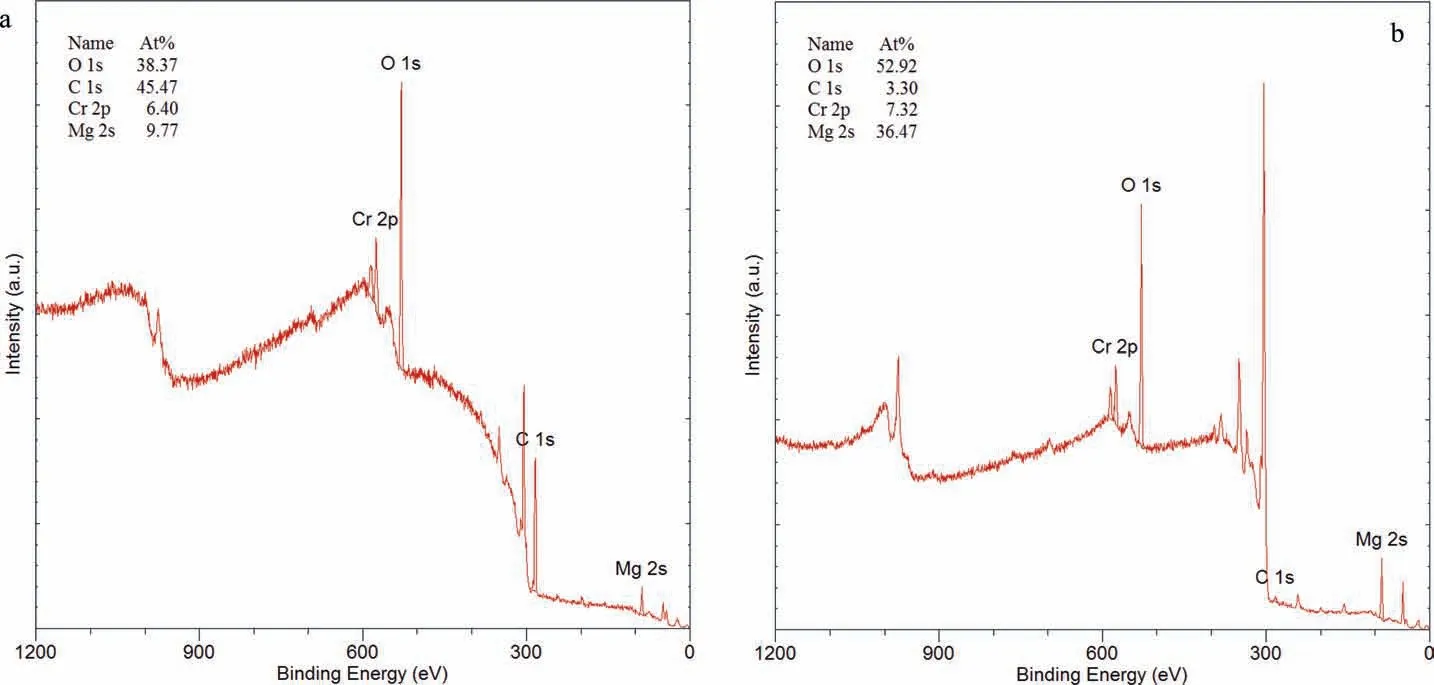
Fig. 20. XPS spectra and associated quantitative analysis of the WE43B specimen WE-CI-8 coated with Ardrox 3961 after the immersion test and after the cleaning of corrosion products: (a) before and (b) after ion milling for 60 s.
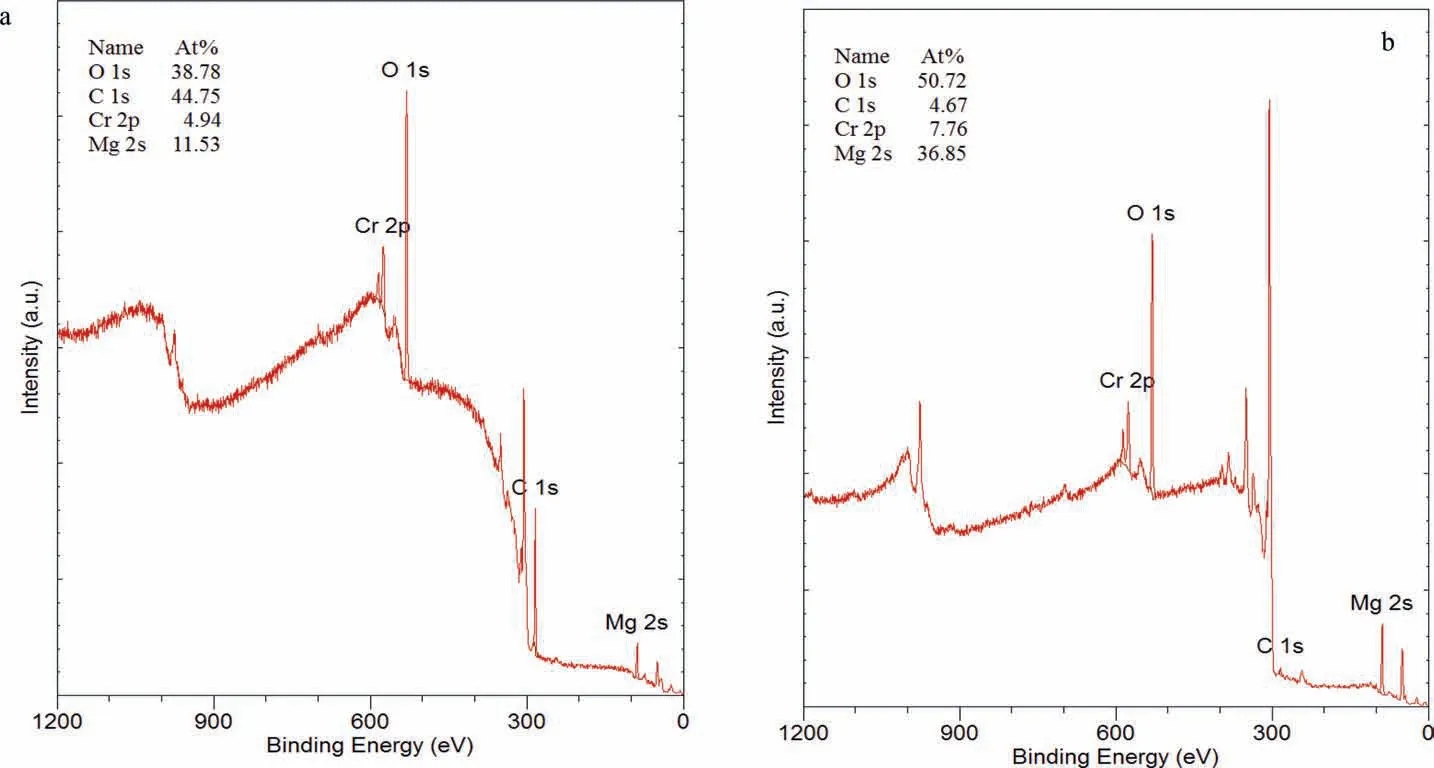
Fig. 21. XPS spectra and associated quantitative analysis of the EV31A specimen EV-CI-25 coated with LPS 2 after the immersion test and after the cleaning of corrosion products: (a) before and (b) after ion milling for 60 s.
3.5.3. LPS 3
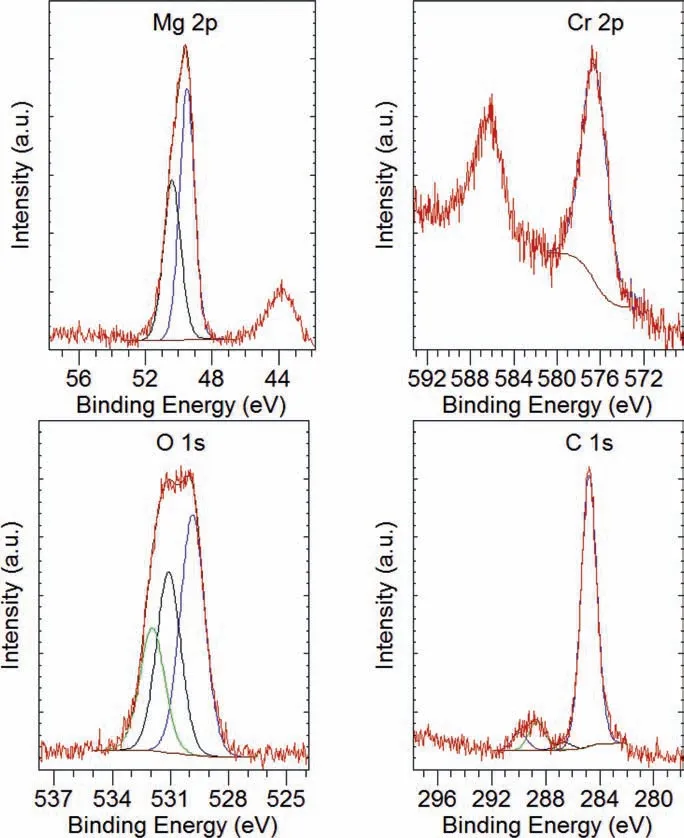
Fig. 22. XPS high resolution examination results to show spectra of the major elements fitte with CasaXPS software, of the EV31A specimen EVCI-25 coated with LPS 2 after the immersion test and after the cleaning of corrosion products.
This CIC formed a waxy translucent fil on the surface,which remained largely intact on the surface of most specimens including those immersed for 21 days. Two separate areas, appearing different in colour and identifie as dark and light were analysed. The analysis showed that both areas had similar XPS spectra. Consequently, the results of the lightcoloured area are presented. Fig. 23 presents the XPS spectra of the ZE41A specimen coated with LPS 3, and the quantitative data before and after 60 s of ion milling. The area had a high percentage of carbon of around 70 at%. Subsequent analysis of the area after the ion milling to a depth of 3nm revealed a substantial reduction in the carbon with(a) a comparable increase in oxygen and Mg and (b) a negligible change in Cr. The amount of carbon remaining after the milling was higher compared with the specimens coated with Ardrox 3961 and LPS 2 indicating that the carbon rich surface layer was comparably thicker. Fig. 24 presents the high-resolution scans for carbon before ion milling. The carbon peak was broad and complex with binding energies of different carbons including adventitious, aliphatic and possibly aromatic carbons.
3.5.4. AMLGuard
Fig. 25 presents the XPS spectra for the WE43B specimen WE-CI-29 coated with AMLGuard and associated quantitative data. The spectra show the presence of C associated with adventitious carbon and O in high concentrations, and Cr and Mg in smaller quantities. Ion milling resulted in substantial decrease in the amount of carbon and comparable increase in Mg and O with a small increase in Cr.
3.6. Corrosion morphology
Figs. 26-29 present SEM secondary micrographs of typical corrosion morphologies of the Mg alloys and pure Mg coated with the four CICs after the immersion for 21 days,and after cleaning of the corrosion products. The 21-day period provided the most severe corrosion.
3.6.1. Alloy EV31A
Fig. 26 shows the typical corrosion morphology of EV31A coated with the CICs, in this instance, (a) specimen EV-CI-11 coated with LPS 3; (b) specimen EV-CI-34 coated with AMLGuard and (c) specimen EV-CI-3 coated with Ardrox 3961. The corrosion morphology consisted of areas of low,moderate and high corrosion, the extent of which was related to the corrosion rates.
Fig. 26(a) presents a typical morphology of the low corrosion areas which consisted of cavities, isolated and in clusters, with sizes of less than 5μm. Some of the cavities were aligned along the grinding marks. Most of the eutectic phase particles remained intact.
The areas of moderate corrosion comprised networks of(a)high density of fin cavities and (b) wide and shallow cavities maybe partly formed. In the latter regions the presence of the coarse eutectic phase, marked by the arrows, resulted in some adjacent α matrix dissolution, see Fig. 26(b).
Fig. 26(c) presents an example of the areas of high corrosion, which contained large deep depressions formed by the coalescence of many smaller cavities resulting in substantial material loss.
3.6.2. Alloy WE43B
Fig.27 shows the typical corrosion morphology of WE43B coated with the corrosion inhibitors: (a) presents WE-CI-3 coated with Ardrox 3961, (b) presents WE-CI-10 coated with LPS 3, and (c) presents WE-CI-30 coated with AMLGuard.In all cases the corrosion morphology consisted of low and high corrosion areas, with ratios proportional to the corrosion rates. For instance, most of the surface areas of the specimens coated with Ardrox 3961 had corroded whilst for those coated with LPS 3 most of the surface area remained intact.
The areas of low corrosion consisted of small shallow cavities,isolated and in clusters, dispersed throughout the surface.Most of the cavities were less than 5μm in size. Some cavities were aligned along the grinding marks and coalesced around Zr particles forming larger cavities see Fig. 27(a).
The areas of high corrosion comprised of (i) large, shallow, interconnected cavities resulting in considerable surface roughening Fig 27(b),(ii)cavities of various sizes,depths and orientations, some of which were aligned forming deep furrows, and (iii) a small number of wide, deep cavities, formed as a result of coalescence of smaller cavities Fig. 27(c).
3.6.3. Alloy ZE41A
Fig. 28 presents the typical corrosion morphology of ZE41A: (a) areas of low corrosion as represented by ZECI-14 coated with LPS 3, and (b) areas of high corrosion represented by ZE-CI-31 coated with AMLGuard.
The areas of low corrosion were characterised by partial dissolution of the α-matrix in some regions, which occurred at the eutectic T-phase matrix interface and along the grain boundaries, with some regions remaining free from corrosion,see Fig. 28(a).
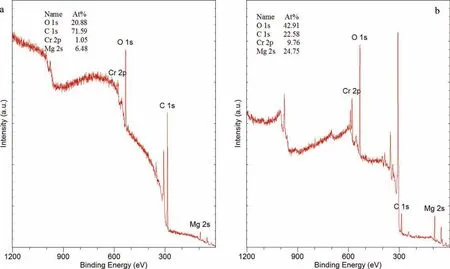
Fig. 23. XPS spectra and associated quantitative analysis of the ZE41A specimen ZE-CI-15 coated with LPS 3 after the immersion test and after the cleaning of corrosion products: (a) before and (b) after ion milling for 60 s.
The areas of high corrosion consisted of deep, wide cavities formed as a result of preferential, extensive dissolution of the α-matrix at the grain boundaries, and at the T-phase matrix interface so that whole grains had fallen out leading to substantial material loss, see Fig. 28(b). The remaining grains in this area had cavities and furrows on the surface due to corrosion.
3.6.4. Pure Mg
Fig. 29 presents the typical corrosion morphology of pure Mg coated with the CICs, tested for 21 days and after the removal of corrosion products: (a) presents specimen PM-CI-6 coated with Ardrox 3961, (b) PM-CI-32 coated with LPS 2, and (c) specimen PM-CI-41 coated with AMLGuard. The corrosion morphology of pure Mg, irrespective of the coating,consisted of areas of low and high corrosion with the extent directly related to corrosion rates.
The areas of low corrosion consisted of (a) isolated cavities of with sizes ranging from 5 to 20μm of various depths and orientations, some of which joined forming narrow shallow furrows (not shown here) Fig. 29(a), and (b) large, deep cavities formed by coalescence of smaller ones.There was evidence of filifor corrosion forming several isolated shallow furrows (not shown here).
The size, proportion and density of smaller cavities increased with increasing corrosion, so that in specimens with higher corrosion rates such as specimen PM-CI-32 coated with LPS 2 shown in Fig. 29(b) most of the cavities joined up forming larger and deeper furrows.
The areas of high corrosion comprised of (i) filifor corrosion forming networks of wide and shallow furrows some of which had developed into deeper cavities marked by the arrows in Fig. 29(a), (ii) networks of deep cavities of various lengths, depths, widths and orientations covering large areas (not shown); (iii) wide and deep furrows formed through coalescence of smaller ones, Fig. 29(b) and (iv) wide deep cavities, up to 2mm in depths see Fig. 29(c).
4. Discussion
The results of the current study showed that all four CICs inhibited the corrosion of the Mg alloys and pure Mg with varying efficiencies
4.1. CICs
4.1.1. Ardrox 3961
The results in Tables 7-9 show that corrosion rates PAHand PAWof the Mg alloys and pure Mg coated with Ardrox 3961 were somewhat lower in most cases compared with the bare alloys, with maximum efficiencie of η of 60% obtained for EV31A, tested for 7 days. However, there was poor consistency in the inhibition efficiencies This indicates that Ardrox 3961 provided some inhibition.
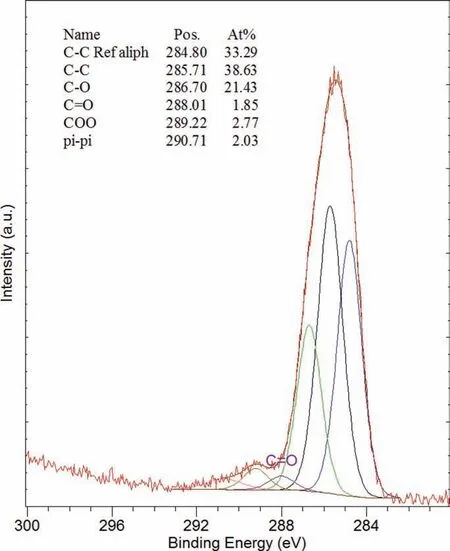
Fig. 24. XPS high resolution examination results to show the carbon spectrum fitte with CasaXPS software, of the ZE41A specimen ZE-CI-15 coated with LPS 3 after the immersion test and after the cleaning of corrosion products.
FTIR analysis revealed the presence of long chain alkanes and esters with carboxylic acid or ketones. The alkanes are non-polar hydrocarbons and do not form film by chemical adsorption on the metal surface. However, the esters and carboxylic acid, especially those with long chain and branched molecules, have been shown to inhibit corrosion of metals[37] by forming a close-packed, oriented surface film by chemical adsorption.
XPS analysis revealed that the specimen (immersed for 7 days) contained a thin surface layer rich in carbon and oxygen in which no nitrogen was detected. The binding energy of surface carbon was similar to that of adventitious carbon whilst that of oxygen was of oxide or hydroxide. The absence of nitrogen on the surface suggests benzotriazole did not play any discernible role in the corrosion process. However, the presence of adventitious carbon and oxygen of hydroxide indicates that there was no surface fil formed by Ardrox 3961. This, coupled with the inhibition data, suggests that the Ardrox 3961 coating was formed by physical adsorption of hydrocarbons, most probably long chain alkanes present in abundance in the CIC, and the contribution made by the esters and carboxylic acid under these conditions was negligible if any.This is because an additional fil formed by the esters and carboxylic acid would have increased the inhibition efficien y of the CIC, and improved the consistency.The XPS results also indicated that the coating had a short lifetime and desorbed from the surface during the immersion test. In other words, the blanketing effect was temporary, lasting a few hours, after which the normal corrosion proceeded with the corrosion rates dependant on the microstructure of the alloy, and sample to sample variation.
The results show that Ardrox 3961 was least effective in providing the corrosion protection for the Mg alloys and pure Mg.
4.1.2. LPS 2
Tables 7-9 show that coating the Mg alloys with LPS 2 resulted in a reduction in corrosion rates PAHand PAWwith the inhibition efficiencie η ranging from 0% to 95%. However,the pure Mg specimens exhibited inconsistent results,and low efficiencies In summary, this suggests that in most cases LPS 2 provided a better corrosion protection than Ardrox 3961.
FTIR analysis confirme the presence of hydrocarbons,such as long chain branched alkanes as the major component, with alkenes, esters, and possibly some sulfonates, the accurate verificatio of which was difficult Some of the hydrocarbons were polar and aromatic. XPS analysis found the presence of adventitious carbon and oxygen, which was associated with oxide or hydroxide. No other types of carbon associated with esters or alkanes were detected.
The low viscosity of the LPS 2 coating suggests the coating was mainly formed by the long chain hydrocarbons by means of physical adsorption, thus blanketing the surface from the solution. The XPS results indicate that the coating also had a short lifetime and dissolved in the solution during the immersion test. However, the immersion tests showed that LPS 2 coated alloys generally had lower corrosion rates and higher inhibition efficien y than Ardrox 3961. This suggests that (a) physical adsorption may have produced a longer lasting fil because of longer chain molecules (higher number of carbon atoms), and (b) that the polar hydrocarbons may also have played a role in the corrosion process by chemically adsorbing on the surface. In either case the fil had a short lifetime and desorbed from the surface during the immersion tests.
Thus, the results show that LPS 2 had a better inhibiting efficien y in reducing corrosion than Ardrox 3961.
4.1.3. LPS 3
Coating the Mg alloys and pure Mg with LPS 3 resulted in almost complete suppression of corrosion, with corrosion rates PAHand PAWessentially zero for all specimens and test periods, and inhibition efficiencie of 100% in most cases.
FTIR analysis found that the CIC coating contained medium aliphatic alkanes, with saturated esters, heterocyclic ring compounds and calcium carbonate,the presence of which was also confirme by SEM analysis.
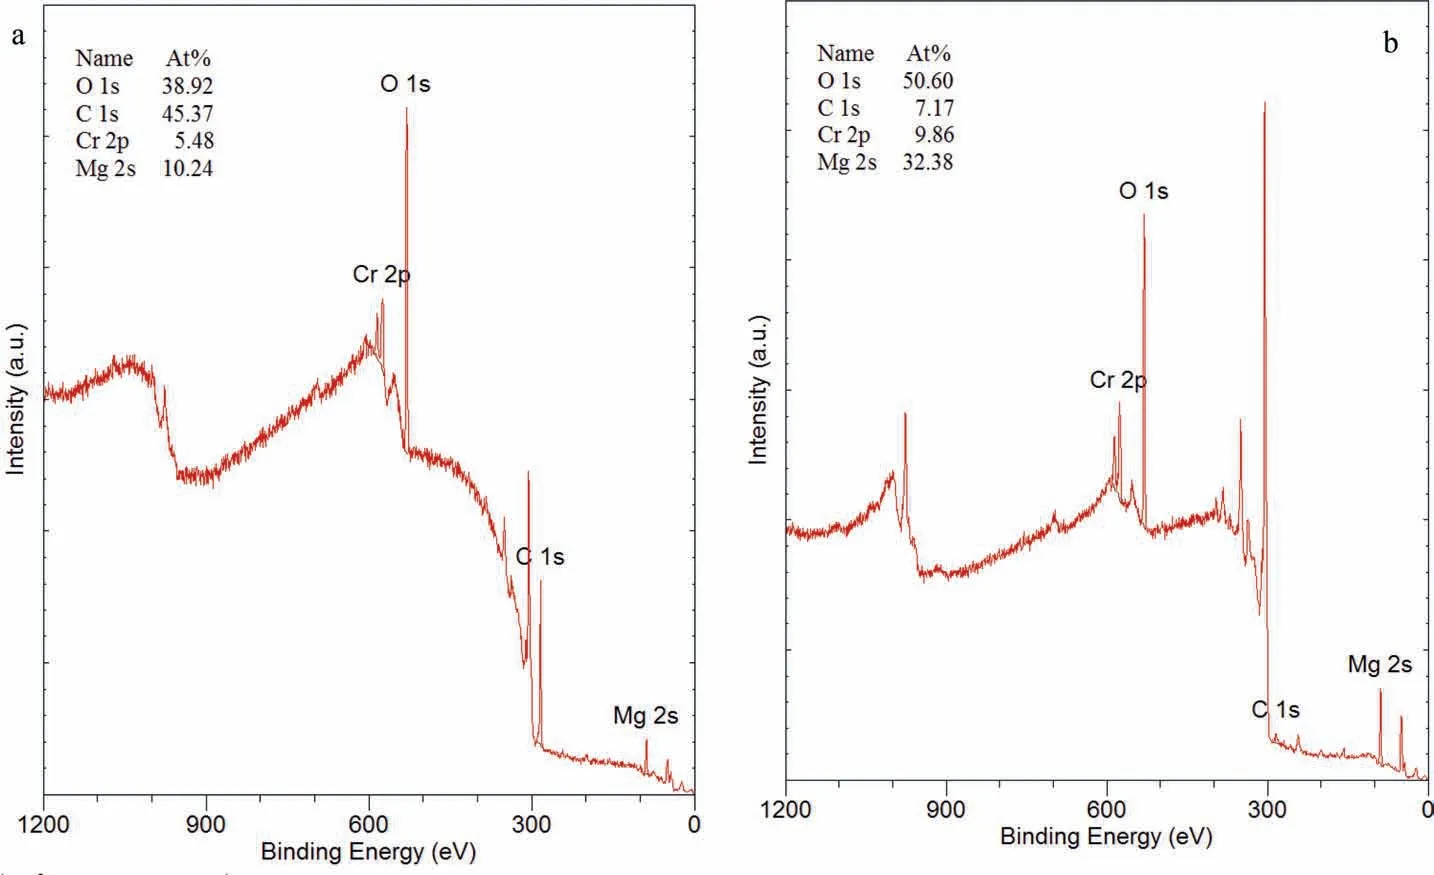
Fig. 25. XPS spectra and associated quantitative analysis of the WE43B specimen WE-CI-29 coated with AMLGuard after the immersion test and after the cleaning of corrosion products: (a) before and (b) after ion milling for 60 s.

Fig. 26. SEM secondary electron micrographs of the EV31A specimens; (a) EV-CI-11 coated with LPS 3; (b) EV-CI- 34 coated with AMLGuard and (c)EV-CI-3 coated with Ardrox 3961, after immersion in 0.6M NaCl solution saturated with Mg(OH)2 for 21 days to show the typical corrosion morphology.There were areas of low corrosion comprised of small and shallow cavities, isolated and in clusters dispersed throughout the matrix and presented in (a).Moreover, the alloy also had areas of moderate corrosion containing (1) small and shallow cavities which coalesced into larger and longer cavities (arrowed),and (2) filifor corrosion in the form of wide and shallow depressions and presented in (b). Finally, the alloy exhibited areas of high corrosion with very large and deep cavities formed as a result of coalescence of many small cavities resulting in substantial material loss and presented in (c).
XPS analysis revealed that the ZE41A specimen immersed for 21 days had a surface fil rich in carbon and oxygen,with some chromium and magnesium. No calcium was detected,indicating that it did not play any discernible role in corrosion inhibition. Unlike the previous two CICs, the carbon peak in LPS 3 was broad and contained different types of carbon, including aromatic heavy hydrocarbons previously identifie by FTIR analysis. This suggests aromatic long chain hydrocarbons formed a close-packed surface fil by chemical adsorption, which was thicker and much more durable than all the other films in agreement with previous studies conducted on different metals and alloy systems [37,57,90,91].

Fig. 27. SEM secondary electron micrographs of the WE43B specimens; (a) specimen WE-CIC-10 coated with LPS 3, (b) specimen WE-CI-3 coated with Ardrox 3961, and (c) specimen WE-CI-30 coated with AMLGuard, after immersion in 0.6M NaCl solution saturated with Mg(OH)2 for 21 days to show the typical corrosion morphology. There were areas of low corrosion comprised of small and shallow cavities dispersed throughout the matrix some of which coalesced along the grinding marks and Zr particles, marked by the arrow in (a). The alloy displayed areas of high corrosion with a number of wide and deep cavities, considerable surface roughening in (b) and numerous deep crack like cavities some of which were aligned in (c). The specimen WE-CIC-30 also had a large very deep cavity extending approximately half the specimen thickness.
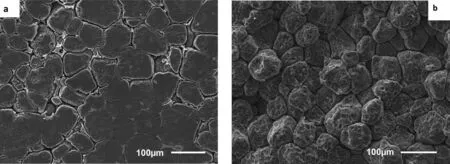
Fig. 28. SEM secondary electron micrographs of the ZE41A specimens; (a) ZE-CI-14 coated with LPS 3 and (b) ZE-CI-31 coated with AMLGuard, after immersion in 0.6M NaCl solution saturated with Mg(OH)2 for 21 days to show the typical corrosion morphology. In the specimen ZE-CI-14 corrosion resulted in (i) the dissolution of eutectic T-phase at the grain boundaries, (ii) general surface roughening and (iii) the formation of numerous small cavities in the α-matrix. In the ZE-CI-31, however the corrosion proceeded by (i) the formation of cavities on the α-matrix grains and (ii) preferential dissolution of the α-matrix along the grain boundaries and at the matrix/T-phase interface so that the individual grains fell out.

Fig. 29. SEM secondary electron micrographs of the pure Mg specimens; (a) PM-CI-6 coated with Ardrox 3961, (b) PM-CI-32 coated with LPS 2 and (c)PM-CI-41 coated with AMLGuard after immersion in 0.6M NaCl solution saturated with Mg(OH)2 for 21 days to show the typical corrosion morphology.There were areas of low corrosion characterised by the presence of a relatively small number of cavities of various sizes, orientations and depths, some of which were connected. Also the alloy had areas of high corrosion comprised of (i) long, wide and shallow furrows, (ii) deep cracklike cavities (not shown),(iii) large and deep cavities and (iv) substantial dissolution of the α-matrix (shown on the right hand side resulting in considerable surface roughening).
The corrosion rates PAHand PAWshowed almost complete suppression of corrosion,however there were clear signs of corrosion during SEM examination on all representative specimens, especially for ZE41A, an alloy with high corrosion rates as shown in Fig. 28. This indicates that testing for longer periods would result in an increase in corrosion rates suggesting that under these circumstances 21 days were perhaps towards the maximum period for this CIC to be effective in corrosion inhibition.
4.1.4. AMLGuard
Coating the Mg alloys with AMLGuard resulted in corrosion rates PAHand PAWcomparable with those coated with LPS 2 with the inhibition efficiencie η ranging from 34%to 96%. However, corrosion rates PAHand PAWof pure Mg coated with AMLGuard were considerably lower, with inhibition rates higher than those coated with LPS 2.
FTIR analysis confirme the presence of an aromatic carboxyl and ester with some aromatic alkanes. The presence of barium (barium petroleum sulfonate) and phosphorus (alkyl ammonium organic phosphate) could not be accurately established, possibly because the concentration of these compounds was low. However, these elements were identifie by SEM analysis.
XPS spectra of the WE43B specimen WE-CI-29 (immersed for 21 days) revealed the presence of adventitious carbon and oxygen of oxide and hydroxide, in concentrations similar to those coated with Ardrox 3961 and LPS 2,in which no barium and phosphorus were detected. This indicates that(a) the corrosion inhibitors barium petroleum sulfonate and alkyl ammonium organic phosphate did not play any role in corrosion inhibition, and (b) the inhibition was the results of chemical adsorption of the aromatic hydrocarbons, which formed a barrier fil on the surface. Somewhat lower corrosion rates of the Mg alloys indicated that this fil was more protective, perhaps lasting longer, than those formed on alloy surfaces coated with Ardrox 3961 and LPS 2, especially for pure Mg.
However, the presence of adventitious carbon clearly suggests that desorption of the fil occurred at some point during the test leaving the alloys unprotected. This means that coating with AMLGuard provided only temporary protection to the Mg alloys.
4.2. Corrosion morphology
The corrosion morphology of the Mg alloys and pure Mg coated with the four CICs displayed similar features. For all coating conditions, except for those coated with LPS 3, the corrosion morphology comprised of areas of low,medium and high corrosion, which were similar to those tested as bare[83,84]. However, in the latter case the corrosion morphology comprised of areas of low corrosion.
The extent of corrosion and proportion of the areas were dependant on the CIC applied. That is the percentage of the surface area having little or no corrosion was generally proportional to the corrosion rate, and inhibition efficien y. The alloys and pure Mg coated with Ardrox 3961 generally had a small percentage of the area of low corrosion. Pure Mg specimens tested as bare exhibited a smaller percentage of the area of low corrosion compared with those coated with Ardrox 3961. This percentage generally increased with coating with LPS 2 and was comparable to those coated with AMLGuard.
5. Conclusion
The results of the current study reveal the following:
1 All four CICs were effective in reducing the corrosion of the Mg alloys EV31A, WE43B, ZE41A and pure Mg.
2 Coating with Ardrox 3961 was least effective with generally low inhibition efficien y. Long chain hydrocarbons present in Ardrox 3961 formed a barrier fil by physical adsorption and provided blanketing for the alloys and pure Mg from the solution. This fil had a short lifetime and desorbed from the surface during the immersion test, thus providing only temporary protection.
3 Coating with LPS 2 and AMLGuard resulted in a greater reduction in corrosion rates compared with Ardrox 3961, with comparable corrosion rates and inhibition efficien y. Hydrocarbons present in LPS 2 with longer chain molecules formed a barrier fil through physical adsorption which was more lasting than that of Ardrox 3961. The fil had a short lifetime and provided temporary protection. For AMLGuard the barrier fil was formed by aromatic long chain hydrocarbons through chemical adsorption, which provided temporary protection.
4 LPS 3 provided almost complete suppression of corrosion,with zero corrosion rates and 100% inhibition efficiencie in most cases. This was attributed to a thicker and more durable barrier fil formed by long chain aromatic hydrocarbons through chemical adsorption.
Conflic of interest
The authors declare that there are no conflict of interest.
Acknowledgements
This work was supported and funded by the Defence Materials Technology Centre. The authors wish to thank staff at the Centre for Microscopy and Microanalysis, and the University of Queensland, for their support and guidance in conducting SEM and EDS analysis. Thanks to Jacob McCann for assistance in data analysis.
Table A1.
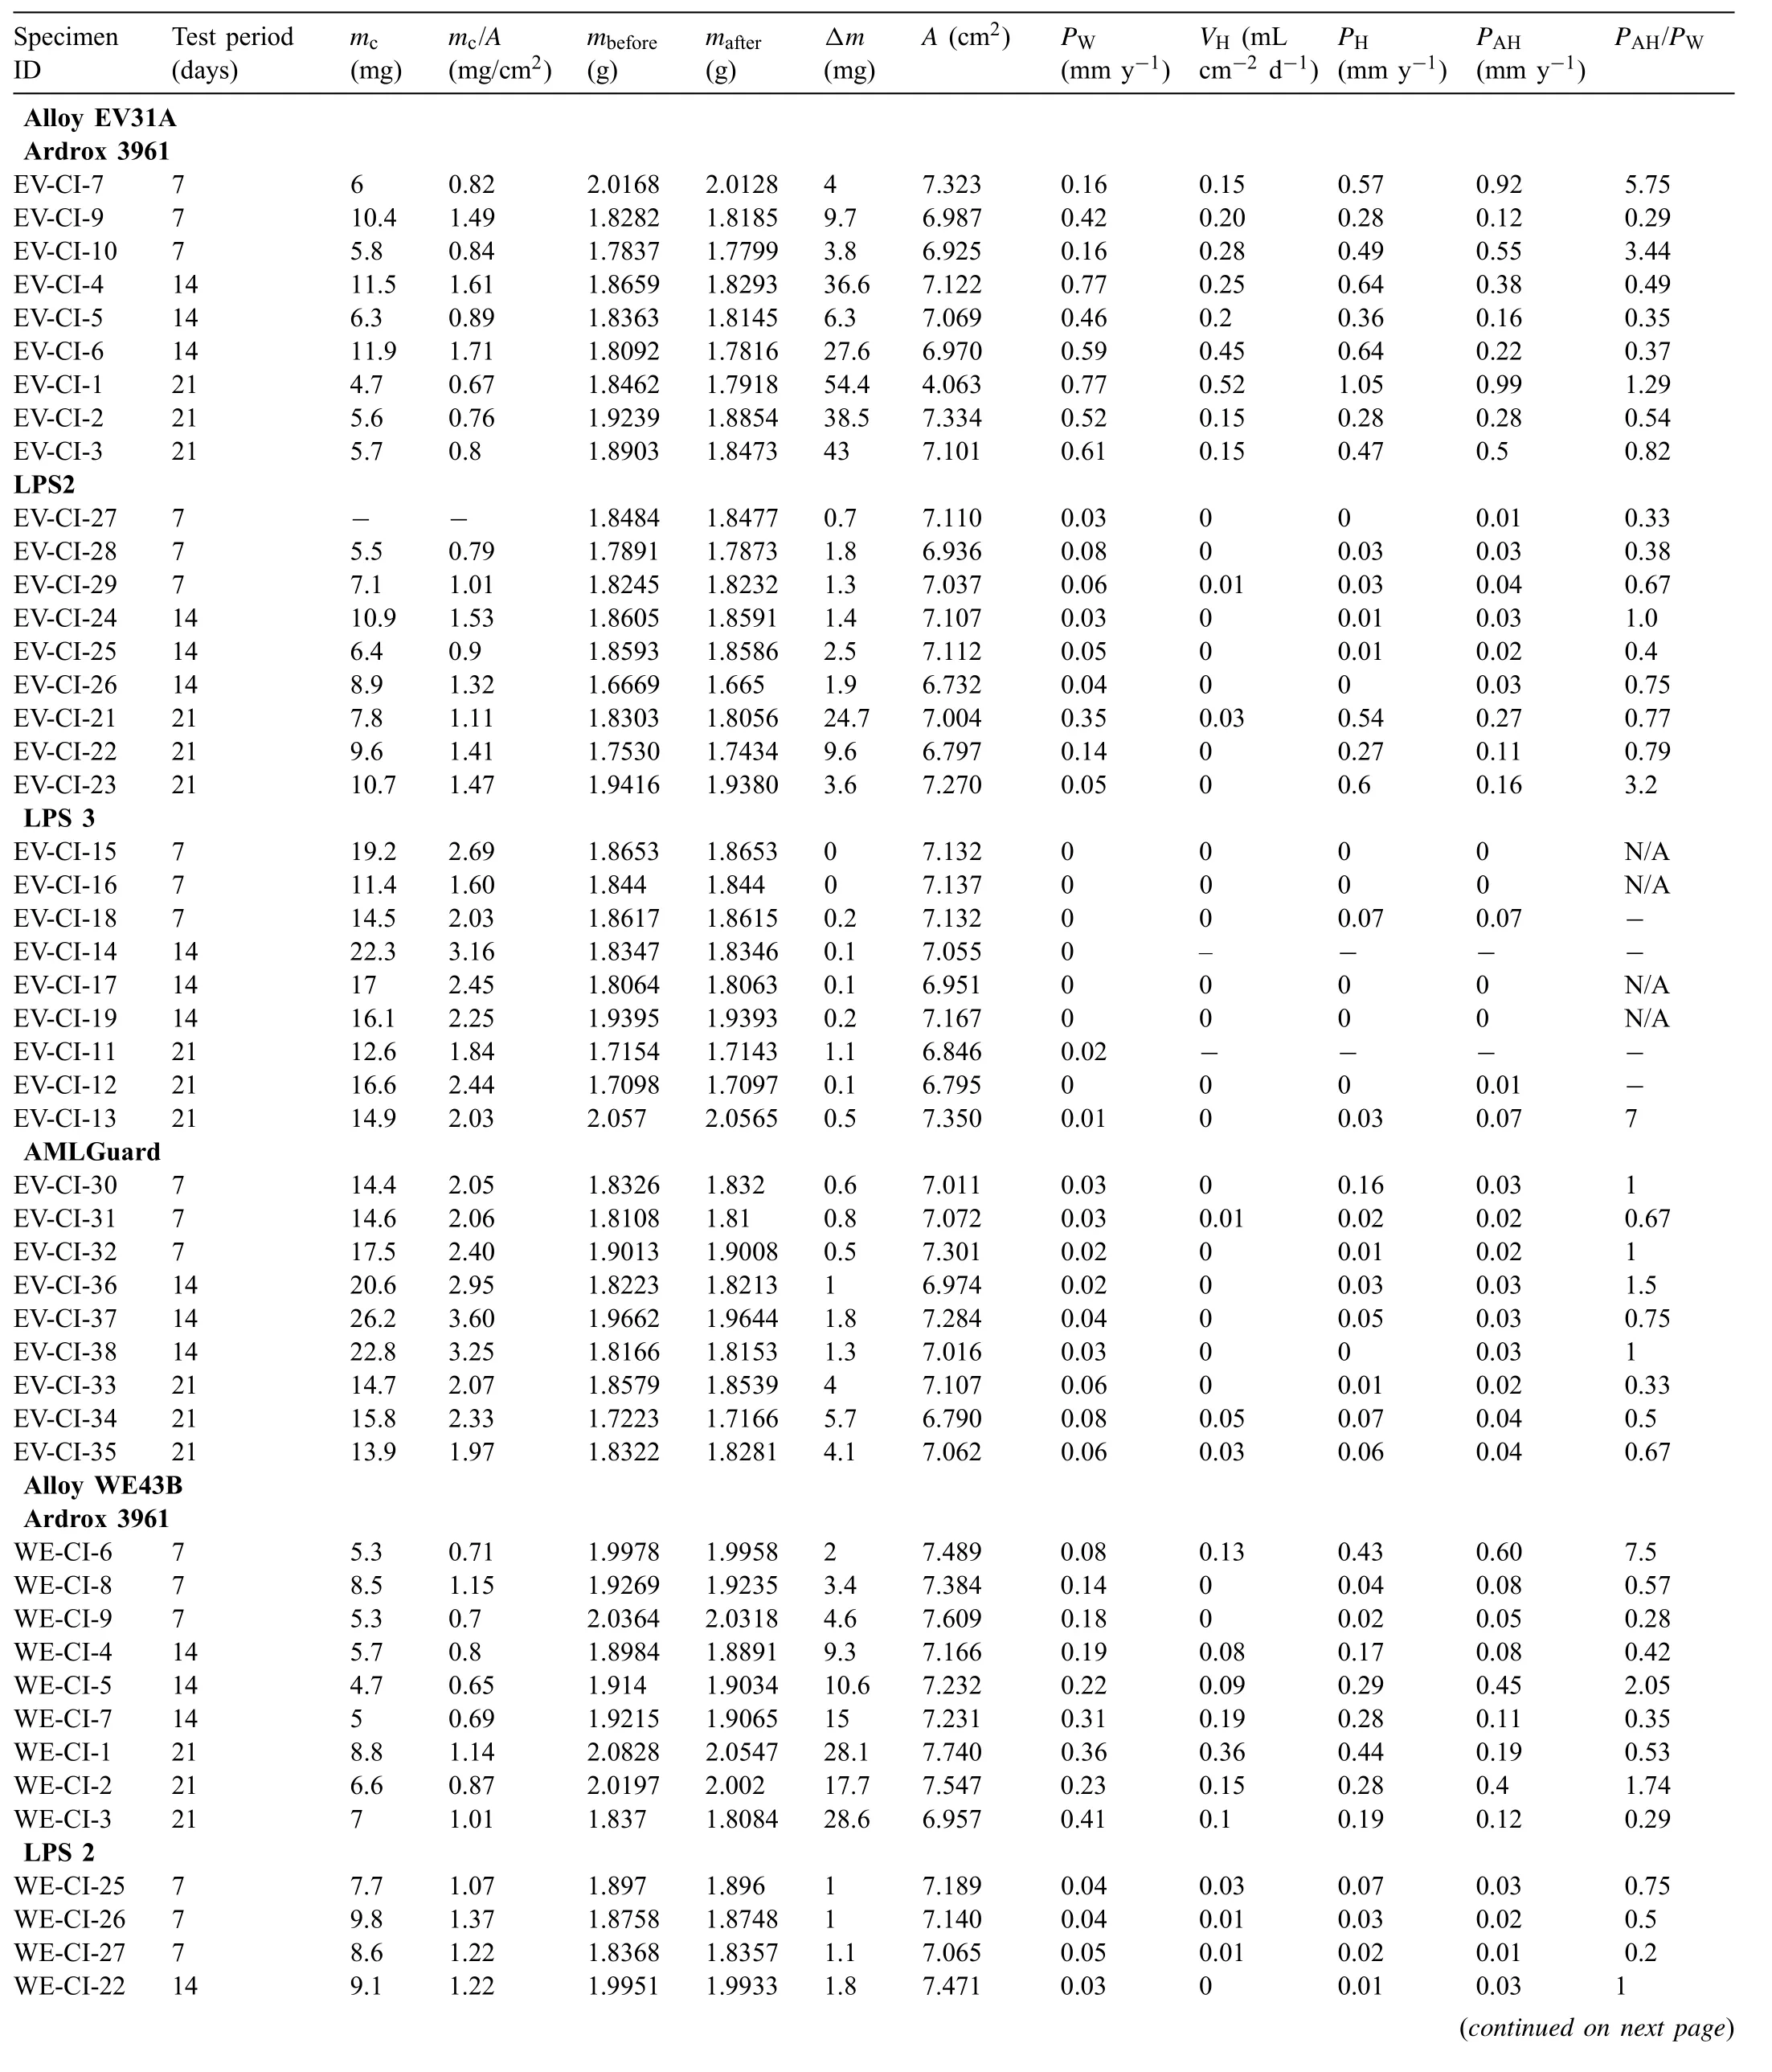
Table A1 Mass loss data Δm, coating mass mc, specifi coating mass mc/A, corrosion rates calculated from the mass loss PW, volume of hydrogen evolved VH and corrosion rates calculated from the evolved hydrogen PH for magnesium alloys with and without coatings and immersion tested in 3.5wt% (0.6M) NaCl solution saturated with Mg (OH)2 for 7, 14 and 21 days. VH represents the last measurements taken on the fina day of the test while PH corresponds to values measured during the fina days and calculated using Eq. (5) and PAH is the average corrosion rate calculated from the evolved hydrogen over the test period.
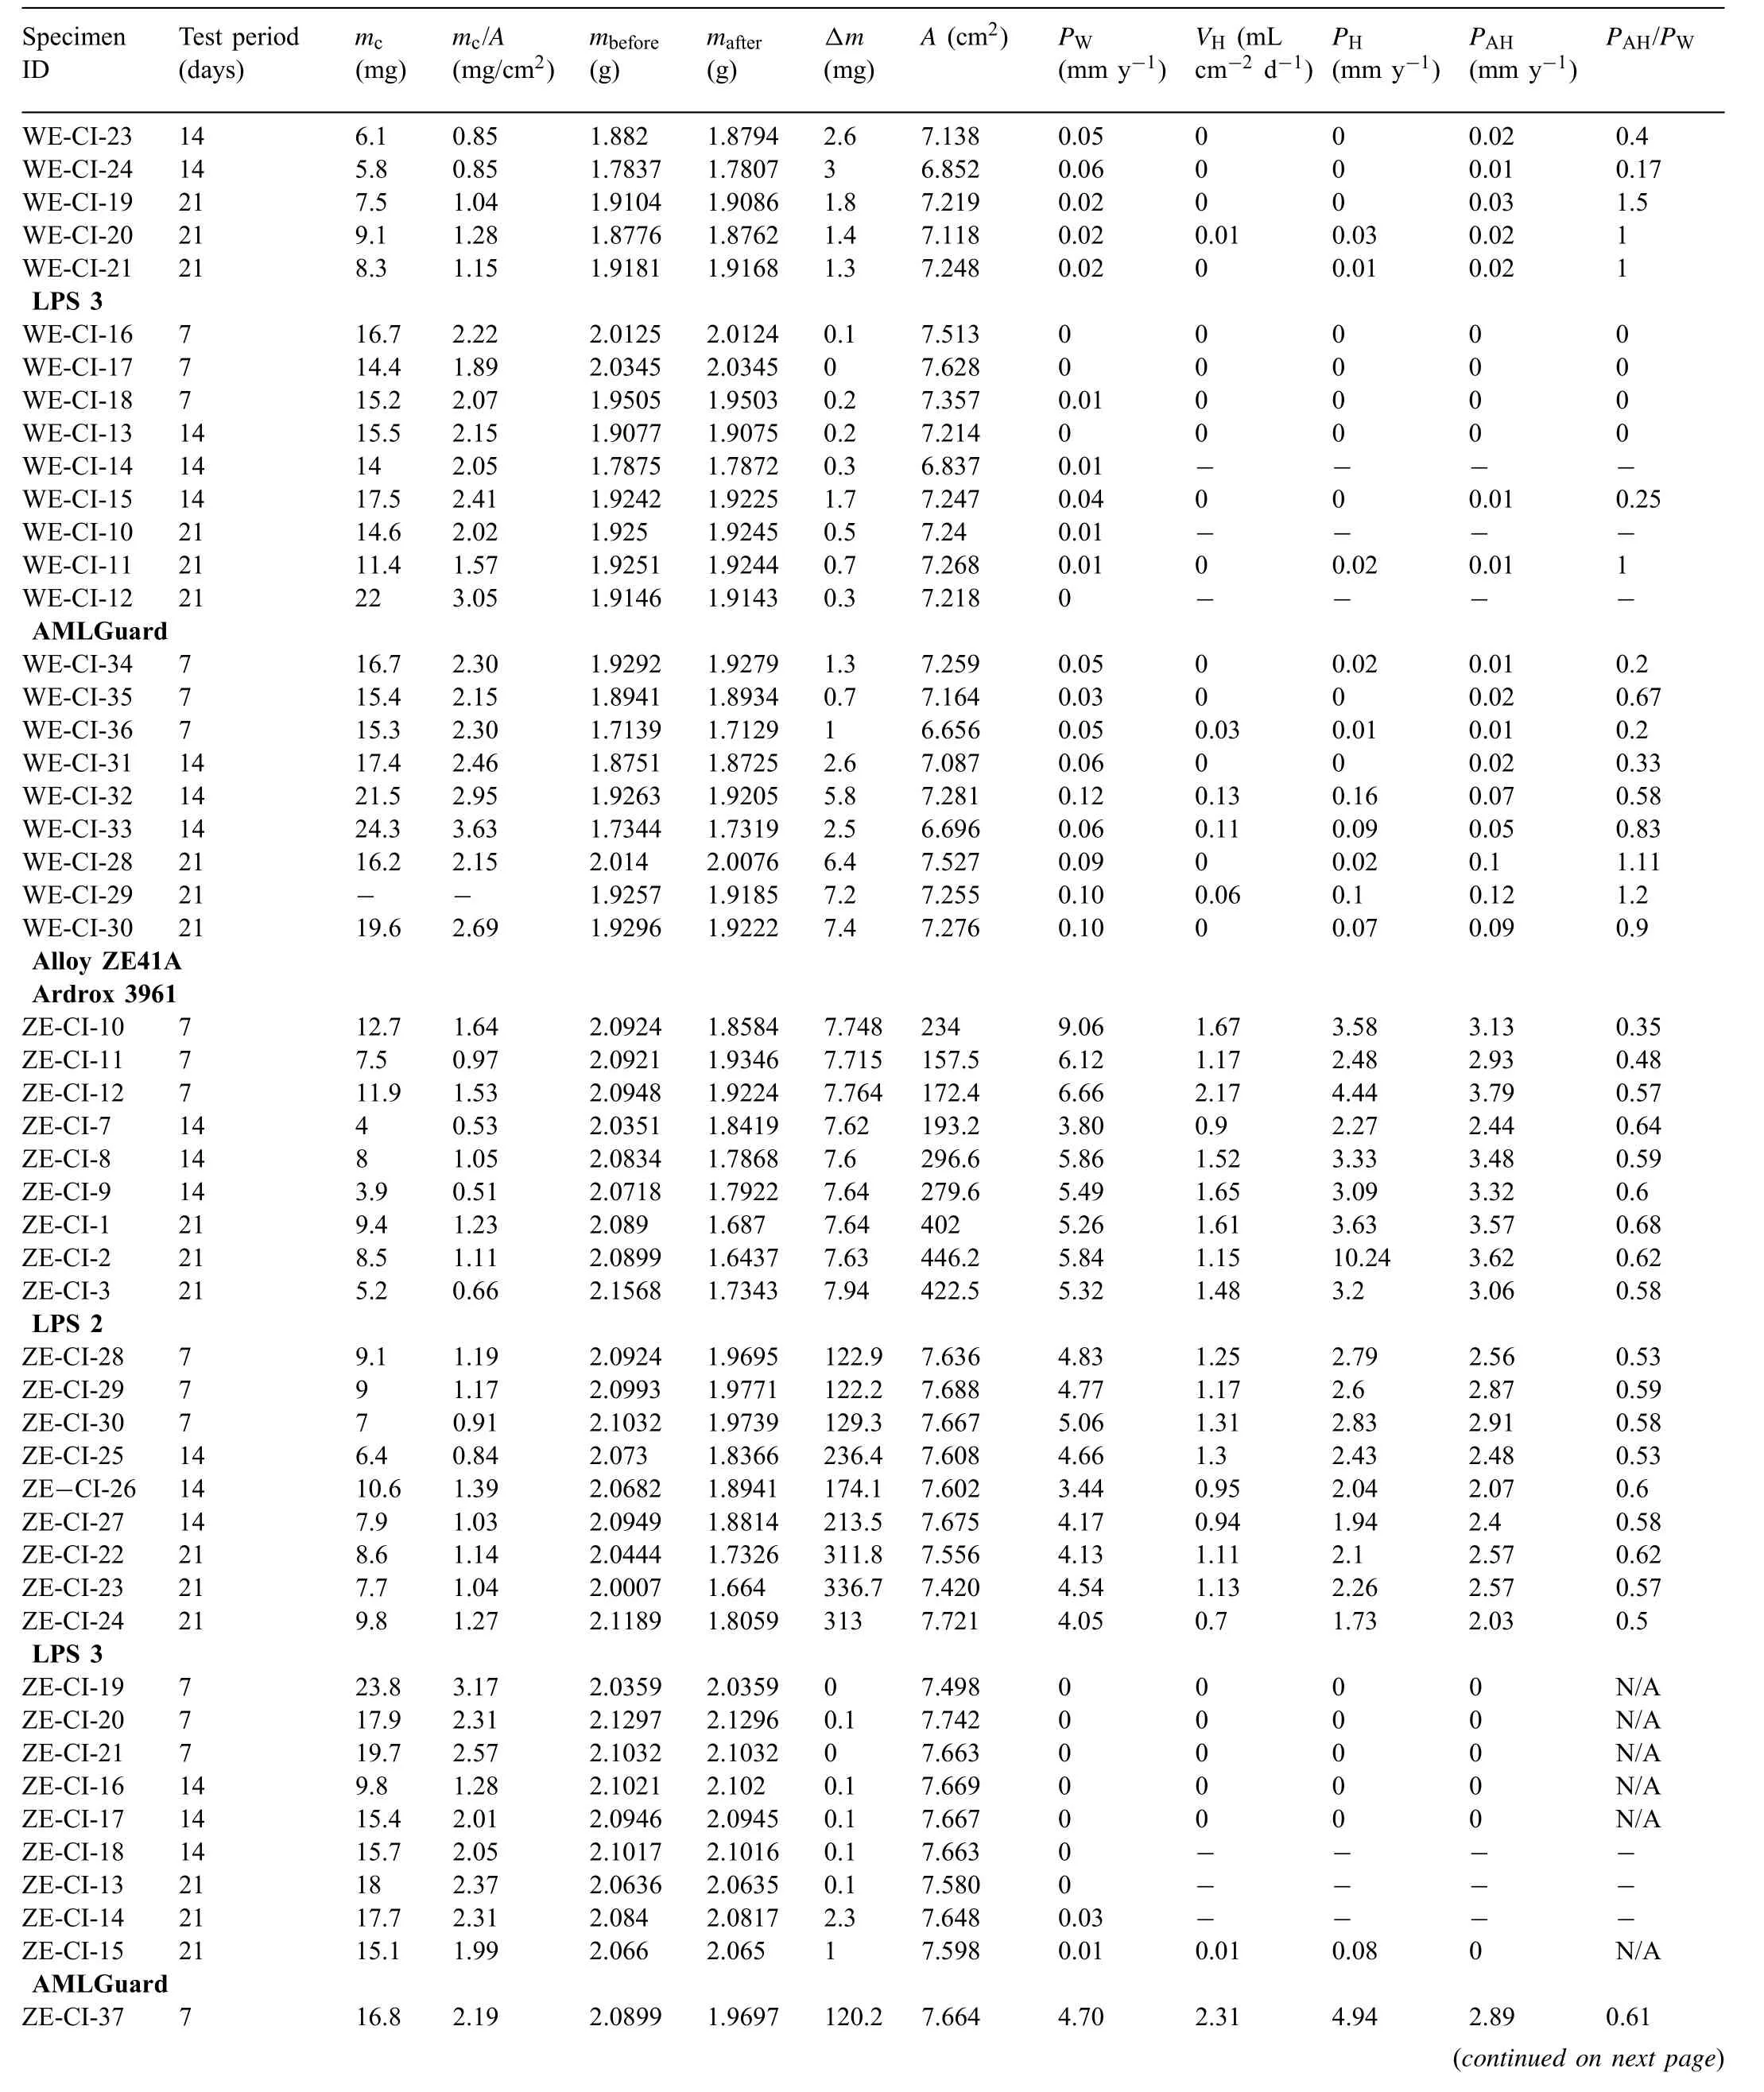
Table A1 (continued)
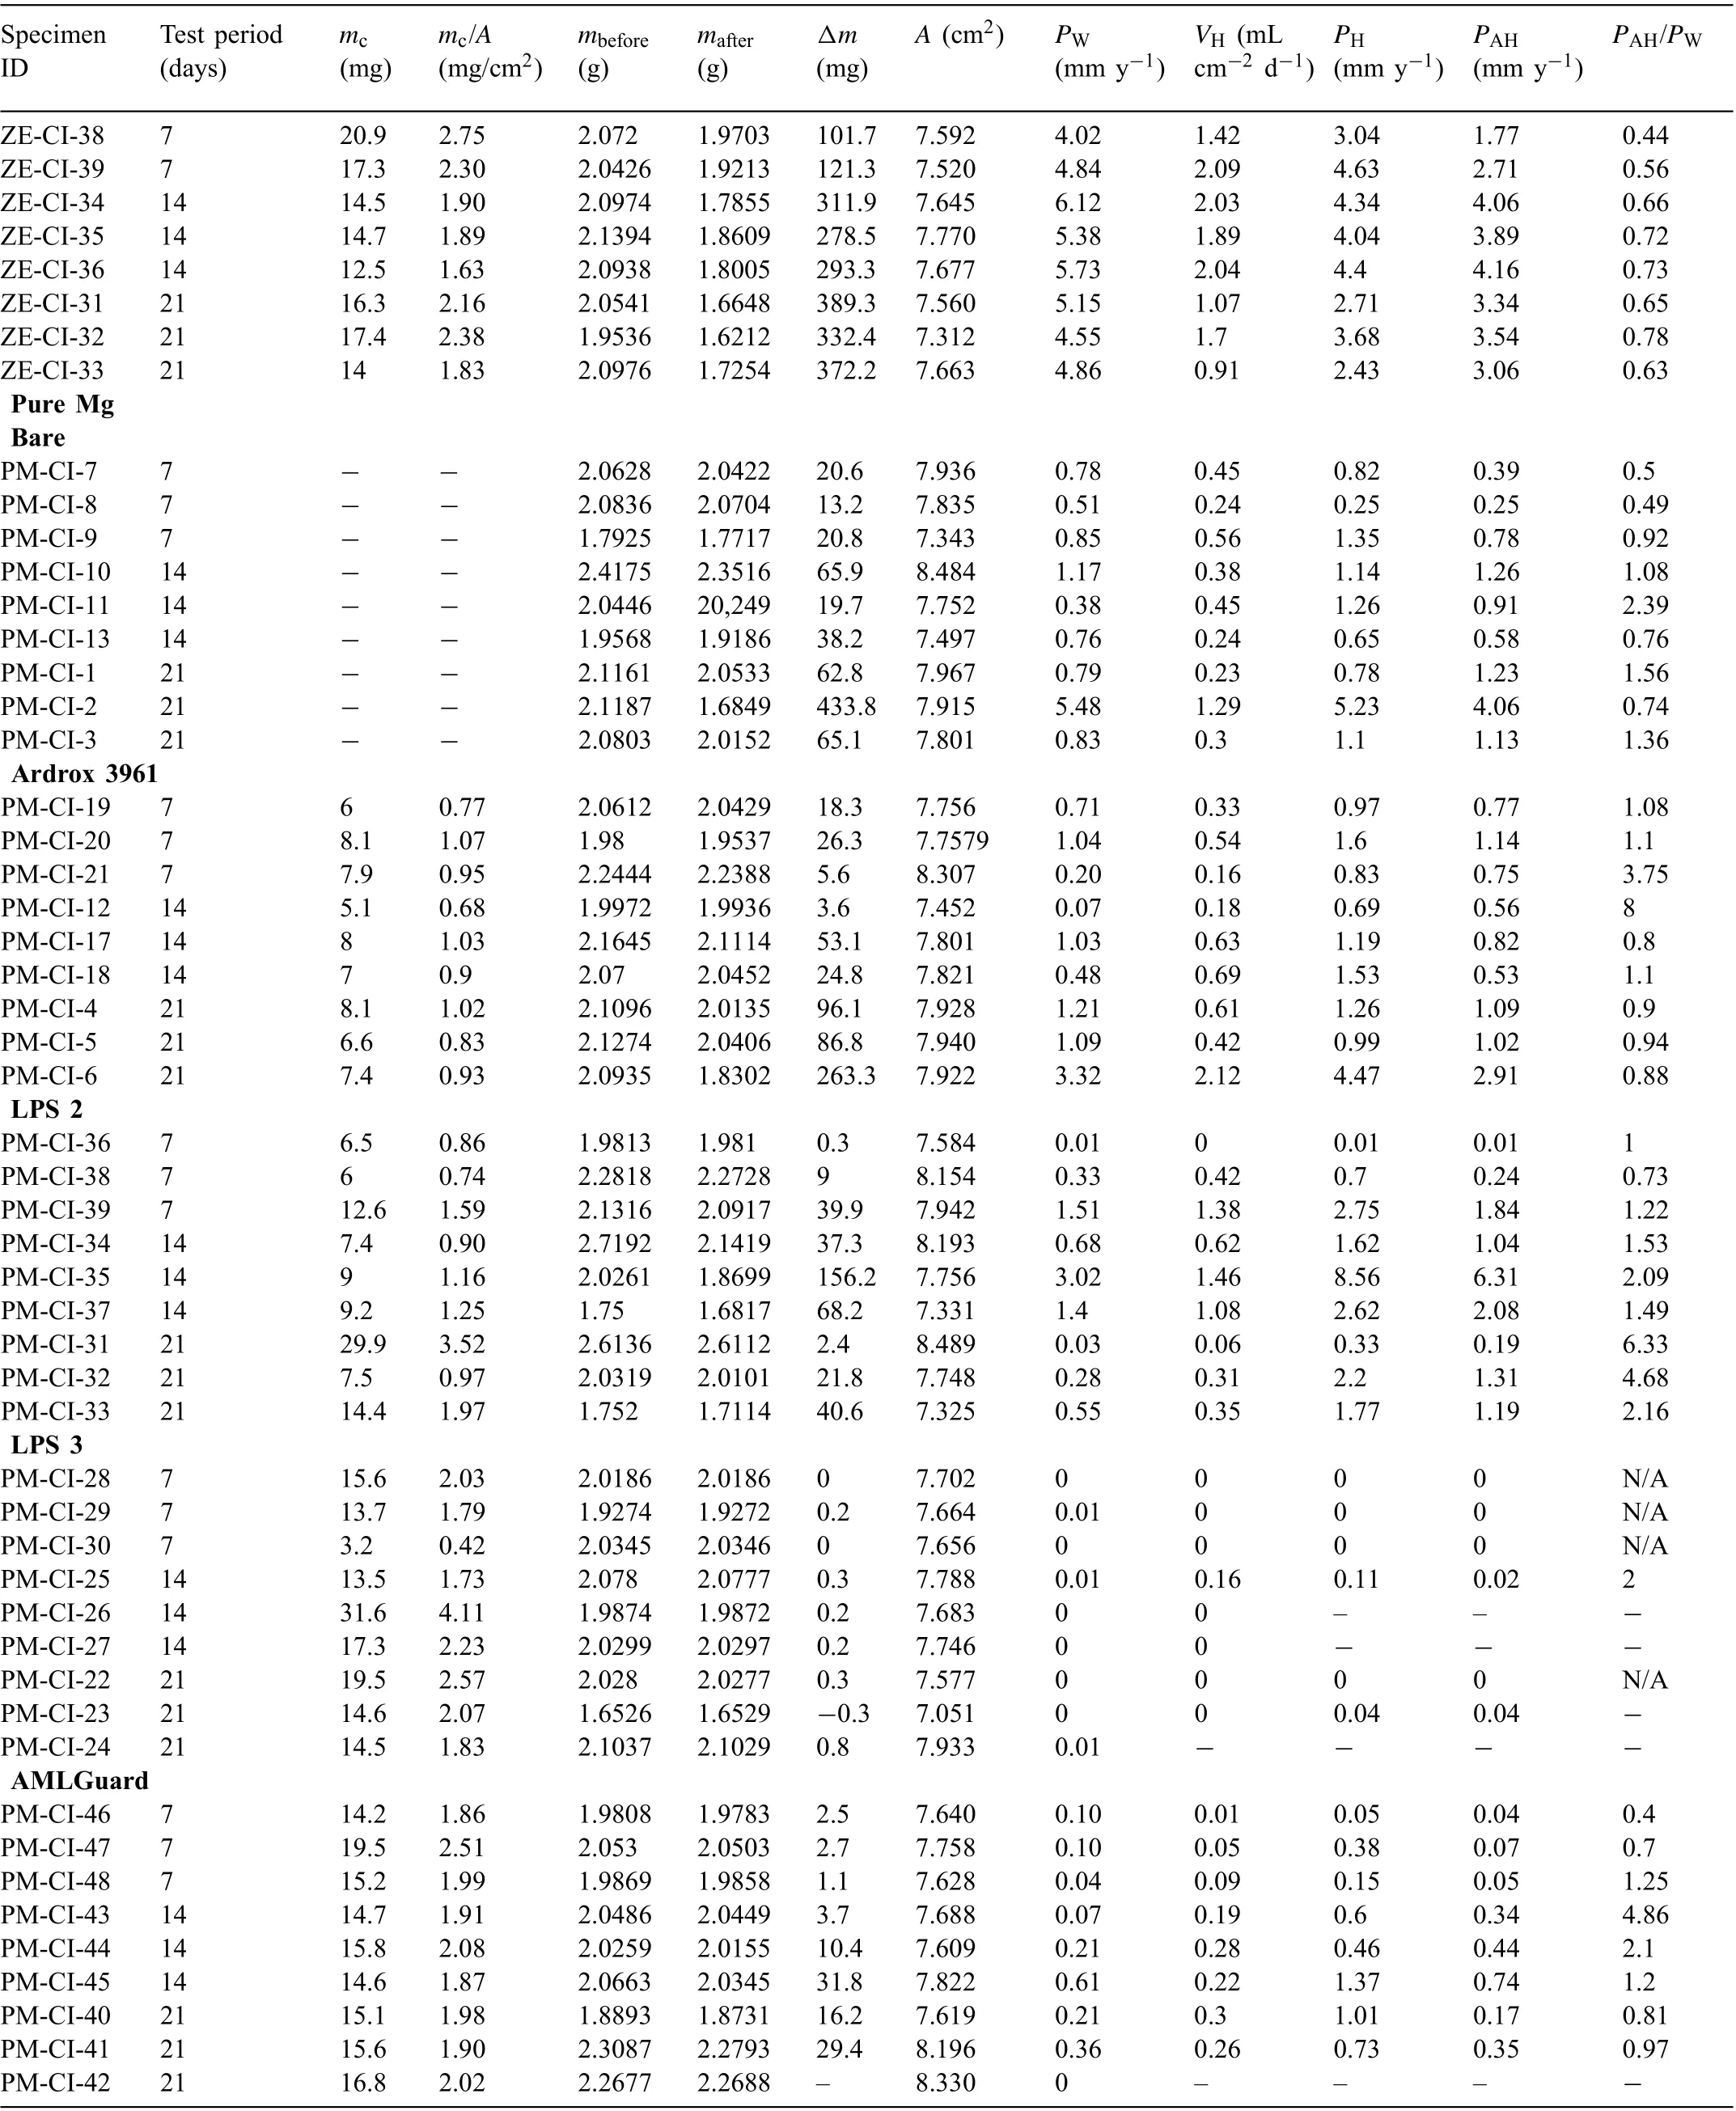
Table A1 (continued)
杂志排行
Journal of Magnesium and Alloys的其它文章
- Mechanism of Mn on inhibiting Fe-caused magnesium corrosion
- An efficien and comparative adsorption of Congo red and Trypan blue dyes on MgO nanoparticles: Kinetics, thermodynamics and isotherm studies
- Twin recrystallization mechanisms in a high strain rate compressed Mg-Zn alloy
- Corrosion behaviour and cytocompatibility of selected binary magnesium-rare earth alloys
- Correlation between test temperature, applied load and wear transition of Mg97Zn1Y2 alloy
- Residual stress and precipitation of Mg-5Zn-3.5Sn-1Mn-0.5Ca-0.5Cu alloy with different quenching rates
