Prognostic and predictive biomarkers for metastatic renal cell carcinoma
2021-05-13LoganBriggsEugeneConeRichardLeeMichaelBlute
Logan G. Briggs, Eugene B. Cone,2, Richard J. Lee,3, Michael L. Blute,2
1Harvard Medical School, Boston, MA 02114, USA.
2Department of Urology, Massachusetts General Hospital, Boston, MA 02114, USA.
3Department of Medicine, Division of Hematology/Oncology, Massachusetts General Hospital, Boston, MA 02114, USA.
Abstract Several prognostic models incorporating serum biomarkers to estimate patient survival have been established for metastatic renal cell carcinoma. Interim advancements in biomarker research have highlighted much additional serum, gene mutation, genetic expression signatures, and histologic biomarkers that predict clinical outcomes and response to treatments. We, therefore, reviewed biomarkers associated with overall, cancer-specific, progressionfree, and disease-free survival, overall response, and time to treatment failure rate in adult populations with metastatic renal cell carcinoma. We reviewed human studies reporting associations between biomarkers and clinical outcomes. Data were abstracted via standardized form, then reported with hazard ratios and confidence intervals where appropriate, subdivided by biomarker type (serum, gene mutation, genetic expression, and histologic). We identified a range of newer biomarkers that have clinical associations with prognostic and predictive outcomes. Beyond biomarkers used in modern risk models, those consistently associated with prognosis included serum levels of CAIX, COP-NLR, CRP, s-TATI, and VEGF, gene mutations in BAP1, CDKN2A, CIMP/FH, and TERT, gene expression of ERV and NQO1, and histologic macrophage infiltration and expression of CAIX and PDL1.Biomarkers consistently associated with the response to targeted antiangiogenic therapy included serum CRP,mutations in MET, PBRM-1, BAP1, and the mTOR pathway, TERT promoter mutations, and expression of PTEN and angiogenic gene signatures. Gene expression of hERV, T-effector, and immunogenic signatures have been associated with improved response to immune checkpoint inhibition. Future models should incorporate wellstudied biomarkers to help clinicians predict outcomes and treatment responses for patients with metastatic renal cell carcinoma.
Keywords: Carcinoma, renal cell, biomarkers, precision medicine, patient-specific modeling, neoplasms
INTRODUCTION
Biomarkers are objective indicators of disease states that can be observed from outside the patient[1]. With advancements in proteomic and genomic analytics, biomarkers hold increasing promise for diseases with variable prognoses or treatment regimens, where they may predict outcomes and inform individualized medicine[2,3]. One such common disease is renal cell carcinoma (RCC), the eighth-most incident cancer in the United States[4], responsible for 430,000 new cases and 180,000 deaths in 2020 worldwide[5]. While the prognosis for localized RCC is favorable, with 5-year survival rates up to 95% after surgical treatment,metastatic RCC (mRCC) is present in up to 16% of new RCC diagnoses and carries a poor prognosis with 5-year survival rates as low as 12%[4,6,7].
Historical treatment of mRCC can be broken into three eras. The initial treatments consisted of immunotherapy with agents such as interferon-alpha or high-dose interleukin-2, which were highly toxic and produced durable complete responses in a very small fraction (< 10%) of patients[8]. Further understanding of RCC cell growth pathways and immunogenicity of RCC led to further development. The second era of mRCC treatment includes targeted therapy such asmTORinhibitors and anti-angiogenic tyrosine kinase inhibitors (TKIs) against vascular endothelial growth factor (VEGF) or the VEGF receptor(VEGFR). Most recently, immunotherapy or immune checkpoint inhibitors (ICIs), which are monoclonal antibodies against immune checkpoint proteins such as programmed cell death 1 (PD-1), PD-ligand 1(PDL1), and anti-cytotoxic T-lymphocyte-associate protein-4 (CTLA-4), have been employed with improved ORR and survival[9].
Prognostic models have been developed and validated to estimate survival in the setting of mRCC. The most widely used models include the Memorial Sloan Kettering Cancer Center (MSKCC), validated by the Cleveland Clinic Foundation (CCF)[10,11], and the International Metastatic RCC Database Consortium(IMDC) Heng model and validation[12,13], which predict poorer prognosis with elevated neutrophils or platelets, lower hemoglobin counts or Karnofsky performance status, and other similar metrics. While these models provide useful survival estimates, there has been rapid advancement in biomarker research predicting more specific clinical outcomes such as overall survival (OS), cancer-specific survival (CSS),progression-free survival (PFS), disease-free survival (DFS), or metastasis. Additional work has explored biomarkers capable of predicting a patient’s overall response rate (ORR) or time to treatment failure (TTF)to a specific regimen.
We reviewed biomarkers associated with OS, CSS, PFS, DFS, TTF, and ORR in adults with metastatic RCC.Data were abstracted via standardized form, then reported with hazard ratios and confidence intervals where appropriate, subdivided by biomarker type (serum, gene mutation, genetic expression, and histologic). For the purposes of our review, we followed the convention of referring to biomarkers that are associated with PFS, DFS, OS, or other broad clinical outcomes independent of treatment received as“prognostic biomarkers”. This contrasts with biomarkers that predict a response (or absence of a response)to a specific treatment, which are referred to as “predictive biomarkers”. Included tables are limited to statistically significant findings, with both significant and non-significant findings found in supplemental materials. A list of abbreviations for included biomarkers can also be found in the supplement.
PROGNOSTIC BIOMARKERS
Serum biomarkers, such as ALP, corrected calcium, Hg, LDH, neutrophil count, and platelets have been extensively validated as prognostic biomarkers for OS and CSS by MSKCC[10], CCF[11], IMDC[12], Groupe Français d'Immunothérapie[14], International Kidney Cancer Working Group[15]and others [Table 1,Supplementary Table 1]. Additional promising serum biomarkers include elevated carbonic anhydrase IX(CAIX) being potentially prognostic of improved PFS and OS[16], while elevated COP-NLR[17], elevated CRP[18], s-TATI[19], and VEGF[15,16,20]may be prognostic for decreased PFS and/or OS[19]. Conflicting or inconclusive evidence exists regarding Ras p21[21], sVEGF-r[16], TIMP-1 mRNA[16,22]. For example, elevated TIMP-1 mRNA has been positively associated with metastasis and OS in one study[22]but negatively associated with OS in another[16].
Among certain patient populations, mutated alleles that may be prognostic for poorer OS or PFS compared to wild type (WT) include loss of function (LOF) mutations or alterations inBAP1[23],CDKN2A[24],CIMP/FH[24], andTERT[23][Table 2, Supplementary Table 2]. Limited evidence has linked tumor mutational burden (TMB) with poor OS and PFS; however, most has shown no significant association[25-30]. The prognostic value ofPBRM-1LOF mutations has proven inconsistent, with some studies reporting longer OS or PFS in patients receiving nivolumab[31,32], but no significant difference in patients receiving everolimus,sunitinib, or combination therapy[27,28,32,33]. Limited evidence also suggests that OS may be longer in patients withPBRM-1LOF mutations and pancreatic metastasis than without[33]. Additionally,PBRM-1LOF mutations have been associated with less immunogenic, more angiogenic tumor microenvironments, which may portend a worse prognosis[33]. The prognostic value ofPBRM-1mutations as a marker of survival may depend on the specific treatment used. Conflicting or inconclusive evidence exists regarding whether mutated alleles inERV[25],mTOR[28], andVHL[28]are prognostic for OS or PFS. Finally,SETD2may be associated with metastatic spread to bone[34].
Expression of single genes and gene expression signatures (GES) may also be prognostic for OS and PFS[Table 2, Supplementary Table 2]. Increased expression of ERV has been shown to be prognostic for improved PFS[35,36], while expression of NQO1 has been associated with shorter OS[24]. Expression of DUX4 GES has not been shown to be prognostic[28]. The prognostic value of GES IMmotion 150 Angio, IMmotion 150 Myeloid, IMmotion 150 Teff, Renal 101 Immuno, and Renal 101 Angio will be discussed separately,along with their predictive value[28,29].
Finally, histologic biomarkers have shown prognostic value [Table 2, Supplementary Table 2]. High levels of CAIX have a demonstrated association with improved DFS (HR = 0.69,P= 0.01), OS (HR = 0.60,P= 0.01),and CSS (HR = 0.69,P= 0.01)[21]; similarly, in a separate study, low levels of CAIX were linked to decreased CSS (HR = 3.10,P< 0.001)[37]. Additionally, given the complex interplay between T-cells and RCC cancer cells, the infiltration of various areas of tumors by CD8+ T-cells has been examined. While higher CD8+ Tcell density in tumor centers and invasive margins has been associated with improved PFS in patients receiving sunitinib, no significant difference was noted amongst patients receiving avelumab plus axitinib[28]. On the other hand, macrophage infiltration has been associated with poorer OS and PFS in patients receiving anti-angiogenic TKI, though the limited study has examined macrophage infiltration and outcomes with other therapies[38].
Overall, we found the strongest consensus for serum levels of CAIX[16], COP-NLR[17], CRP[18], s-TATI[19], and VEGF[15,16,20], gene mutations inBAP1[23],CDKN2A[24],CIMP/FH[24], andTERT[23], gene expression of ERV[35,36], and NQO1[24], and histologic expression of CAIX[21,37]and macrophage infiltration[38]as prognostic biomarkers for OS and PFS. Tables 1 and 2, Supplementary Tables 1 and 2 list all identified data depictingthe prognostic value of these biomarkers in predicting PFS, OS, and CSS.

Table 1. Serum prognostic biomarkers

Table 2. Gene mutation, gene expression, and histologic prognostic biomarkers
PREDICTIVE BIOMARKERS
Biomarkers predictive of ORR or TTF are limited. Low hemoglobin and high neutrophils have been associated with reduced TTF in patients on cytokine therapy[14]. In the more contemporary era of targeted therapy, elevated CRP andMETmutations have been associated with improved response to anti-VEGFR therapy[18,39].PBRM-1mutations and lack ofBAP1mutations have been associated with improved response to anti-VEGF therapy[23]. Mutations in themTORpathway (TSC1,TSC2,MTOR) and expression of PTEN have been associated with improved response to mTOR inhibitors[40-42].
More relevant to the era of checkpoint inhibitors,TERTpromoter mutations may be predictive of resistance to ICI, as one study foundTERTpromoter mutations to be enriched in patients experiencing no clinical benefit in the ICI cohort[43]. High expression of hERV has been associated with improved response to ICI and nivolumab[35,36]. High expression of a 5-Gene panel (FOXP3, CCR4, KLRK1, ITK, and TIGIT) has been associated with improved response to ICI[44].PBRM-1LOF mutations have been associated with longer OS and PFS and increased ORR in patients receiving nivolumab monotherapy[25,31-33], but no significant difference in OS or PFS in patients receiving everolimus, sunitinib, or combination therapy[27,28,32,33].However, these findings are not universally consistent asPBRM-1mutations have also been associated with decreased ORR in patients receiving atezolumab monotherapy[33]and improved TTF in patients receiving anti-VEGF therapy[23]. TMB has not been associated with differential ORR to ICI, nivolumab, or everolimus[25,26,45,46].
Overall, CRP and mutations inMET,PBRM-1, andBAP1be associated with improved response to TKIs[18,23,39], while mutations in themTORpathway and expression of PTEN may be associated with improved response to mTOR inhibitors[40-42].TERTpromoter mutations, hERV expression, and T-effector expression may be associated with improved response to ICI[35,36,43,44]. Table 3 and Supplementary Table 3 list all identified data depicting the value of these biomarkers in predicting response to various treatments.
SELECT GENE EXPRESSION SIGNATURES AS PROGNOSTIC AND PREDICTIVE BIOMARKERS
Aberrantly upregulated VEGF pathways cause angiogenesis necessary for continued tumor growth, while PDL1 expression by tumor and tumor-infiltrating cells suppresses the immune response to the tumor. As these two aspects of the mRCC disease state have been increasingly well-defined, a number of GES reflective of angiogenic and immunogenic pathways have been evaluated for their prognostic and predictive implications across multiple large databases of patients with mRCC. In 2019, McDermottet al.[29]defined three such GES in an analysis of the IMmotion 150 cohort that included genetic expression related to angiogenesis (coined, “IMmotion 150 Angio”, including expression of VEGFA, KDR, ESM1, PECAM1,ANGPTL4, CD34), myeloid inflammation (coined “IMmotion 150 Myeloid”, including IL-6, CXCL1,CXCL2, CXCL3, CXCL8, and PTGS2), and immune activation including effector T-cell (Teff) presence and function, IFN-γ response, checkpoint inhibitors, and antigen presentation (coined “IMmotion 150 Teff”,including CD8A, EOMES, PRF1, IFNG, and CD274). Similarly, in 2020, Motzeret al.[28]defined two GES in an analysis of the JAVELIN Renal 101 cohort that analyzed the expression of 26 genes each, coined “Renal 101 Immuno” (most similar to IMmotion 150 Teff) and “Renal 101 Angio”. The extent to which high expressionvs.low expression (as defined by gene expression ≥ or < median) of these five GES is associated with OS, PFS, or ORR has been examined across the IMmotion 150 and 151 cohorts, the JAVELIN phase 1 and RENAL 100 and 101 cohorts, and the CheckMate 214 cohort as depicted in Table 4 and Supplementary Table 4.
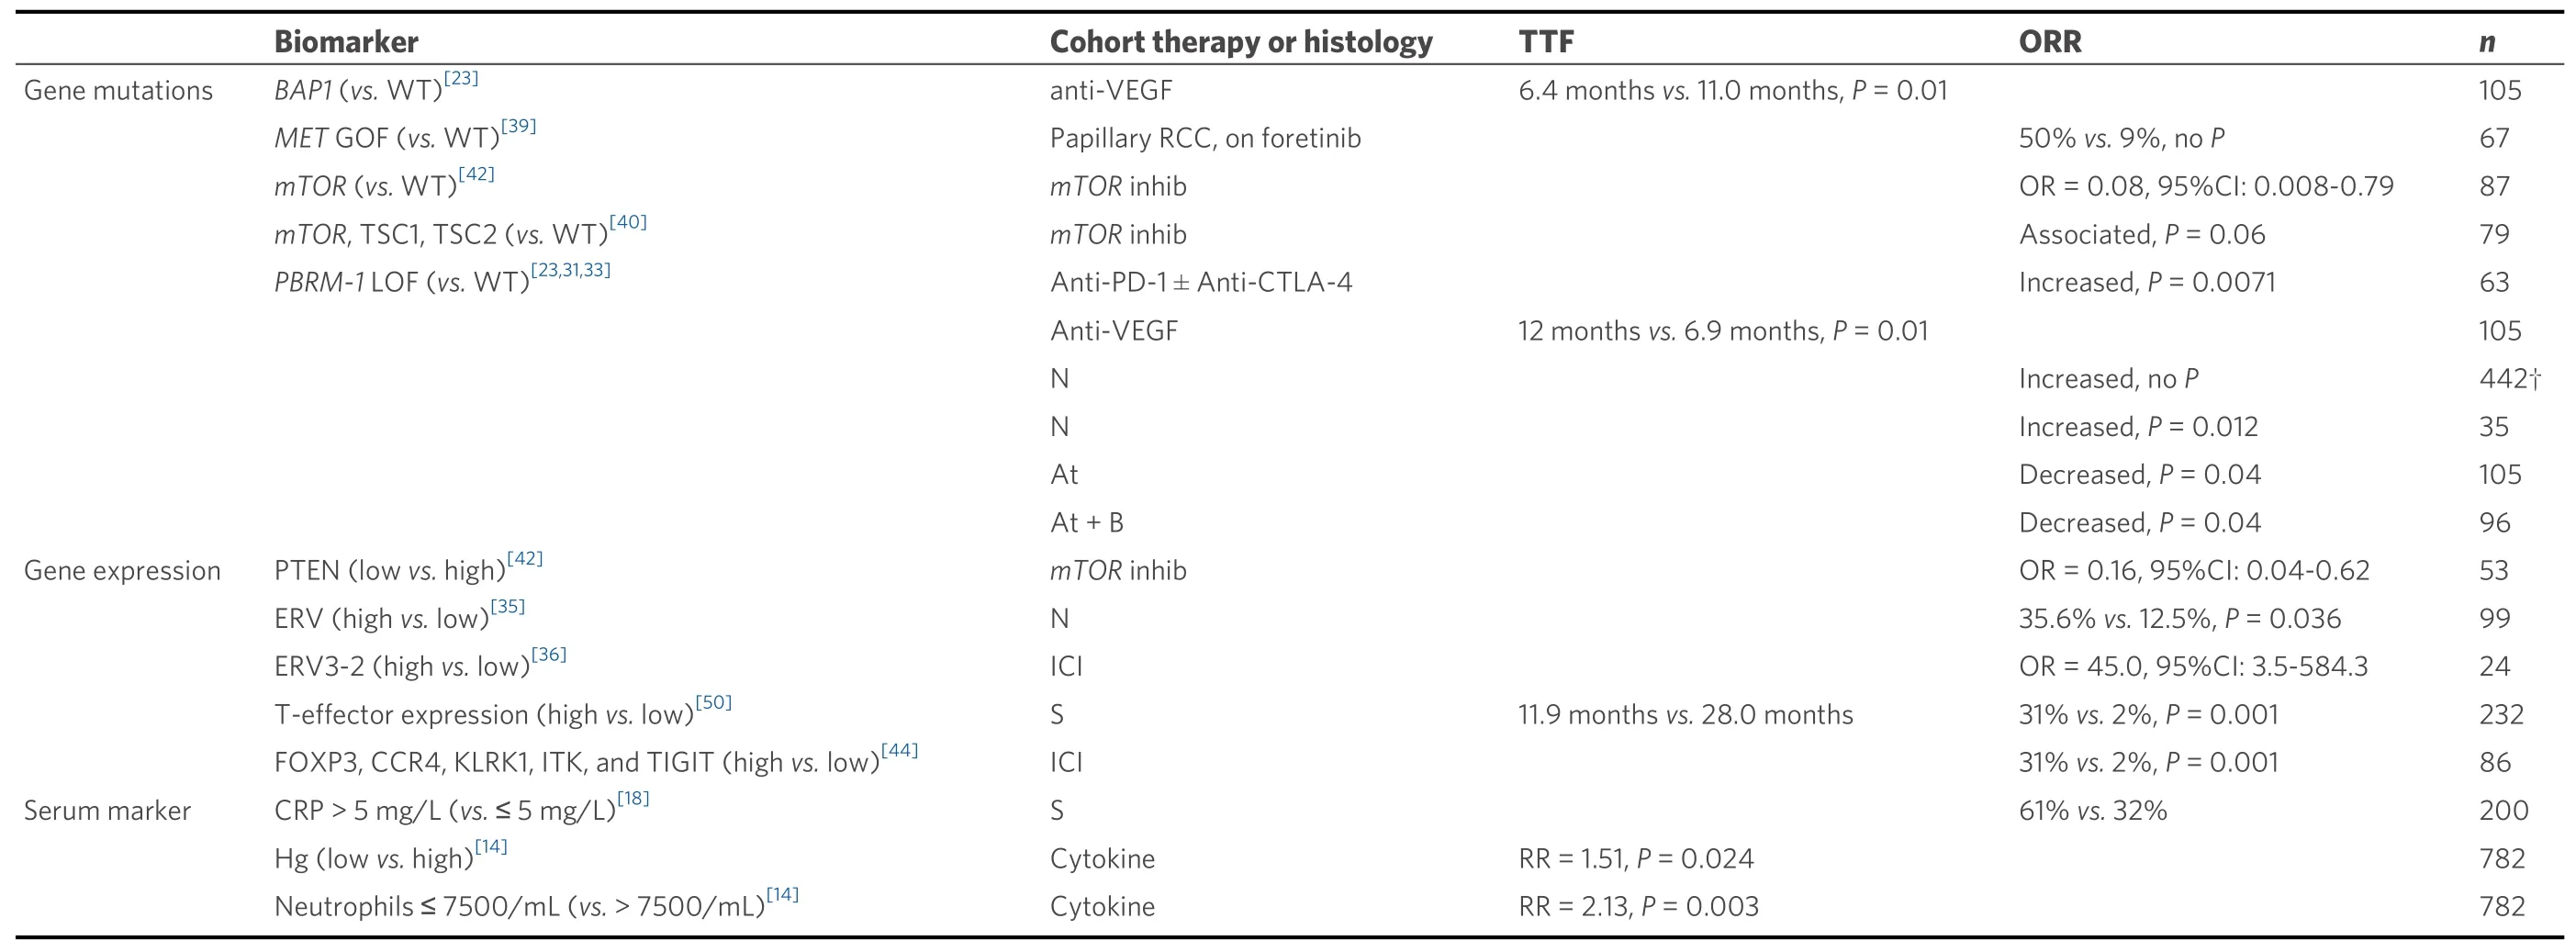
Table 3. Predictive biomarkers

Table 4. Select gene expression signatures as predictive and prognostic biomarkers
Examining cancer angiogenesis, highvs.low expression of both the IMmotion 150 Angio and the JAVELIN Renal 101 Angio GES have been associated with improved PFS and ORR in patients receiving sunitinib[27,29,47]. However, in patients receiving combination nivolumab + ipilimumab therapy, those with high expression of IMmotion 150 Angio demonstrated decreased ORR[27], and in patients with low IMmotion 150 Angio receiving combination atezolumab + bevacizumabvs.sunitinib, decreased PFS has been shown[29]. Furthermore, high IMmotion 150 Angio GES has been associated with favorable (vs.intermediate/poor) risk[47]. Finally, Beuselincket al.[48]established an angiogenic GES that has been associated with improved ORR to anti-angiogenic therapy across three cohorts[38]. Thus, while these angiogenic GES may predict improved response to targeted anti-angiogenic therapy compared with ICI orcombination therapy, the application of this signature may be less relevant to contemporary practice since first-line systemic therapies are often combination ICI therapy (ipilimumab with nivolumab) or combinations of TKI with ICI.
Related to immune response and inflammation, high IMmotion 150 Myeloid has been associated with poorer PFS in patients receiving atezolumab or atezolumab + bevacizumab, but not sunitinib, nivolumab + ipilimumab, or avelumab + axitinib[27-29]. High IMmotion 150 Myeloid is associated with worse PFS in patients receiving atezolumabvs.sunitinib, but not atezolumab + bevacizumabvs.sunitinib[28,29]. High IMmotion 150 Teff has been associated with improved PFS and ORR in patients receiving atezolumab + bevacizumab but not sunitinib, atezolumab, nivolumab + ipilimumab, or avelumab + axitinib[27-29]. High IMmotion 150 Teff is associated with intermediate/poor (vs.favorable) risk[47], and with improved PFS in patients receiving atezolumabvs.bevacizumab, butnot atezolumabvs.sunitinib[29,47]. High expression of JAVELIN Renal 101 Immuno, which consists of similar genes to IMmotion 150 Teff, is associated with improved PFS in patients receiving avelumab or avelumab + axitinib, but not sunitinib[28]. To further elucidate the prognostic and predictive value of immune response and inflammation, McDermottet al.[29]performed a combined analysis of high and low IMmotion 150 Myeloid and Teff[28]. Within the Myeloidhigh,Teffhigh, subgroup, improved PFS was observed among those receiving atezolumab + bevacizumabvs.atezolumab alone (HR = 0.25, 95%CI: 0.01-0.60), but not among the Myeloidlow, Teffhighsubgroup[29]. This may suggest that combination (targeted + ICI) therapy to ICI may improve treatment response in this Myeloidhigh, Teffhighsubgroup over ICI monotherapy. Notably, Motzeret al.[28]found no difference in PFS between patients with IMmotion 150 Myeloidhigh,
Teffhighvs.Myeloidlow, TeffhighGES in the JAVELIN Renal 101 cohort in either the avelumab + axitinib arm, or the sunitinib monotherapy arm, suggesting that the Myeloidhigh, Teffhighsubgroup may be most resistant to ICI monotherapy rather than targeted monotherapy.
While the prognostic and predictive value of these GES requires further validation, we found the strongest consensus for angiogenic GES (IMmotion 150 Angio, JAVELIN Renal 101 Angio) as biomarkers predictive of improved response to sunitinib and for immunogenic GES (IMmotion 150 Teff, JAVELIN Renal 101 Immuno) as biomarkers predictive of improved response to ICI therapy. Additionally, myeloid inflammation GES (IMmotion Teff, Myeloid) may predict improved response to combination anti-VEGF +ICI therapyvs.ICI therapy alone. Table 4 and Supplementary Table 4 list all GES biomarkers associated with predictive or prognostic outcomes.
PDL1 STATUS AS A PROGNOSTIC AND PREDICTIVE BIOMARKER
As the principal biologic target of many of the ICIs, the expression of PDL1 on renal tumor cells has received significant attention as a potential prognostic and predictive biomarker. Prognostically, a metaanalysis in 2020 reported that PDL1 expression of tumor cells was positively associated with both OS (HR =1.98, 95%CI: 1.22-3.22) and DFS (HR = 3.70, 95%CI: 2.07-6.62)[49]. These findings are notable because tumors with high expression of PDL1 have been previously shown to demonstrate aggressive behavior[50-58].The improved OS in PDL1-expressing tumors in the era of ICIs possibly occurs because PDL1 expression may also predict tumor response to immunotherapy.
A recent 2020 meta-analysis included 4635 patients across six randomized controlled trials (RCTs)published before May 2018 with available PDL1 expression data and compared ICIvs.standard of care therapy (SOC). Regardless of PDL1 expression level, ICI therapy improved both PFS and OS compared to SOC. However, in PDL1 positive patients receiving ICI, PFS was improvedvs.SOC (HR = 0.75, 95%CI:0.63-0.89,P< 0.0001) but OS was not (HR = 0.72, CI: 0.63-0.81,P= 0.63). Since this meta-analysis, two of the included RCTs have published longer-term follow-up data on the effect of PDL1 status on response to ICI without significant change to earlier-published data. Furthermore, other studies assessing response to ICI based on PDL1 status report both significant [Table 5] and non-significant [Supplementary Table 5]associations between differential PDL1 expression and PFS and OS.
Overall, we found the strongest consensus for PDL1 as a prognostic biomarker for OS and PFS. Notably,PDL1 expression is dynamic. Therefore, the assessed tissues (primary tumorvs.metastasis) and timing of tissue acquisition (especially if primary tumor resection occurs long before evidence of metastasis) may impact PDL1 expression, and therefore the accuracy of assessment as a biomarker. Table 5 and Supplementary Table 5 listed all identified data depicting the values of PDL1 as a prognostic or predictive biomarker associated with PFS, OS, or CSS.
CONCLUSION
We reviewed the serum, gene mutation, genetic expression, and histologic biomarkers that predict response to treatment and prognosticate clinical outcomes. Current survival models may be improved by incorporation of newly proven biomarkers, allowing providers to give more accurate and individualized prognosis to patients. Future predictive models may be built to allow oncologists to prescribe the most effective treatment regimens for an individual patient’s tumor and biologic profile. It is clear that patients with mRCC will benefit from continued measurement of biomarkers in large clinical trials assessing clinical responses to various treatment regimens in patients with mRCC, and their incorporation into increasingly personalized predictive tools.
DECLARATIONS
Authors’ contributions
Contributed to conceptualization: Blute ML
Contributed to supervision: Blute ML
Contributed to writing - review and editing: Blute ML, Lee RJ, Cone EB, Briggs LG
Contributed to methodology supervision: Cone EB
Contributed to methodology, data curation, writing - original draft: Briggs LG
Availability of data and materials
Not applicable.
Financial support and sponsorship
None.
Conflicts of interest
Lee RJ: Astellas, Bayer, Dendreon, Exelixis, GE Heathcare, Janssen (advisory board); Janssen (research funding).
Ethical approval and consent to participate
Not applicable.
Consent for publication
Not applicable.
Copyright
© The Author(s) 2021.
杂志排行

Journal of Cancer Metastasis and Treatment的其它文章
- Recent advances in the frontline treatment of metastatic renal cell carcinoma
- First molecular cytogenetic characterisation of tracheal squamous cell carcinoma cell line KLN 205
- Bone marrow niches in myelodysplastic syndromes
- Current and emerging therapies for first line treatment of metastatic clear cell renal cell carcinoma
- AUTHOR INSTRUCTIONS