A scanning distortion correction method based ongalvanometer Lidar system∗
2021-05-06BaoLingQi漆保凌ChunHuiWang王春晖DongBingGuo郭东兵andBinZhang张斌
Bao-Ling Qi(漆保凌), Chun-Hui Wang(王春晖), Dong-Bing Guo(郭东兵), and Bin Zhang(张斌)
Key Laboratory of Tunable Laser Technology,Harbin Institute of Technology,Harbin 150001,China
Keywords: Lidar,laser scanning,optical vector model,image scanning
1. Introduction
With the development of Lidar scanning technology and its wide use in military,[1]aerospace,[2]civil as well as other fields,[3,4]it has great practical significance to investigate the key technology of Lidar scanning system.[5]Lidar is a laser beam as a new detection signal active modern optical remote sensing system,[6]compared with the traditional radar operating frequency band,optical band of shorter wavelengths, which can greatly improve the radar distance resolution, angular resolution, velocity resolution,[7]and thanks to the laser’s high directionality, high monochromatic, and high coherence, have the advantage of achieving high accuracy,anti-interference ability,and small volume.[8,9]
Lidar scanning technology is an important development direction in the laser radar application market,[10]and X–Y galvanometer scanning technology has the advantages of small moment of inertia, fast response, small size, highprecision real-time drive control, and non-contact.[11]It can meet the requirements of the laser radar scanning system for the scanner.[12]Li et al.[13]presented a method for correcting distortion to achieve the effect of correcting distortion.Hayakawa et al.[14]proposed a laser beam pointing method that allows for simultaneous control of position and angle using two galvanometer mirrors. Delgado et al.[15]presented a coaxially coupled vision device and a self-designed calibration plate for scanning distortions but it makes the equipment more complicated. In the actual system, the compensation item is not considered, and the scanning working distance is too short, which has limitations. The scanning distortion of the galvanometer system seriously affects the accuracy of laser scanning and brings difficulties to analysis and application.[16]Such distortions are usually processed by optical hardware compensation and circuit calibration methods,which are affected by the accuracy of device processing and increased hardware costs,[17]and it is easy to introduce new error noises,further reducing the scanning performance of the entire system.[18,19]
In the present study,based on the X–Y galvanometer Lidar scanning system, a distortion correction algorithm with controllable drive voltage compensation is proposed. The algorithm uses voltage control and introduces angle compensation to correct the distortion trajectory. The geometric optical vector model is established to prove the pincushion distortion of the galvanometer scanning system, and the linear relationship between the scanning angle and the driving voltage is verified. The simulation experiment verifies the performance of our algorithm. In the actual experiment,the proposed method can obtain a scanned image without distortion, and the proposed algorithm has further application potential.
2. Lidar scanning system with X–Y galvanometer
The geometrical optics model and coordinate system of the laser scanning system based on X–Y galvanometer are shown in Fig.1. Where q is the unit normal vector of the scanning surface, the rotation center of the X coordinate galvanometer (vibration mirror X, VMX) is O1, the unit normal vector of the galvanometer plane is N1, and the Y coordinate galvanometer(vibration mirror Y,VMY)is the rotation center is O2,and the unit normal vector of the galvanometer plane is N2.The laser beam is incident along the X axis and reflected to VMY through VMX,and then the target is scanned. The echo signal generated by the reflected target will be traced back to the detector through VMX and VMY.
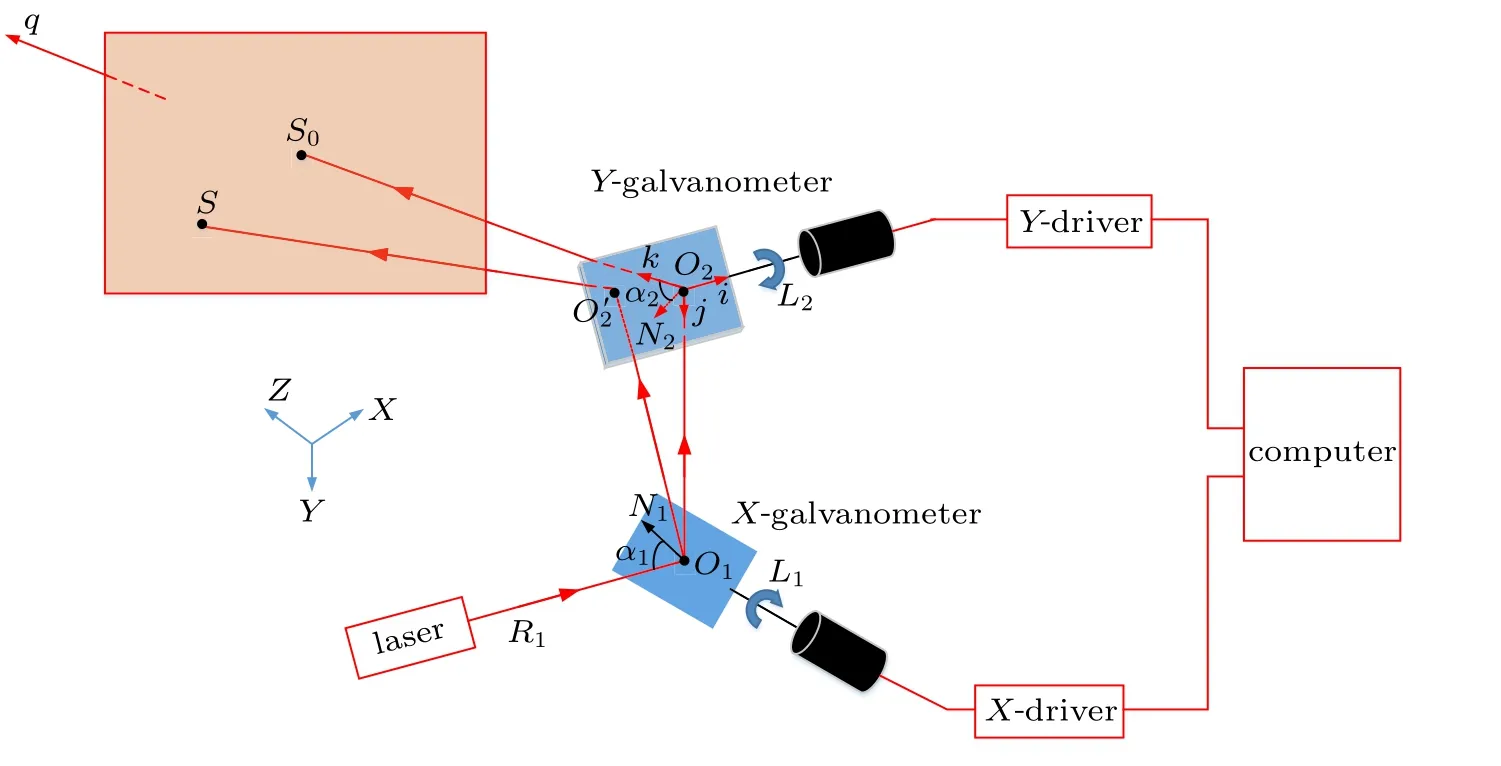
Fig.1. Geometrical optics model of X–Y galvanometer laser scanning system.
2.1. Geometrical optics vector model

The geometric light is expressed in vector form is
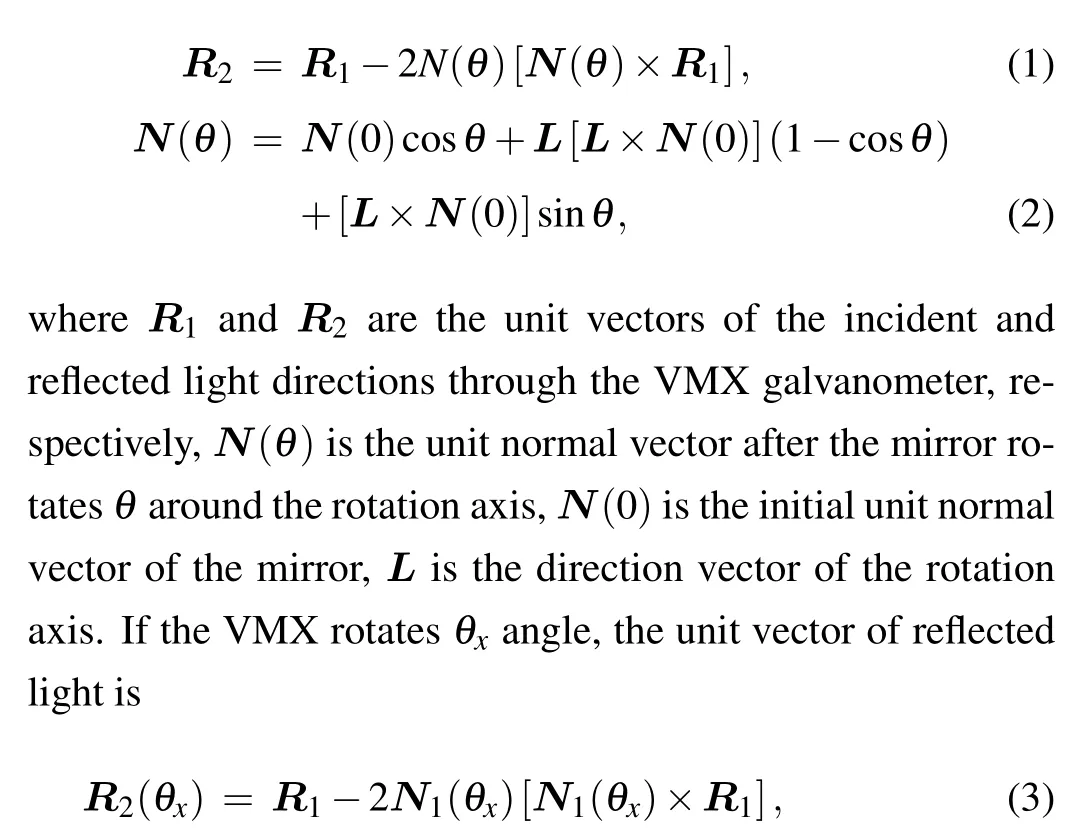


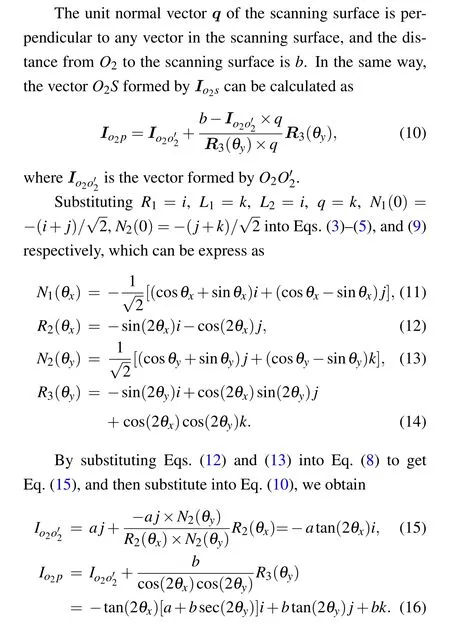
The coordinate equation of the scanning track point on the scanning surface can be obtained as

2.2. Scanning trajectory simulation and experiment
The center distance of the X–Y galvanometer is a =1.5 cm, the vertical distance between the VMY and XOY planes is b=24 m,the scanning frequencies of the VMX and VMY galvanometers are 100 Hz and 1 Hz respectively, and the total number of scanning points per frame is 4000. Figure 2 shows the simulation results of the scanning trajectory.In order to investigate the magnitude of the distortion more intuitively and furtherly verify the correctness of the theory and simulation results, the corresponding curves are drawn in the X–Y coordinates,as shown in Fig.3.
The curve corresponding to the simulation result and the actual value is shown in Fig.3,it can be seen that there is obvious pincushion distortion between the scan value and the actual value. A two-dimensional X–Y galvanometer Lidar scanning system is established. As shown in Fig.4(a), the experimental phenomenon is observed through a red laser without correction algorithm and the scanning trajectory is obtained as shown in Fig.4(b).

Fig.2. The simulation results of X–Y galvanometer scanning trajectory.
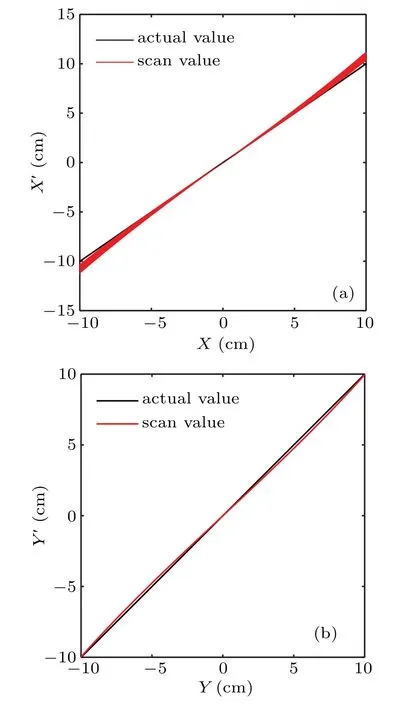
Fig.3. Correspondence between scan and actual values: (a)x scan and actual values,(b)y scan and actual values.
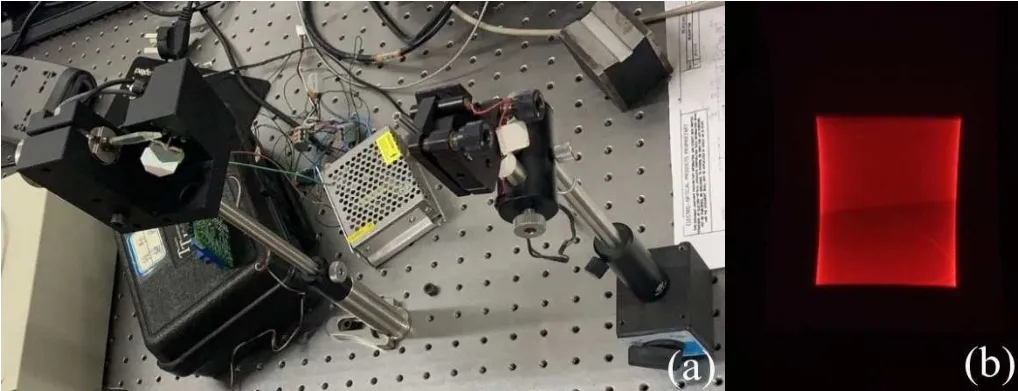
Fig.4. Experimental device and experimental phenomena: (a) Twodimensional X–Y galvanometer Lidar scanning devices, (b) scanning distortion diagram.
Figure 4(b) shows the experimental results that the scan result before distortion correction does have pincushion distortion, it is apparent that the scan experiment further proves the consistency between theory and simulation.
3. The relationship between driving voltage and scanning angle
In the Lidar galvanometer scanning system,the control of the scanning angle is realized by changing the voltage.The relationship between the scanning angle of the galvanometer and the driving voltage is shown in Fig.5, the distance between the galvanometer and the scanning screen is L. When the galvanometer is scanning in a one-dimensional direction,a bright line with uniform brightness can be seen on the observation screen. The length of this bright line is 2d by measuring, the scanning angle is 2θ, and then the light length and scanning angle can be calculated as

The distance between the screen and the scanning galvanometer of L = 72.5 cm, by varying the driving voltage value to a different length of the bright line 2d. Based on Eqs.(18)and(19)can be obtained the scanning angle in different X-axis and Y-axis directions,as a result in Table 1.
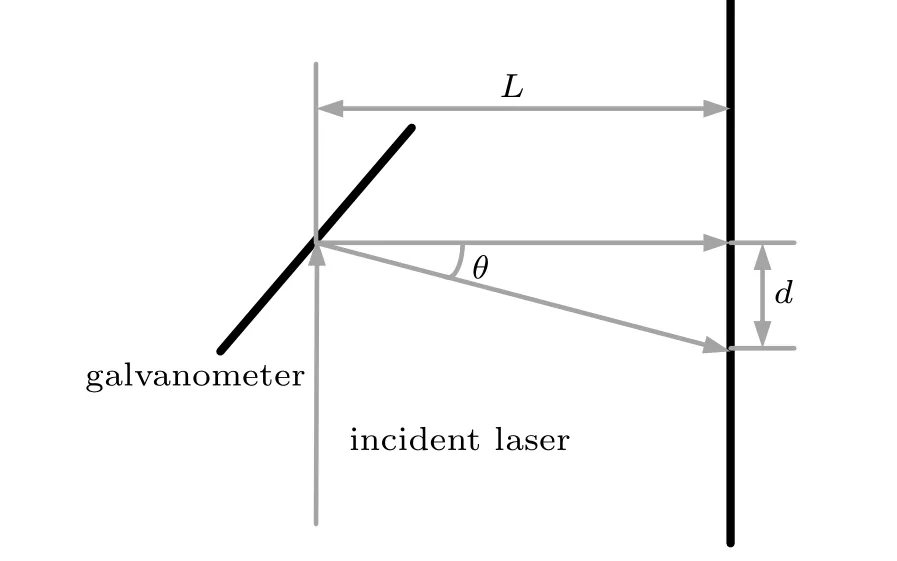
Fig.5. Diagram of driving voltage and scanning angle.

Table 1. Driving voltage and a scan angle of the scan axis.
According to the data in Table 1,the relationship between the driving voltage and the scanning angle of the X axis and Y axis is further obtained,as shown in Fig.6.
Figures 6(a) and 6(b) can be intuitively concluded that the voltage and the scanning angle are close to a linear relationship. Therefore, the scanning angle of the galvanometer can be controlled by adjusting the driving voltage.
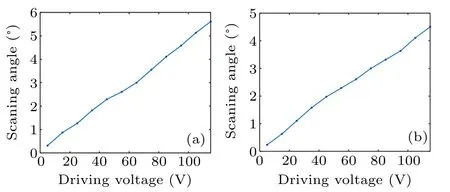
Fig.6. Driving voltage and scan angle relationship: (a)X-axis drive voltage and scan angle relationship curve, (b) Y-axis drive voltage and scan angle relationship curve.
4. The distortion correction method
From the scan point trajectory coordinate Eq.(17),it can be written as

It can be seen that θyis the main factor causing the nonlinear distortion of(x,y)relative to(θx,θy). Through the verification of the third part,there is a linear relationship between the driving voltage and the scan angle, then the pincushion distortion can be corrected by correcting the control voltage.Assuming that the output (x,y) coordinates are undistorted,the variety track of (θx,θy) is obtained to correct the control voltage. From Eqs.(17)and(20)we can get
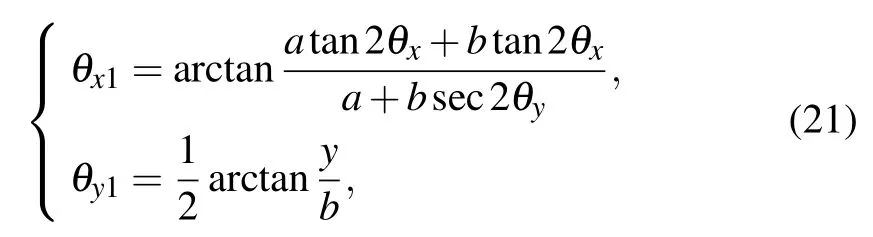
where θx1and θy1are the corrected scanning angles of the X–Y galvanometer,so that the point cloud trajectory of the scanning angle (θx,θy) with X–Y galvanometer after trajectory distortion correction can be obtained,as shown in Fig.7.
The corresponding relationship between the driving voltage of the X–Y galvanometer and the scanning angle can be approximately linear. We set m and n to represent the voltage applied to the X-axis and Y-axis galvanometers after correction, besides m0and n0are the control voltages of the X axis and Y axis before correction respectively. The corresponding relationship i s

Therefore, the output of m and n after the correction of the driving voltage for the X–Y galvanometer can be obtained,as shown in Fig.8.

Fig.7. Scanning angle after correction.

Fig.8. Output trace of driving voltage after correction.

Fig.9. Scan trajectory after correction.
The change of the driving voltage eventually leads to the change of the scanning trajectory of the X–Y galvanometer,thereby completing the correction of the pincushion distortion.The compensation correction result is shown in Fig.9,xx and yy are the scanning trajectory in the X and Y directions respectively. The results revealing a good correction effect for pincushion distortion.
5. Simulation and experiment
At different distances between the galvanometer and the scanning screen, our method and the literature algorithm,[13]are compared with the real trajectory respectively,then calculated the RMSE between the X-axis scan coordinate and the actual value,as shown in Table 2.
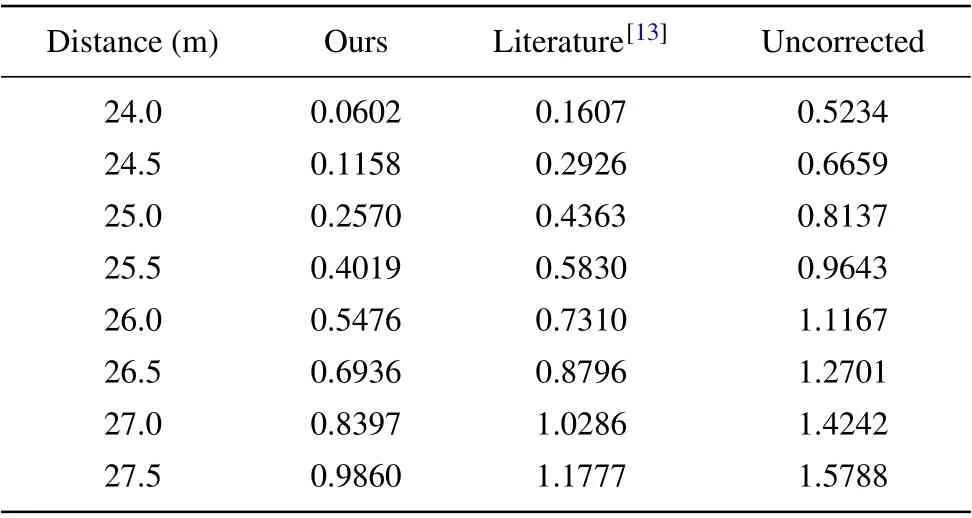
Table 2. The RMSE between the sweep value and the actual value at different distances.
From the data in Table 2,when the distance is 24 m,25 m,it can be seen that the RMSE value of our algorithm is close to half of the algorithm,[13]the error with the actual value is smaller. And the fitting curve of the actual value and the scan value under multiple simulation analysis is recorded as shown in Fig.10.
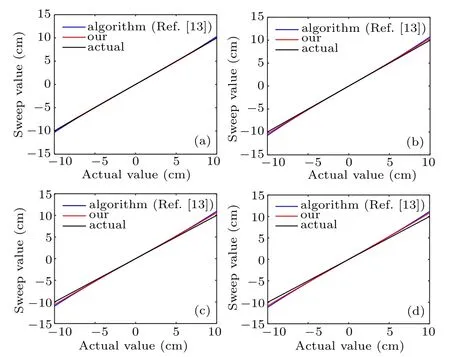
Fig.10. Error fitting curve graph at different distances: (a) b=24 m, (b)b=25 m,(c)b=26 m,(d)b=27 m.
As shown in Fig.10, it can be seen that our method is closer to the actual value than the algorithm.[13]The error curve has the characteristics that the error value is large at both ends and small in the middle,which is consistent with our previous derivation theory,and our method can also achieve good results in scanning the two ends of the graph.
By building a Lidar scanning system,our method can get the scanning results of targets at different distances in the real environment.
Figure 11(a)shows the two-dimensional point cloud image without the algorithm correction, and the result after the algorithm distortion correction in the present paper is shown in Fig.11(b).
As shown in Fig.11,the algorithm in this paper can well correct the distortion of the two-dimensional target. Further,we combine the algorithm in this paper with the Lidar system to apply the three-dimensional scanning system. In Fig.12,the propose method can obtain undistorted three-dimensional scanning point cloud.

Fig.11. Diagram of two-dimensional scans:(a)before compensation correction(b)after compensation correction.
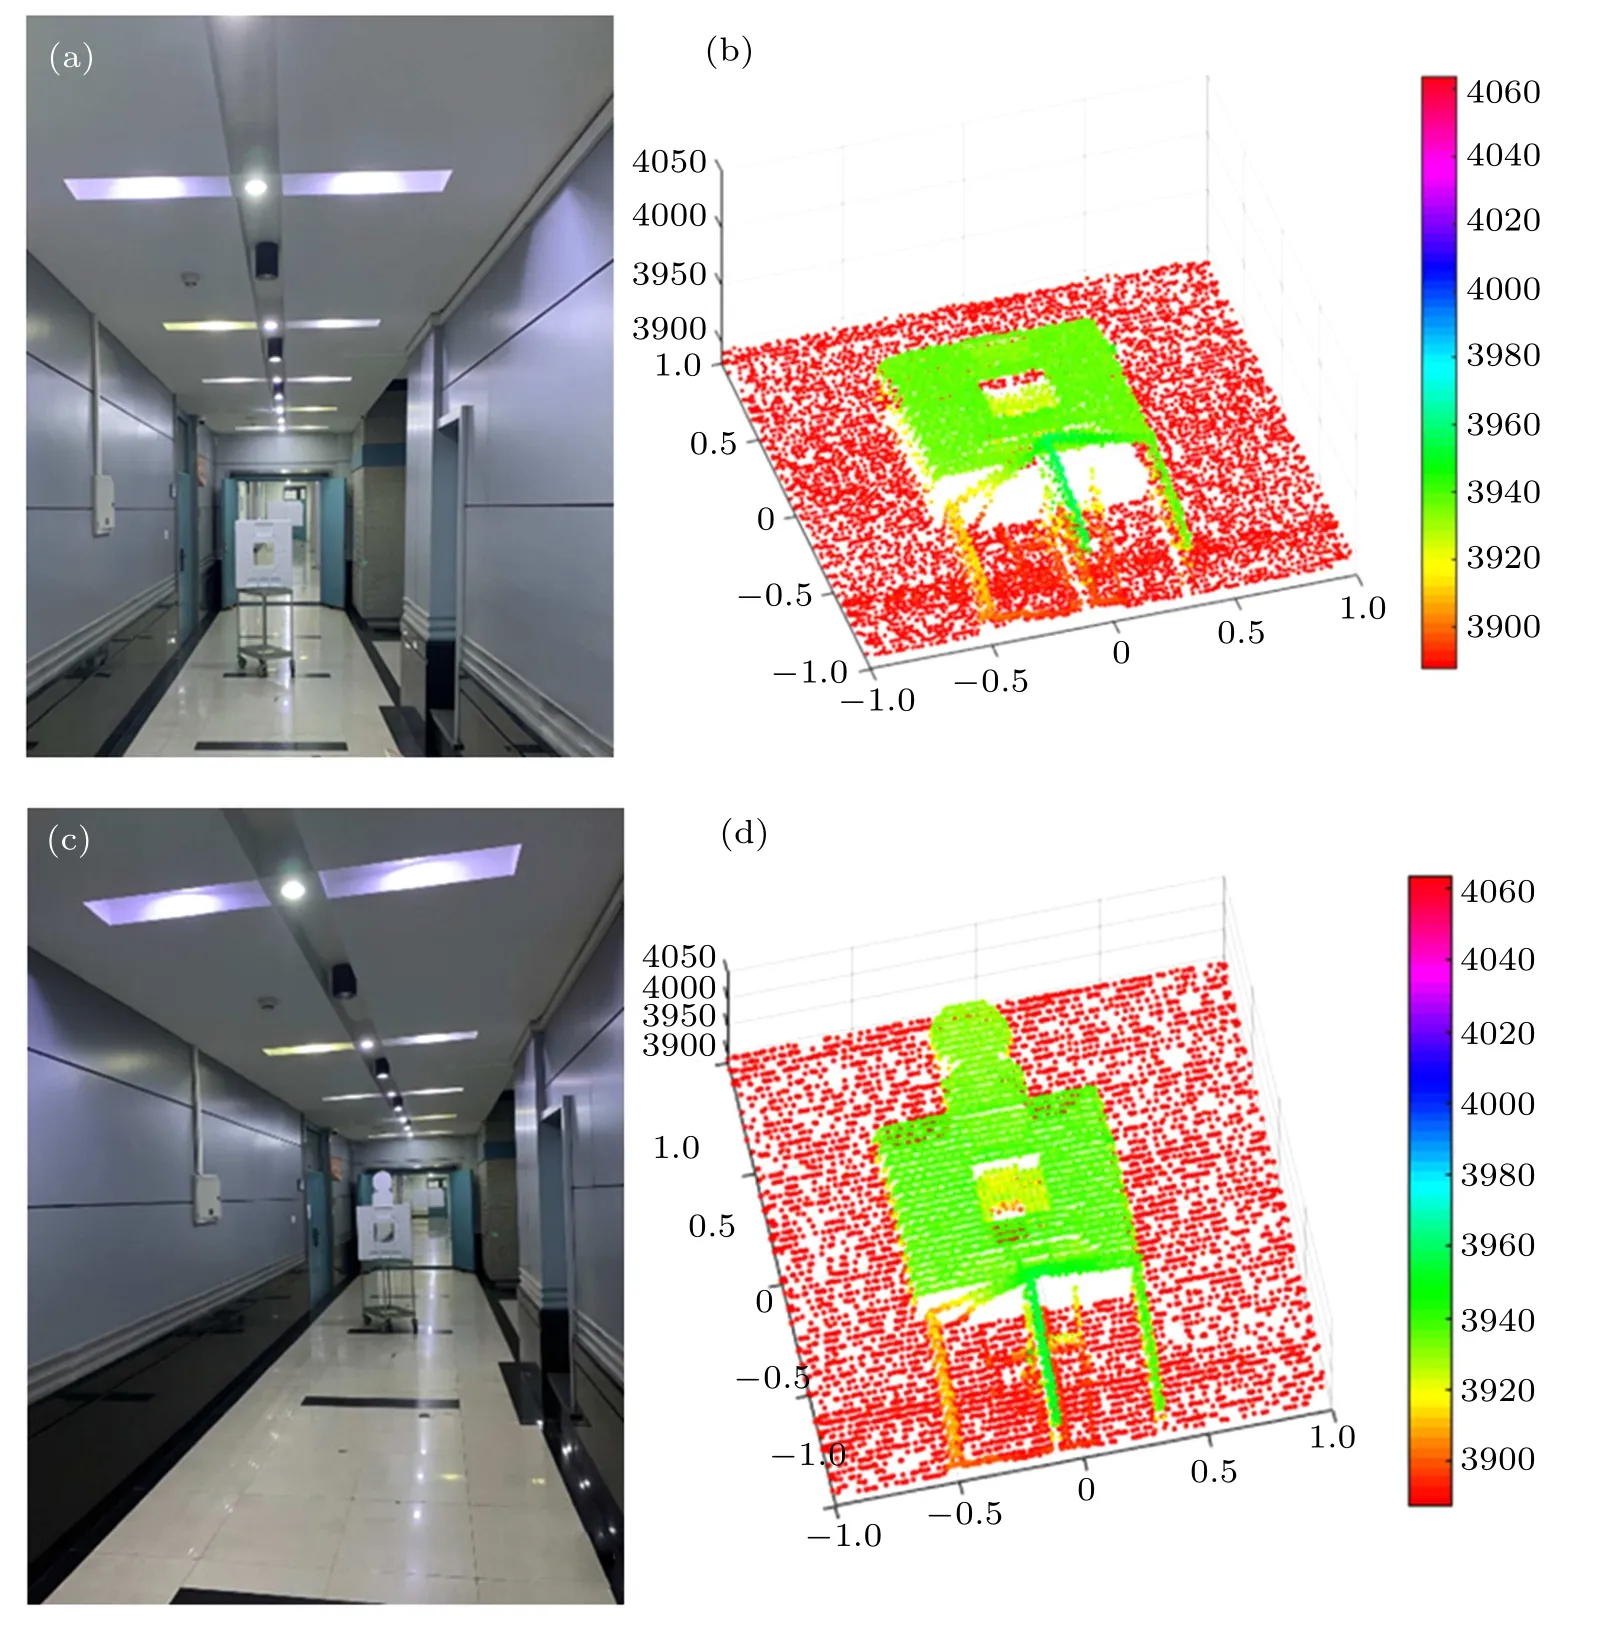
Fig.12. Diagram of scan target and three-dimensional point clouds: panels(a)and(b)are rectangle target and its points cloud,panels(c)and(d)are the unusual shape target and its point clouds,respectively.
6. Conclusion and perspectives
In the paper, a scanning distortion correction method based on driving voltage compensation was demonstrated by using the X–Y galvanometer Lidar scanning system.The main principle of pincushion distortion is deduced from geometric optical vector model, and the correctness of the model is verified by simulation and experiment. The linear relationship between driving voltage and scanning angle is verified,and the voltage compensation function is derived to correct the scanning distortion. The real experiment carried out on the X–Y galvanometer Lidar scanning system can obtain the undistorted two-dimensional scanning image,which has good scanning effect when applied in the three-dimensional scanning system. We have proved the feasibility and practicability of our method,which has the potential for application and important reference value for laser Lidar scanning system.
猜你喜欢
杂志排行

Chinese Physics B的其它文章
- Speeding up generation of photon Fock state in a superconducting circuit via counterdiabatic driving∗
- Micro-scale photon source in a hybrid cQED system∗
- Quantum plasmon enhanced nonlinear wave mixing in graphene nanoflakes∗
- Restricted Boltzmann machine: Recent advances and mean-field theory*
- Nodal superconducting gap in LiFeP revealed by NMR:Contrast with LiFeAs*
- Origin of itinerant ferromagnetism in two-dimensional Fe3GeTe2∗