A Hybrid Neural Network Model for Marine Dissolved Oxygen Concentrations Time-Series Forecasting Based on Multi-Factor Analysis and a Multi-Model Ensemble
2021-04-22HuiLiuRuiYangZhuDuanHaipingWu
Hui Liu*, Rui Yang, Zhu Duan, Haiping Wu
Institute of Artificial Intelligence and Robotics(IAIR),Key Laboratory of Traffic Safety on Track of Ministry of Education,School of Traffic and Transportation Engineering,Central South University, Changsha 410075, China
Keywords:Dissolved oxygen concentrations forecasting Time-series multi-step forecasting Multi-factor analysis Empirical wavelet transform decomposition Multi-model optimization ensemble
ABSTRACT Dissolved oxygen (DO) is an important indicator of aquaculture, and its accurate forecasting can effectively improve the quality of aquatic products. In this paper, a new DO hybrid forecasting model is proposed that includes three stages: multi-factor analysis, adaptive decomposition, and an optimizationbased ensemble. First, considering the complex factors affecting DO, the grey relational (GR) degree method is used to screen out the environmental factors most closely related to DO. The consideration of multiple factors makes model fusion more effective.Second,the series of DO,water temperature,salinity,and oxygen saturation are decomposed adaptively into sub-series by means of the empirical wavelet transform (EWT) method. Then, five benchmark models are utilized to forecast the sub-series of EWT decomposition. The ensemble weights of these five sub-forecasting models are calculated by particle swarm optimization and gravitational search algorithm(PSOGSA).Finally,a multi-factor ensemble model for DO is obtained by weighted allocation. The performance of the proposed model is verified by timeseries data collected by the pacific islands ocean observing system (PacIOOS) from the WQB04 station at Hilo. The evaluation indicators involved in the experiment include the Nash–Sutcliffe efficiency(NSE), Kling–Gupta efficiency (KGE), mean absolute percent error (MAPE), standard deviation of error(SDE),and coefficient of determination(R2).Example analysis demonstrates that:①The proposed model can obtain excellent DO forecasting results;②the proposed model is superior to other comparison models; and ③the forecasting model can be used to analyze the trend of DO and enable managers to make better management decisions.
1. Introduction
Dissolved oxygen (DO) plays an important role in the sustainable development of aquaculture and marine ecology in coastal cities.Nowadays,with the rapid development of industry,large volumes of greenhouse gas emissions are increasingly intensifying global warming[1].As a result,the seawater temperature is rising and DO is escaping from seawater [2]. If the DO concentrations in seawater are too low, marine organisms such as fish and shrimp will be deprived of oxygen,leading to slow growth and even suffocation[3].For offshore aquaculture farmers,the massive scale of the death of aquatic products will bring huge economic losses [4]. More seriously,it is difficult for DO to diffuse into the depths of the ocean,and a lack of oxygen will force aquatic organisms to change their habitats[5]. The marine ecosystem could change significantly as a result.Once the virtuous cycle of the ecosystem is broken,the survival of marine organisms will be greatly threatened [6]. Accurate DO content forecasting is very necessary for marine ecological balance and for the aquaculture development of coastal cities. It can provide a trend analysis of future changes in DO and facilitate the management of decision-makers by enabling them to take effective measures in advance[7,8].Influenced by factors such as nutrients,climate, ecological environment, and the life activities of aquatic organisms, the DO content in seawater is nonlinear and has a considerable time delay. This characteristic makes DO difficult to predict.In addition,it is easy for data obtained by sensors to be lost during transmission, and such data contains uncertain outliers,posing more challenges to the accuracy of forecasting[9].
1.1. Related works
In recent years, the rise of artificial intelligence(AI)technology has spawned a wave of AI models. On this basis, DO forecasting models can be divided into two types: physics-based models and data-driven models. Data-driven models include AI-based models and statistics-based models. To comprehensively evaluate stateof-the-art efforts in DO models, we summarize the literature on statistics-based models and AI-based models.
Statistics-based models have the advantage of easy calculation in application. In addition, a statistics-based model can predict an unknown situation by mining the potential relationship in the DO series. In practical applications, DO series are nonlinear and time-delayed. Faruk [10] used the autoregressive integrated moving average (ARIMA) model for DO forecasting to deal with the instability and nonlinearity of time series. In the experiments of Li et al. [11], the grey model was proposed to predict the trend term of DO.Huan et al.[12]obtained the optimal parameter values of the model through a Bayesian evidence framework. Khan et al.[13] compared the new Bayesian regression model with the new autoregressive modified fuzzy linear regression method.The comparison results show that the method based on fuzzy numbers can better capture DO changes in an urban river environment. Khan et al. [14] predicted changes in DO concentration by constructing multiple linear regression(MLR) models, in which the uncertainty of DO change was effectively characterized and propagated.In later research by Kisi and Parmar [15], the MLR model was used as an experimental comparison to explore the performance of other prediction models. In general, these statistics-based models have obtained the ideal forecasting effect for DO. However, forecasting accuracy remains to be improved.
Compared with statistics-based models, AI-component models have much better forecasting performance.The core of this section focuses on describing models with AI components.Commonly used AI algorithms include the multi-layer perceptron(MLP)[16],radial basis neural network (RBNN) [17], back propagation neural network (BPNN), extreme learning machine (ELM) [18], least square support vector machine (LSSVM) [19], and fuzzy neural network(FNN) [20,21], among others [22]. Since the selection of different parameters has a huge impact on the performance of an AI model,it is necessary to determine the optimal parameters by means of an optimization algorithm.Ren et al.[23]used a genetic algorithm(GA)to optimize the parameters of FNN.In addition,particle swarm optimization (PSO) [24], cauchy particle swarm optimization(CPSO)[25],the firefly algorithm(FFA)[26],and other optimization algorithms are used for parameter selection for intelligent models[27]. With its rapid development, deep learning has been widely studied for its excellent adaptive ability. Ma et al. [28] solved the problem of a sparse matrix by deep matrix factorization. Ren et al. [29] used a deep brief network (DBN)’s powerful feature extraction and functional representation capabilities to deal with highly complex nonlinear DO time-series data.Nevertheless,given the complex laws of DO changes and many other factors, simple machine learning basic predictors and parameter optimization methods are insufficient to allow accurate DO prediction.To further improve the forecasting performance of AI models, an increasing number of scholars are using feature selection, decomposition,and ensemble methods for the state-of-the-art research of DO forecasting.Further details about such research include the following:
(1) The change in DO concentration in the ocean and in freshwater environments is not isolated,as it is affected by many factors including temperature,turbidity,pH,chlorophyll,and specific conductance [30]. Changes in these factors have seemingly invisible effects on DO concentration. To effectively use these factors, the specific effects need to be studied. Shi et al. [22] used a clustering method to segment water quality time series,and finally improved the forecasting accuracy of DO.Ren et al.[23]arranged the factors that are positively and negatively correlated with DO through correlation analysis.It was found that the model showed a better forecasting performance when factors strongly related to DO were entered into the model [31]. From the perspective of the generation and consumption of DO, these influencing factors should be organically incorporated rather than directly and crudely input into the prediction model. This is not a comprehensive consideration. The direct superposition of a multi-factor forecasting series may prove to reduce the DO forecasting accuracy of a model. The weight allocation of each influencing factor needs to be analyzed,and the optimal combination method needs to be identified [32].Therefore, exploring methods involving the multi-factor analysis of DO forecasting has great research value [33].
(2) The nonstationary properties of the original DO series are not favorable for forecasting. The extreme volatility of the DO series makes it difficult to predict. The birth of the decomposition method largely solved this problem. A decomposed sub-series has independent oscillation components and is more stable, making it easier to predict [34,35]. To apply this theoretical effect to practical problems,many data preprocessing decomposition methods for AI models have been proposed.Widely used decomposition algorithms include ensemble empirical mode decomposition(EEMD) [12], discrete wavelet transform (DWT), and variational mode decomposition (VMD) [36]. DO series are more predictable after decomposition. However, the current mainstream decomposition methods require users to determine the number of decomposition layers based on experience. This practice inevitably adds human error [37]. To improve the forecasting model performance,a decomposition algorithm that can adaptively determine the decomposition level should be investigated.
(3) After years of research and development, some ensemble models can be used for the intelligent forecasting of DO.An ensemble model can combine the advantages of multiple forecasting models to achieve better forecasting performance [35]. By means of a layered ensemble,Zhu et al.[38]successfully solved the problem of it being impossible to simultaneously achieve the accuracy of high and low concentration forecasting.Iterated stepwise multiple linear regression (ISMLR) is used to preprocess the data. An artificial neural network (ANN) and MLP are used to run layered forecasting.Finally,compromise programming(CP)is used to evaluate and select the best results. Kisi et al. [39] proposed a new bayesian model averaging (BMA) method as an ensemble model.Through comparison experiments with ELM, ANNs, an adaptive neuro-fuzzy inference system (ANFIS), a classification and regression tree (CART), and MLR, it was found that the BMA ensemble method is very effective for DO prediction. The essence of an ensemble model is to improve the forecasting accuracy and scope of model application by making use of the complementary advantages of multiple models. Unfortunately, the ensemble methods described above only use multiple models for hierarchical prediction, and then simply superimpose the results. A direct ensemble of multiple models will greatly increase the complexity of the ensemble model, which can easily lead to overfitting. At the same time, the shortcomings of a single model cannot be compensated for by other models.Therefore,it is very important to select a reasonable ensemble of models.Different machine learning prediction models have individual characteristics and can cope with time series in different states. If they can be combined organically, the ensemble model will have complementary advantages. Appropriate weight allocation can cover up the prediction defects of benchmark models and enhance the advantages of benchmark models.Therefore,it is necessary to explore the scientific ensemble method of multiple models.
The DO forecasting models discussed above have been demonstrated to be effective. Still, there are gaps in scientific research that need to be filled in order to further improve DO forecasting performance. Table 1 [10–19,21–30,36,38–40] summarizes the reviewed state-of-the-art works using data-driven methods in DO forecasting.
1.2. The novelty of this study
To summarize the above literature,it can be seen that there are few comparative studies on multi-factor analysis,adaptive decomposition analysis, and scientific ensemble analysis in DO forecasting research. In view of the above limitations, a novel forecasting model is herein proposed for DO forecasting: the MF-RNNs-EWTBEGOE model. MF represents the proposed multi-factor analysis method. RNNs represents the replicator neural networks outlier detection method, EWT stands for empirical wavelet transform,BEGOE stands for BFGS-ENN-GRNN-ORELM-ELM. This model can be divided into the three stages of multi-factor analysis, adaptive decomposition, and optimization-based ensemble. Each sub-layer under the four factors uses the same type of benchmark model to predict;finally,the forecasting results of the model are obtained through a combination of the results.In the optimization ensemble phase, the ensemble weights for the Broyden–Fletcher–Goldfarb–Shanno(BFGS)model,elman neural network(ENN)model,general regression neural network (GRNN) model, outlier-robust extreme learning machine (ORELM) model, and ELM model are optimized by particle swarm optimization and gravitational search algorithm(PSOGSA) to obtain the BEGOE model. Section 2 provides the details of the proposed model.To fully understand the role of each part of the model, we performed numerous comparative experiments.

Table 1 A summary of the reviewed state-of-the-art data-driven DO forecasting methods.
The innovations and contributions of this study are described below.
(1) A hybrid three-stage ocean DO forecasting ensemble model is designed. The model considers multi-factor analysis, adaptive decomposition analysis, and scientific ensemble analysis, thereby filling three of the research gaps described in Section 1.1. The multi-factor analysis reasonably considers the effects of temperature, salinity, turbidity, chlorophyll, and oxygen saturation on the concentration of DO in the ocean. EWT decomposition is utilized to adaptively improve the predictability of time series. The nonstationarity of DO series is reduced. The PSOGSA optimization method is used to optimize the weights of multiple benchmark models. The complementation of the benchmark model further improves the performance of the hybrid model. These three modules work together to achieve accurate forecasting of DO.
(2) Several factors that affect the concentration of DO in the ocean are reasonably considered.The multi-factor analysis method not only considers the influence of single and multiple factors on model accuracy, but also considers correlations among multiple factors.In this way,a hybrid model with better fusion performance can be obtained, avoiding the unilateral influence and local disadvantage of a single factor.This method also makes up for the shortcomings of direct multi-factor input, as such input may have a negative effect. This approach can take into account the reasons for a change in DO concentration from various aspects.
(3)The adaptive data preprocessing method has achieved ideal results in regard to the decomposition effect. Compared with the mainstream decomposition method, adaptive decomposition avoids the error caused by the artificial selection of decomposition layers.In this way,the decomposition layer can be predicted more easily. In addition, the EWT decomposition method discards the residual signal of the decomposition mode to extract meaningful information from the ocean DO time series. The EWT method also compensates for the sensitivity of some decomposition algorithms to noise and sampling to a certain extent. The support of mathematical theory allows the machine learning algorithm performance to develop effectively.
(4)The organic combination of multiple benchmark models fills the research gap for the ensemble model. A meta-heuristic optimization algorithm is used to assign weights to BFGS,ENN,GRNN,ORELM, and ELM. The ensemble approach can achieve the advantages of multiple benchmark models while reducing the adverse effects of a single model. The ensemble model solves the poor robustness problem of some forecasting models and fully demonstrates the superiority of the complementary performance. Therefore,a multi-model complementary ensemble framework based on meta-heuristic optimization algorithm has great value.
2. The proposed multi-factor forecasting model
As mentioned earlier,the modeling process of the proposed MFRNNs-EWT-BEGOE model can be divided into three stages: multifactor feature extraction, EWT decomposition, and multi-model optimization ensemble optimization ensemble. Fig. 1 shows the modeling flow. It is worth mentioning that the proposed model uses the multi-input multi-output strategy (MIMOS), which is commonly used in the field of time-series forecasting [41]. Compared with recursive strategy(RS),the MIMOS has a smaller cumulative error[42].Fig.2 shows the schematic diagram of the RS and MIMOS.
2.1. Stage 1: The multi-factor analysis method
2.1.1. Substage 1.1: Replicator neural networks outlier detection
Outlier rejection is an important process for DO data. Preprocessing makes the data look more orderly and makes it more easily learned by the forecasting model, without paying attention to the sources of the outliers.It is worth noting that only the training sets are corrected, while the test sets remain the same. This is a more convincing way to verify the validity of the model. RNNs is used to detect outliers of the original ocean DO series. This is a multilayer feed-forward neural network [43].

Fig.1. The modeling flow of the proposed three-stage model.GR:grey relational;GWO:grey wolf optimizer;BA:bat algorithm;MVO:multi-verse optimization algorithm;WOA: whale optimization algorithm; NBA: new bat algorithm.

Fig. 2. Schematic diagram of multi-step forecasting strategies.
Assuming that the output of the ith neuron in the k layer of the RNNs is Sk(Iki), Ikirepresents the input of the ith neuron in the k layer,and Skrepresents the activation function used in the k layer.The input of the neuron can be expressed as follows:
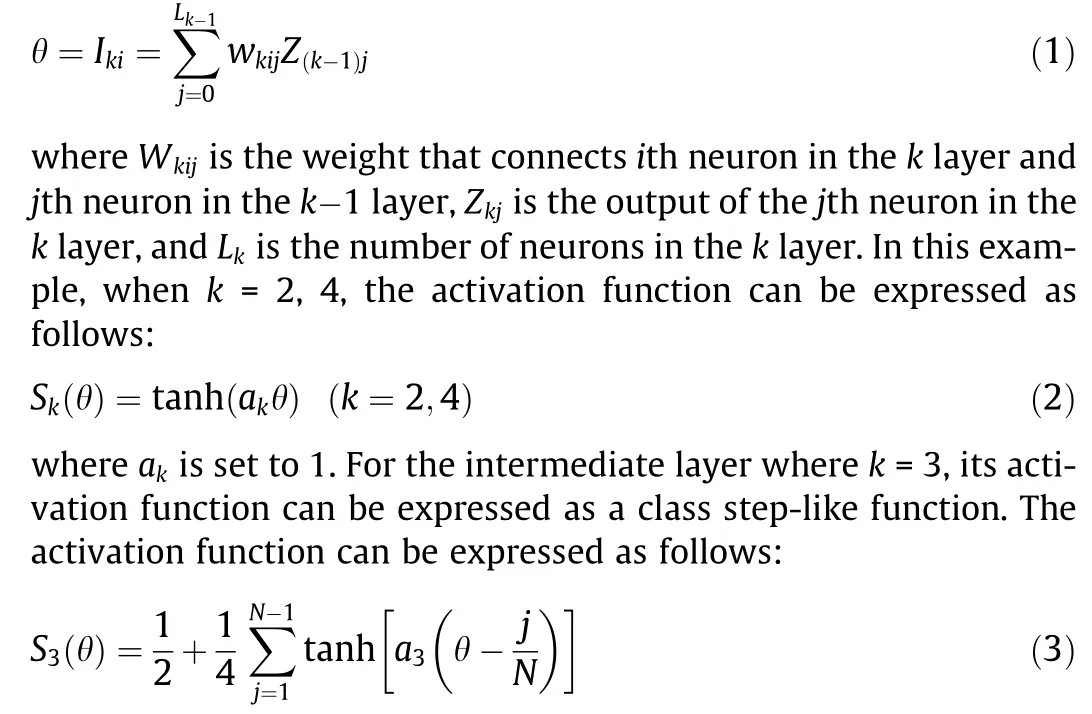
where N represents the number of steps and a3represents the rate of promotion to the next level.
In general,continuous data entering the third layer is converted into a batch of discrete values through the S3stepwise activation function of the RNNs.This is equivalent to mapping the series sample to N clusters.Finally,the RNNs can calculate a single outlier and a small cluster of outliers. This completes the outlier detection of marine data at the WQB04 site. Algorithm S1 in the Appendix A shows the pseudo-code of the RNNs outlier detection method.
2.1.2. Substage 1.2: Multi-factor analysis of the grey relational (GR)degree method
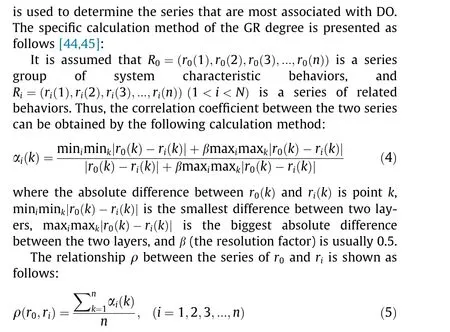
To screen out the most favorable factors for DO forecasting,the GR degree method is used to select the features of the original multi-factor series. In this example, the GR degree method is used to calculate the correlation of environmental factors such as temperature, salinity, turbidity, chlorophyll, and oxygen saturation.The greater the degree of grey correlation between time series,the closer the distance between the two series. Feature selection
2.2. Stage 2: The EWT-decomposition method
2.3. Stage 3: The multi-model optimization ensemble method
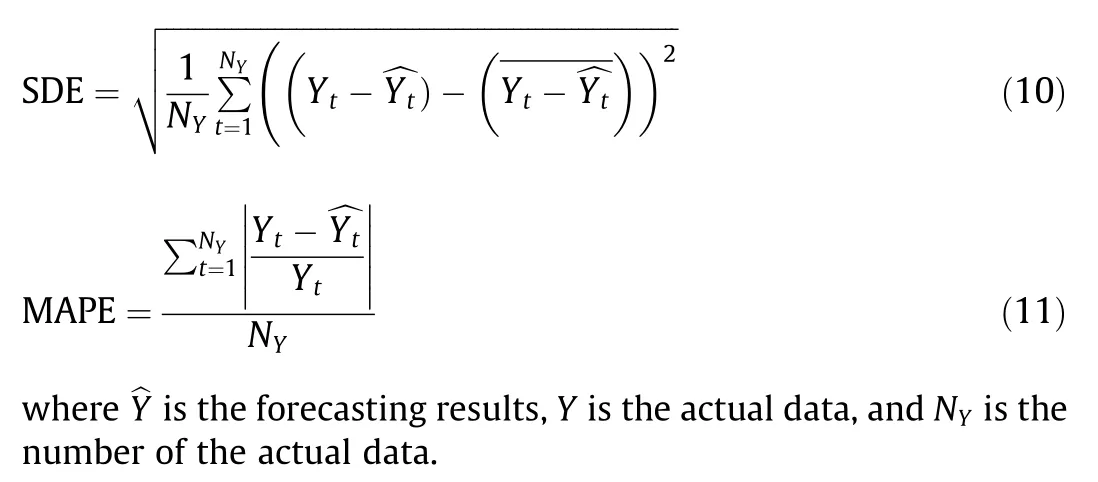
To further improve the forecasting performance,the BFGS,ENN,GRNN,ORELM,and ELM are combined to obtain the BEGOE model.The ensemble weights are optimized by the PSOGSA. Fig. 4 shows the weighted optimization scheme. The optimization objective function of PSOGSA is minimizing the mean absolute percent error(MAPE).The MAPE refers to the average absolute percentage error between different samples’ actual and forecasting values. The objective function is calculated in the validation data. The specific objective function is shown as follows:
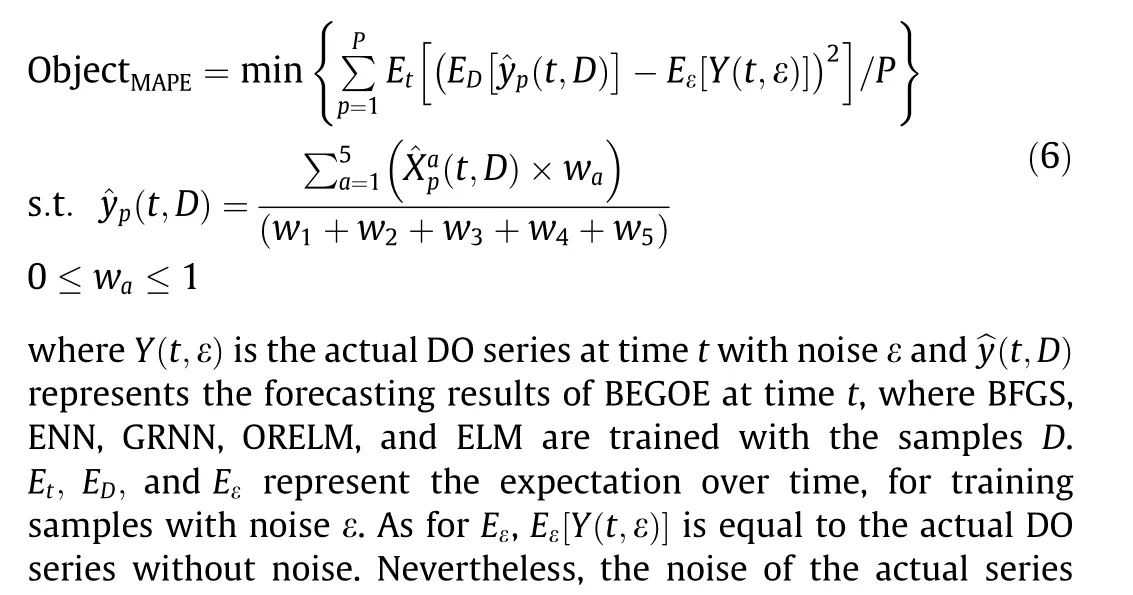
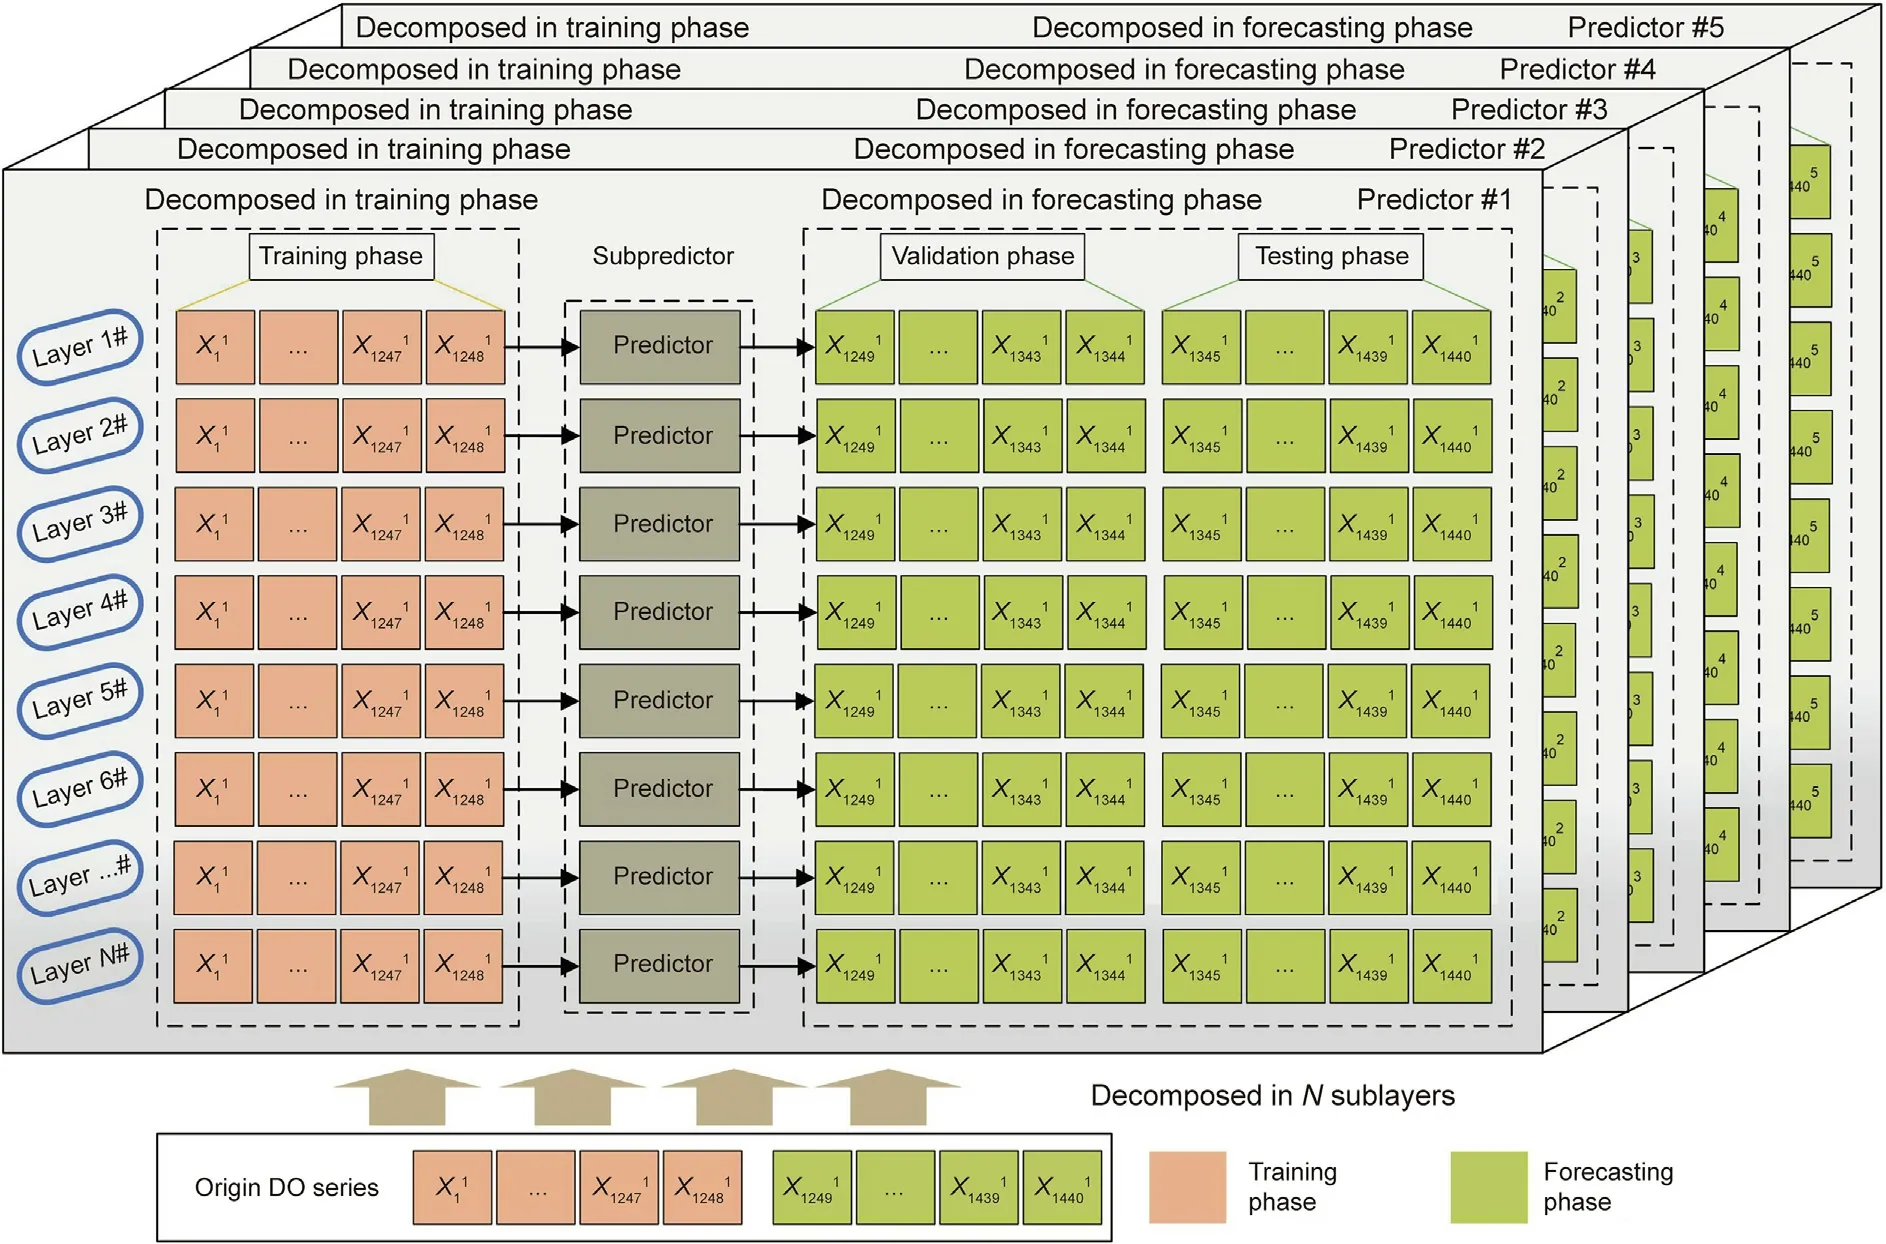
Fig. 3. EWT-decomposed and layer-by-layer forecasting.
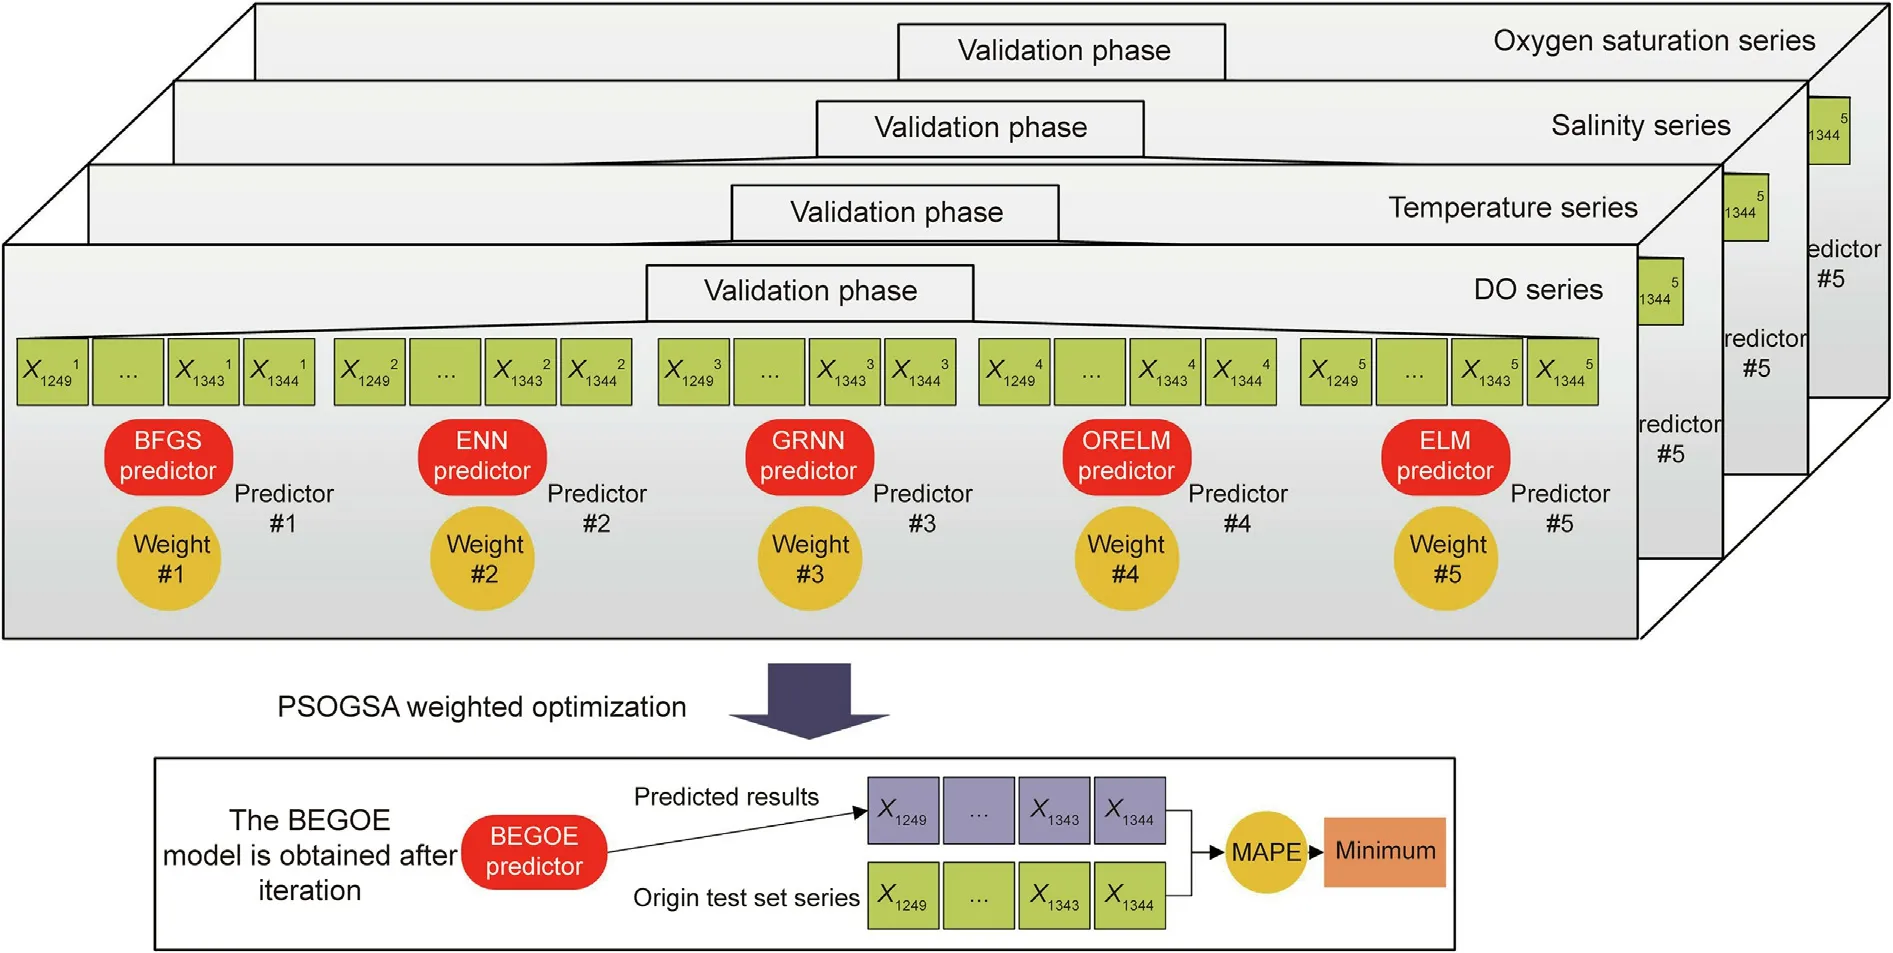
Fig. 4. The PSOGSA optimization ensemble process under multi-factor analysis.


Considering that the DO, water temperature, salinity, and oxygen saturation series are involved in this example, the input of the BEGOE model are four series, and the output is a DO series.By minimizing the objective function MAPE,appropriate ensemble weights can be obtained.The effects of water temperature,salinity,and oxygen saturation are added to the DO series.Finally,the forecasting results of the BEGOE can be obtained. Algorithm S3 of the Appendix A shows the pseudo-code of the multi-model optimization ensemble method.
3. Experiment and analysis
In this section, multiple comparative experiments are carried out to verify the effectiveness of the proposed model. In Section 3.1,six real-time series sets collected by the ocean observing system are introduced. In Section 3.2, the performance indices for evaluating the forecasting results are demonstrated. In Section 3.3, the implementation details and the contributions of each stage are explained. In Section 3.4, two experiments are set up.Experiment I compares the contributions of the model components horizontally, and Experiment II compares several state-of-the-art models to demonstrate the superiority of the proposed model.
3.1. Data description
In this section, time-series data such as DO, temperature,salinity, turbidity, chlorophyll, and oxygen saturation collected by the Pacific Islands Ocean Observing System from the WQB04 station at Hilo are used for experimental research. The time interval of the six time-series data is 15 min. To effectively build the subsequent models, the dataset is divided into three parts: a training set, validation set, and test set. The data corresponding to the six factors were all selected from the time period of 1–30 December 2016. Among them, the data for 16–30 December is regarded as Dataset #1, while the data for 1–15 December is regarded as Dataset #2. The total length of each series corresponding to each factor is 1440. The training set contains the 1st–1248th data, the validation set contains the 1249th–1344th data, and the test set contains the 1345th–1440th data. Fig. S1 and Table S1 in the Appendix A present the dataset information after RNN outlier processing.
3.2. Performance evaluation
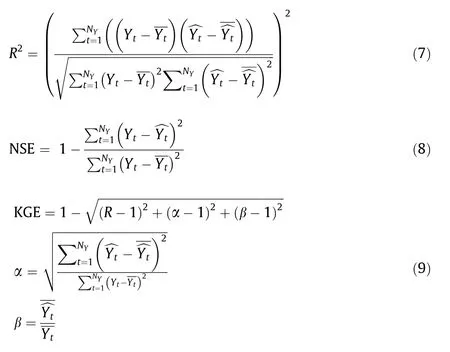
An index set is applied to evaluate the deterministic forecasting performance,including the coefficient of determination(R2),Nash–Sutcliffe Efficiency (NSE) [47] index, Kling–Gupta fficiency (KGE)[48],standard deviation of error(SDE),and MAPE.The expressions of these five indices are shown as follows:
3.3. Modeling analysis
3.3.1. Multi-factor analysis
The DO in the ocean is affected by many factors.In this paper,a variety of factors affecting the increase and decrease of DO concentrations are analyzed. Fig. 5 shows the system dynamics model.
As shown in Fig.5,many factors affect DO concentrations.Usually, atmospheric diffusion, water exchange, mechanical aerobics,aquatic photosynthesis, and the like are the main sources of DO.Under natural conditions, the DO content in the ocean is closely related to the partial pressure of oxygen in the air and the temperature of the water.When the rate of oxygen dissolved into the water is equal to the rate of oxygen escaping from the water,the dissolution reaches a dynamic equilibrium. The equilibrium of DO in the ocean is also affected by salinity, turbidity, pH, and other factors.In addition, chemical oxidation reactions, organic decomposition,breathing by phytoplankton at night, and aquatic respiration are the main factors of marine DO consumption. In short, there are many factors affecting changes in DO content, and the law of distribution variation is difficult to explain by a simple mechanism.
In this experiment, the relationship between temperature,salinity, turbidity, chlorophyll, oxygen saturation, and DO concentrations is calculated by using the GR degree method. Table 2 shows the specific results.According to Table 2,temperature,salinity,and oxygen saturation have the highest correlation degree with DO. The correlation indicators reach 0.61, 0.68, and 0.87, respectively,and all exceed the set threshold of 0.5. It is worth mentioning that salinity contains nutrients, and nutrients play an important role in DO concentration.Considering that high concentrations of turbidity will influence the photosynthesis of plants in water and affect oxygen production, turbidity was also input into the model as a DO-related factor. The experiment adopts the form of multi-factor variable input and single-factor variable output. In an actual comparison of repeated experiments, it was found that the forecasting accuracy is the best when temperature, salinity,and oxygen saturation are input into the model as the influential factors of DO. The experimental results show that if lowcorrelation factors such as turbidity,chlorophyll, and pH are input into the model, the forecasting accuracy decreases accordingly. In this case, the index of chlorophyll always maintains a value of-8.8 × 10⁻⁷. Therefore, it does not show a correlation with the change in DO, so the correlation coefficient between chlorophyll and DO is not a number.
3.3.2. Decomposition model analysis
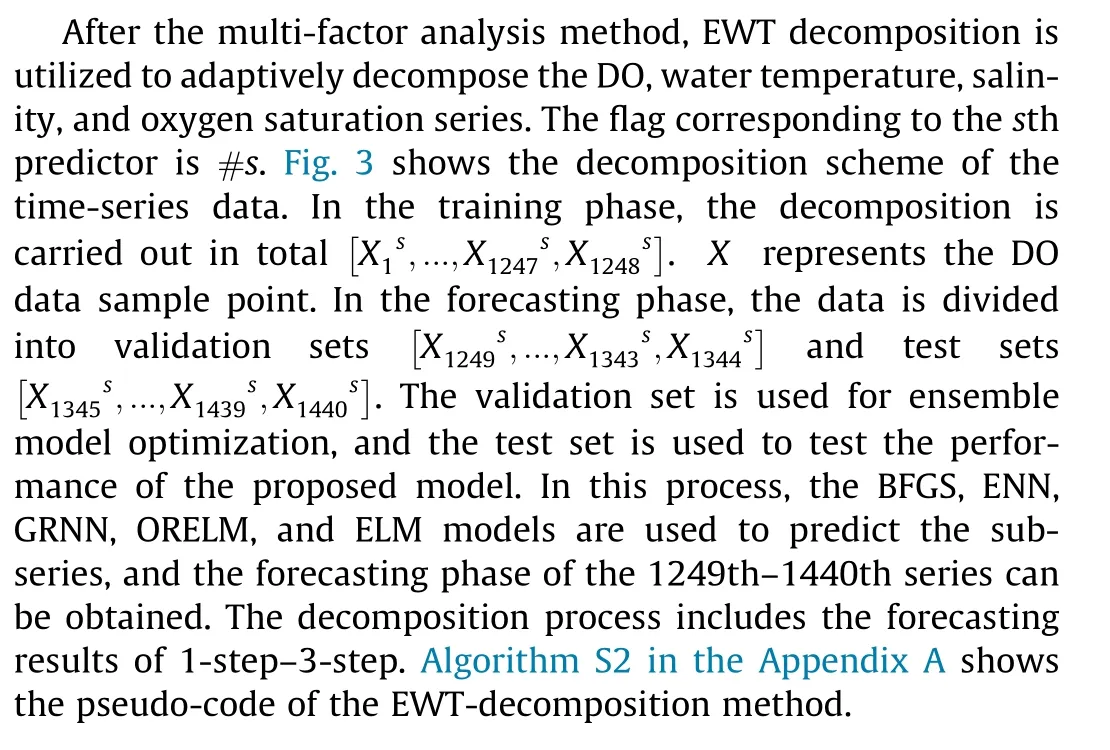
In this section,the EWT is used to reduce the non-stationarity of the DO series,the water temperature series,the salinity series,and the oxygen saturation series, all of which are adaptively decomposed. It is worth mentioning that only the training set data is decomposed.After the original DO series and the highly correlated series are decomposed, the sub-series having more stable characteristics are easier to predict.The primary predictor simply concentrates on a certain frequency band within these sub-series.Eventually,the final result after data preprocessing can be obtained by superimposing the prediction result of the sub-predictor. This section compares the performance changes of the forecasting models by decomposing the input series.
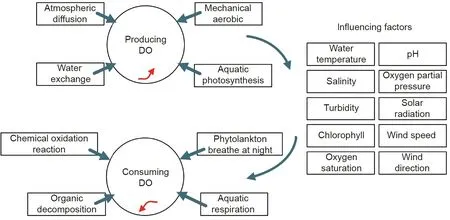
Fig. 5. System dynamics model diagram of dissolved oxygen change.

Table 2 Correlation coefficient between environmental factors and dissolved oxygen in the WQB04 dataset.
3.3.3. Optimization method analysis
In this section, the PSOGSA is compared with multiple alternative methods, including the grey wolf optimizer (GWO), bat algorithm (BA), multi-verse optimization algorithm (MVO), PSO,whale optimization algorithm (WOA), and new bat algorithm(NBA).Most of these optimization algorithms are based on heuristic bionic algorithms, and it is difficult to clearly explain which is more suitable from a theoretical point of view. Therefore, experiments are needed to verify the DO prediction effect of each optimization algorithm in this situation.
3.4. Comparison study
3.4.1. Experiment I: Comparisons with each component of the proposed model
In Experiment I,five baseline models based on the components of the proposed model are constructed and used to evaluate the proposed model. Table 3 lists their specific expressions. To compare the effects of environmental parameters related to DO in actual calculations, we established a multi-factor analysis experiment. Models 1–3 are trained without multi-factor analysis. In the same situation, Models 4 and 5 and the proposed model are added with multi-factor analysis. In other words, Models 4 and 5 and the proposed model are trained with environmental factorsincluding DO series,temperature series,salinity series,and oxygen saturation series. To compare the effects of the optimization ensemble, a multi-model ensemble comparison experiment is established. Compared with Models 1 and 4, Models 2 and 5 are optimized and combined with five benchmark models. To verify the superiority of the EWT decomposition method,a set of experimental comparisons with or without data preprocessing are also implemented. More specifically, Model 3 and the proposed model add a module for EWT data preprocessing to reduce the instability of the original series. Tables 4 and 5 list the DO testing dataset forecasting results. In addition, in order to reflect the impact of optimization algorithms, the seven optimization algorithms described in Section 3.3.3 are used in the multi-model optimization ensemble module. Fig. 6 shows testing dataset forecasting results in 3-step of the PSOGSA and other optimization algorithms.

Table 3 Experimental setup of baseline models and the proposed model.
The conclusion can be summarized from Tables 4 and 5, and Fig. 6 as follows:
(1) Model 2 (RNNs-BEGOE) is significantly better than Model 1(RNNs-BFGS/ENN/GRNN/ORELM/ELM) regardless of whether in Dataset #1 or Dataset #2, which shows that the multi-model ensemble method is effective. This method combines the advantages of five benchmark models.The multiple iterations of the optimization algorithm complete the combination of each model through the optimal weight allocation.The ensemble model incorporates the advantages of each benchmark model while discarding their negative performance.Taking the 1-step forecasting results of Dataset #1 as an example, the MAPE of RNNs-BFGS, RNNs-ENN,RNNs-GRNN, RNNs-ORELM, RNNs-ELM, and RNNs-BEGOE are 1.76%, 1.51%, 2.74%, 1.49%, 1.61%, and 1.32%, respectively. Other evaluation indicators such as NSE, KGE, SDE, and R2all show that Model 2 is better than Model 1 in forecasting performance.
(2) Model 3 (RNNs-EWT-BEGOE) is significantly better than Model 2 (RNNs-BEGOE), which shows that the decompositionbased data preprocessing method can have a positive effect on improving model prediction performance. The EWT adaptively decomposes the original series into multiple sub-series. The decomposed series has independent oscillation components and strong stability. The EWT has strong mathematical support whileeliminating the interaction between different sub-series.The combination of these advantages makes EWT an excellent candidate for data preprocessing.Taking the 1-step forecasting results of Dataset#1 as an example, the NSE, KGE, MAPE, SDE, and R2are 0.70, 0.75,1.32%, 0.10 mg·L-1, and 0.83 for Model 2, and 0.97, 0.96, 0.38%,0.04 mg·L-1, and 0.97 for Model 3, respectively.
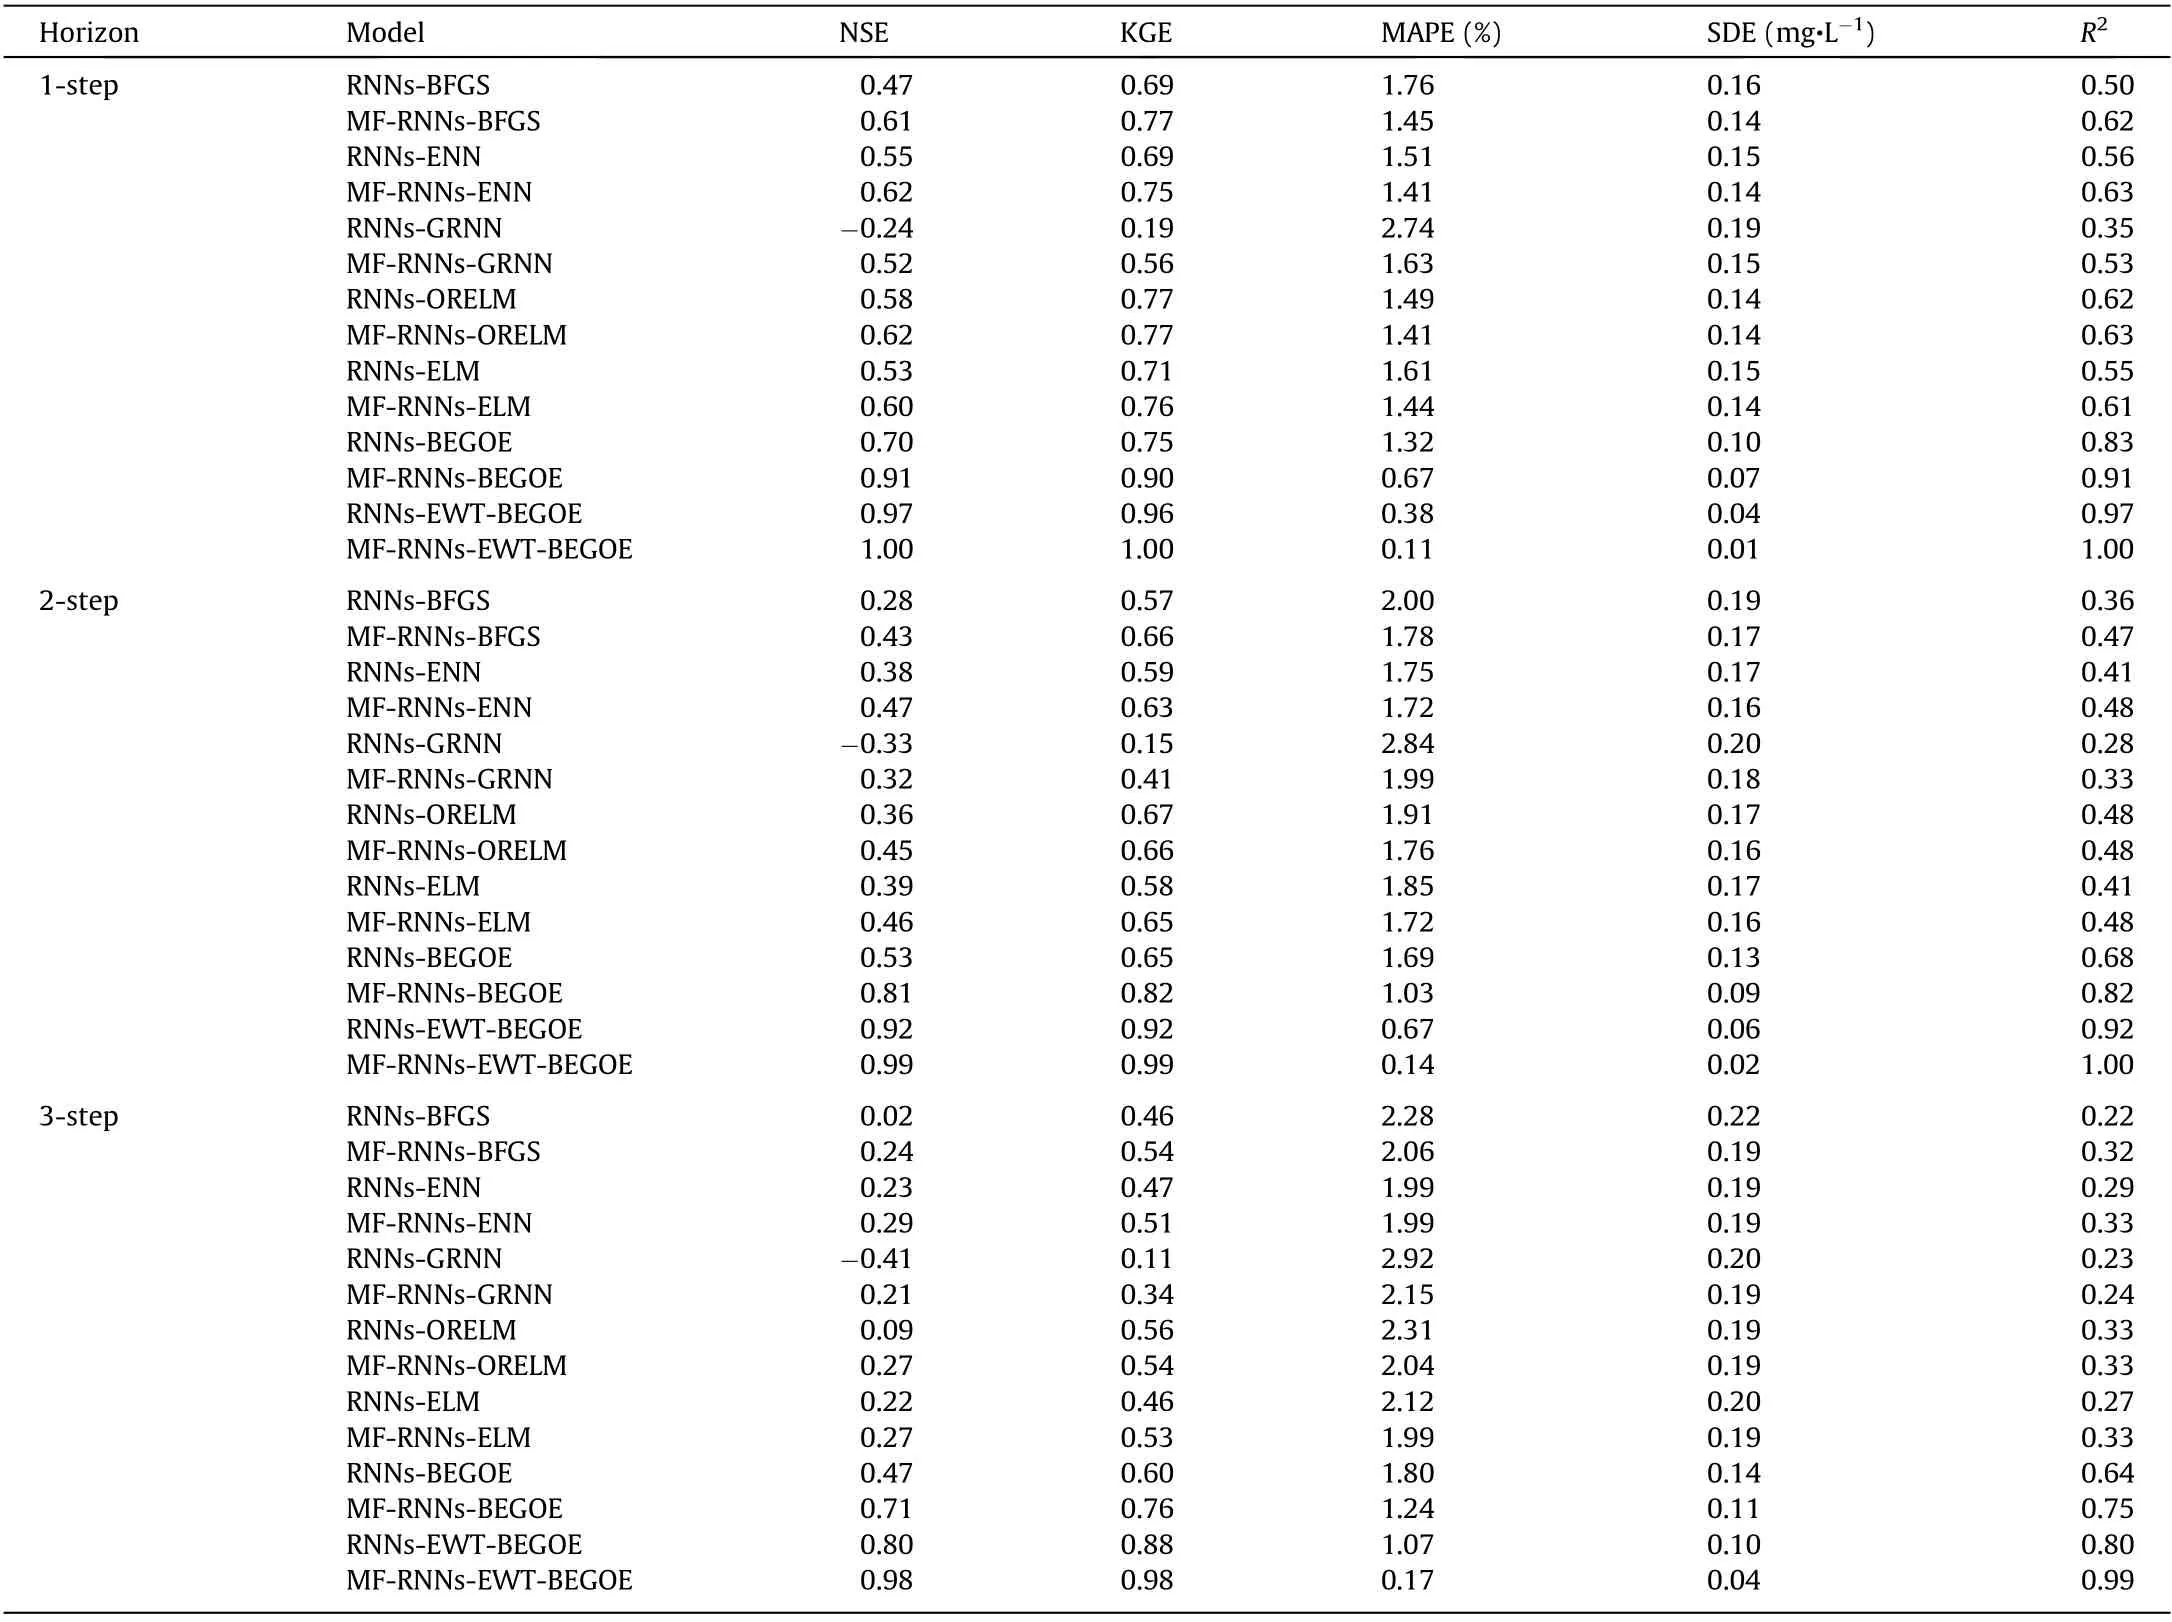
Table 4 Evaluation indices of the compared models in Experiment I (Dataset #1).
(3) Models 4 (MF-RNNs-BFGS/ENN/GRNN/ORELM/ELM) and 5(MF-RNNs-BEGOE) and the proposed model with multi-factor analysis performed significantly better in comparison with the corresponding Models 1–3 without multi-factor analysis. This work shows that environmental factors such as temperature, salinity,and oxygen saturation have an impact on DO concentration.There is a complex nonlinear relationship between them,and the consideration of a single DO factor is not comprehensive. Taking the 1-step forecasting results of Dataset #1 as an example, the NSE,KGE, MAPE, SDE, and R2are 0.70, 0.75, 1.32%, 0.10 mg·L-1, and 0.83 for Model 2, and 0.91, 0.90, 0.67%, 0.07 mg·L-1, and 0.91 for Model 5, respectively. The experimental results show that the multi-factor consideration is correct. When multiple factors are reasonably input into the forecasting model, a more accurate and more scientific forecasting result can be obtained.
(4)Considering all the experimental datasets,forecasting steps,and different model evaluation indicators, the proposed hybrid model has the most outstanding forecasting performance. The excellent robustness and accuracy of the proposed model make its prediction result very close to the actual DO value. Taking the 1-step forecasting results of Dataset #1 as an example, the NSE,KGE, MAPE, SDE, and R2of the proposed model are 1.00, 1.00,0.11%, 0.01 mg·L-1, and 1.00, respectively. Taking the 1-step forecasting results of Dataset #2 as an example, the NSE, KGE, MAPE,SDE, and R2of the proposed model are 1.00, 0.98, 0.18%,0.01 mg·L-1,and 1.00,respectively.Both sets of experiments show that the proposed model has good durability.
In summary, multi-factor analysis, adaptive decomposition analysis,and scientific ensemble model analysis are indispensable for improving the performance of the proposed hybrid model. The framework of the hybrid model has strong interpretability, and it provides a direction for the improvement of DO forecasting.
3.4.2. Experiment II: Comparison with existing models
In recent years, many AI-based models have been proposed for DO prediction.In Experiment II,we reproduced three state-of-theart models that were published in 2018–2020 to compare them with our proposed hybrid model in order to verify the DO forecasting performance. These models are relatively complex, and basic machine learning models can also achieve satisfactory results. To complete a reasonable and scientific model evaluation, we added the support vector machines (SVM) model based on ANN, and the DBN model based on deep learning for comparison.The specific model introduction is elaborated as follows:

Table 5 Evaluation indices of the compared models in Experiment I (Dataset #2).
Li et al. [31] used a recurrent neural network, long short-term memory network (LSTM), and gate recurrent unit (GRU) to construct three DO forecasting models,respectively,in order to determine the most suitable one. In the experiment, the correlation coefficients between pH, turbidity, temperature, NH, and DO are calculated,and then these series are uniformly input into the forecasting model. Compared with Li’s direct inputting of all parameters, we set thresholds and experimental screening methods to finally determine the factors that can have a positive effect on DO forecasting. Li’s approach risks reducing accuracy. In fact, the correlation coefficient of the impact factors can only be used as a reference indicator, and the true relationship between these environmental factors and DO is very complicated.
Huan et al.[12]combined the EEMD data preprocessing method and LSSVM to improve the model’s performance for DO forecasting.EEMD is used to decompose the DO series,and then LSSVM is used to predict these intrinsic mode function (IMF) components separately. The synthesized prediction result is obtained by superposition.Before the final DO forecasting results are generated,BPNN is used to reconstruct the forecast results, thereby eliminating the wrong analysis. It is a pity that EEMD lacks sufficient theoretical support in terms of mathematical definition, which results in decomposition flaws. We use a novel signal processing tool EWT to overcome this shortcoming. At the same time, the adaptive decomposition characteristics of EWT can determine the optimal number of decomposition layers to maximize the decomposition effect.
Ren et al. [23]used GA to optimize the center and width of the center layer of the FNN to determine the best combination and improve DO prediction performance. In the proposed model, we apply the optimization algorithm to the ensemble of multiple benchmark models. The advantage of this approach is to reasonably combine the superior performance of multiple AI models while discarding bad performance. Compared with a single parameter-optimized predictor, the complementarity of multiple models can make the model more mature and allow it to obtain more adequate training. Among the models used, the reasonable weight allocation obtained by multiple iterations plays a key role.
More specifically,Tables 6 and 7,and Figs.7 and 8 show the DO testing dataset forecasting results of the proposed model and stateof-the-art models.
The conclusion can be summarized from Figs. 7 and 8, and Tables 6 and 7, as follows:

Fig.6. Testing dataset forecasting results in 3-step of the PSOGSA and other optimization algorithms(the above-mentioned different optimization methods are all based on the multi-factor-EWT-BEGOE ensemble model to conduct control variable comparison experiments)(Dataset#1).Time(15 min)indicates that the sampling interval of data is 15 minutes.

Table 6 The DO testing dataset forecasting results of the proposed model and state-of-the-art models (Dataset #1).
Considering all datasets, forecasting steps, and different timeseries evaluation indicators,the proposed model has the best forecasting performance in comparison with the other state-of-the-art models. Taking the 1-step forecasting results of Dataset #1 as an example, the MAPE of SVM, DBN, Li’s model, Huan’s model, Ren’s model, and the proposed model are 1.41%, 1.44%, 0.52%, 0.56%,0.51%, and 0.11%, respectively. The proposed model performs well in forecasting robustness and can still perform satisfactorily even in higher prediction steps. Taking the 3-step forecasting results of Dataset #1 as an example, the MAPE of SVM, DBN, Li’s model,Huan’s model, Ren’s model, and the proposed model are 1.99%,2.06%, 1.05%,0.89%, 1.21%,and 0.17%, respectively. Based on other persistence indices,the performance of the proposed model is very outstanding.Taking the 3-step forecasting results of Dataset#1 as an example, the NSE, KGE, MAPE, SDE, and R2of the proposed model are 0.98, 0.98, 0.17%, 0.04 mg·L-1, and 0.99, respectively.Taking the 3-step forecasting results of Dataset #2 as an example,the NSE, KGE, MAPE, SDE, and R2of the proposed model are 0.96,0.94, 0.58%, 0.04 mg·L-1, and 0.98, respectively.
To sum up, the forecasting results of different datasets show that the proposed hybrid forecasting model has a reasonable framework and achieves a satisfactory forecasting performance.This is mainly because the proposed model hybridizes multifactor analysis,adaptive decomposition analysis,and the scientific ensemble model analysis method.This combination is very helpful in improving the forecasting accuracy and robustness of the proposed model.

Table 7 DO testing dataset forecasting results of the proposed model and state-of-the-art models (Dataset #2).
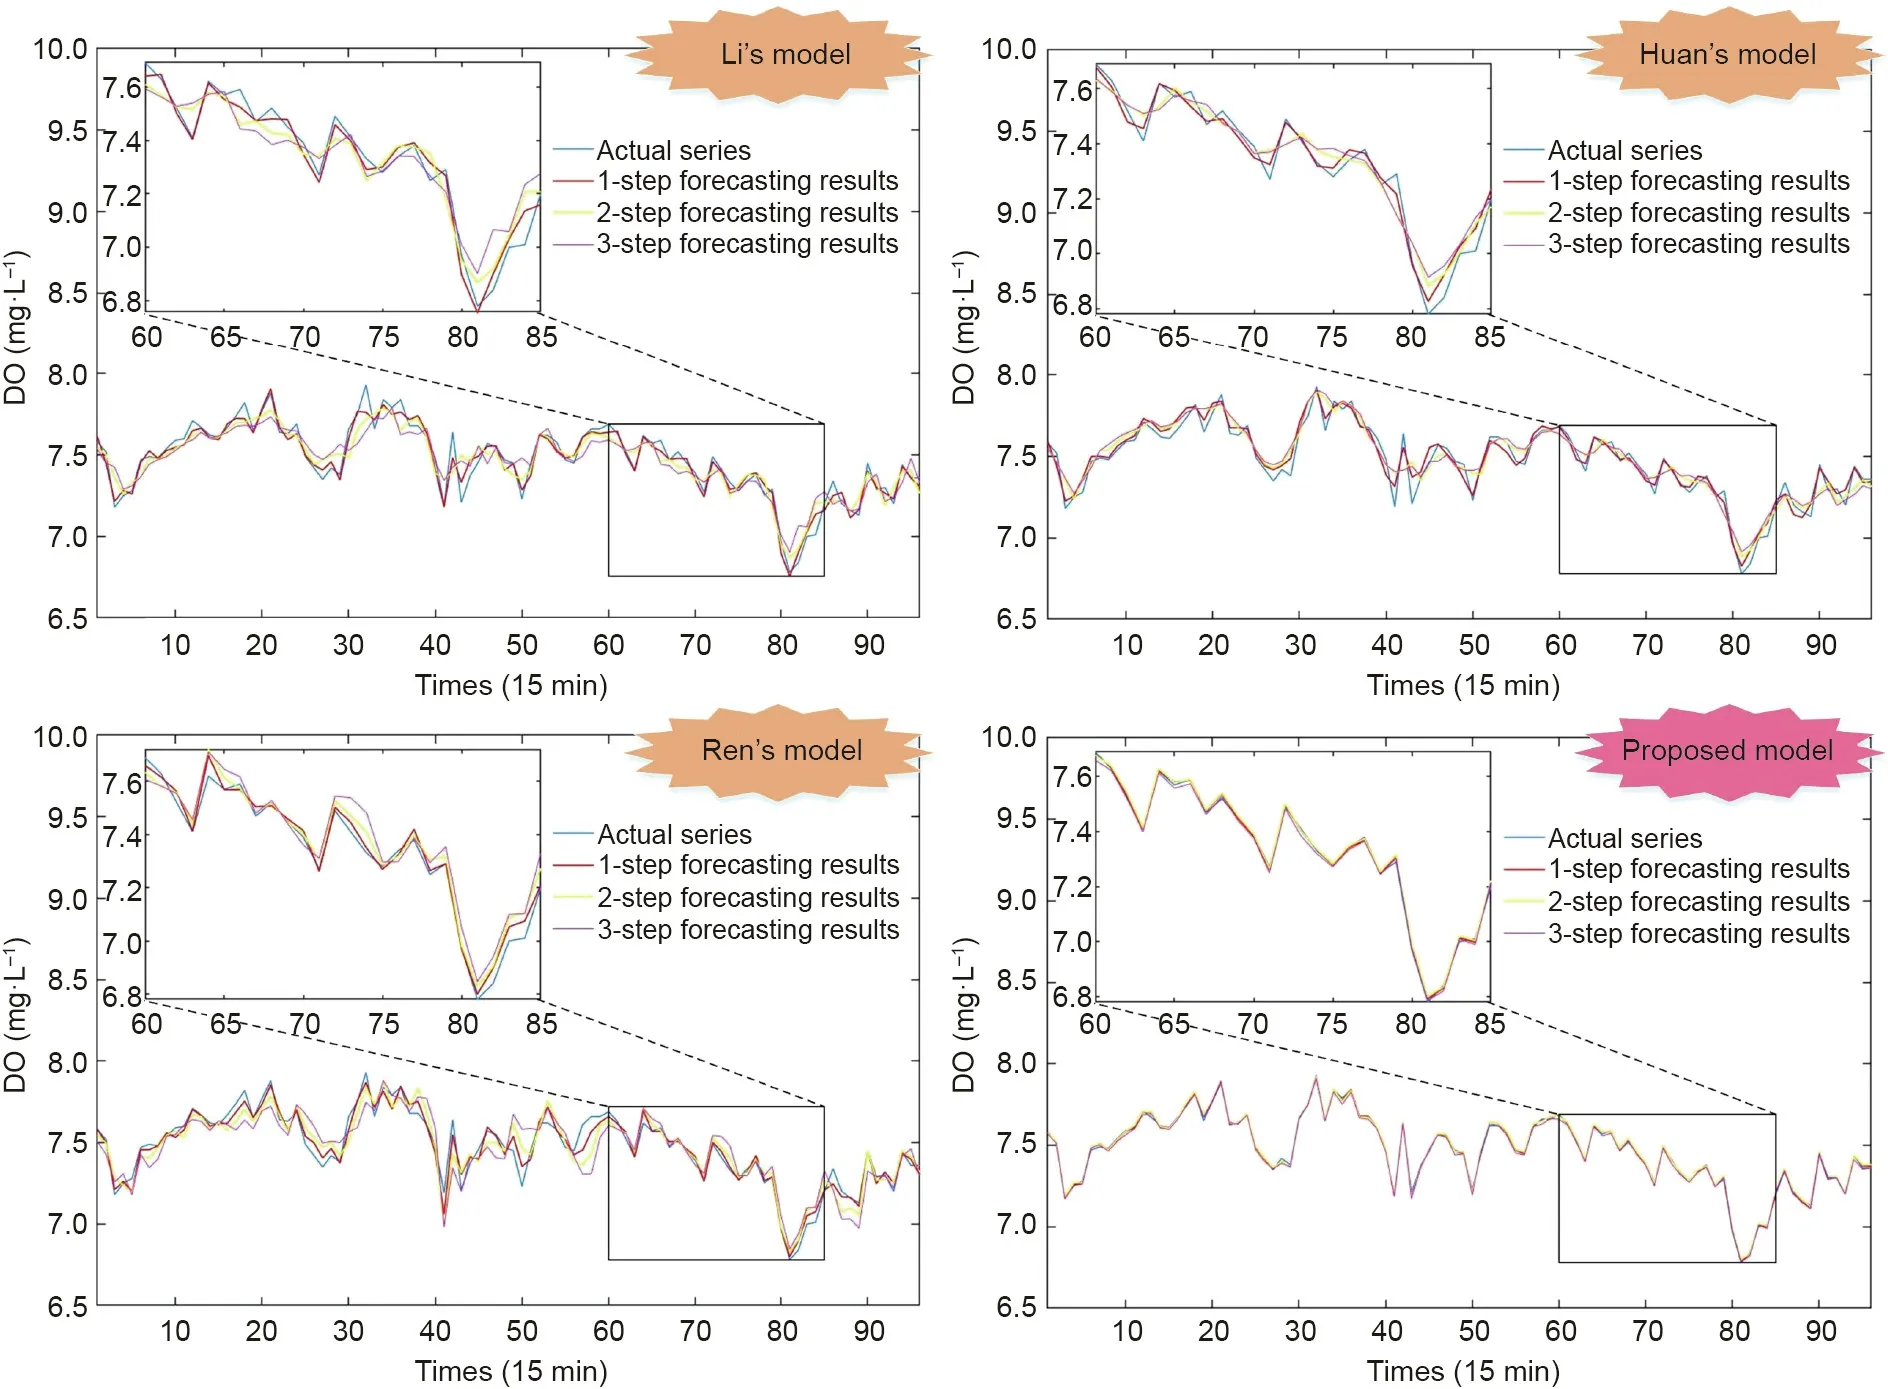
Fig. 7. DO testing dataset forecasting results of the proposed model (MF-RNNs-EWT-BEGOE) and other models (Dataset #1).
4. Application potential
The level of DO concentration in a marine environment is caused by two effects: the oxygen consumption effect, which decreases DO concentration;and the oxygen recovery effect,which increases DO concentration.The life activities of aquatic organisms consume a certain amount of oxygen, thereby reducing the DO concentration. The photosynthesis of aquatic plants and the diffusion of oxygen in the air will increase the DO concentration.Fig. 9(a) shows the changes of actual DO time series data and 1-step, 2-step, and 3-step forecasting results. The following facts are illustrated in Fig. 9: ①As the temperature increases, the DO concentration decreases, and as the temperature decreases, the DO concentration increases. This is because higher temperatures will force DO in the water to escape to the surface (Fig. 9(b)).② Salinity and DO are negatively correlated, due to oxygen consumption. Sufficient nutrients will promote the life activities of aquatic organisms, resulting in increased breathing and oxygen consumption. An increase in salinity will also promote DO to a level closer to saturation (Fig. 9(c)). ③High turbidity will reduce the photosynthesis of aquatic plants and affect the production of DO, so turbidity has a certain inhibitory relationship with the increase of DO(Fig.9(d)).④The oxygen content dissolved in water is also known as the oxygen saturation. When the oxygen exchange between water and the atmosphere is in equilibrium,the concentration of DO in the water is most similar to the fluctuation of oxygen saturation(Fig.9(e)).Mathematical modeling combined with AI technology can make a relatively scientific prediction of the changes in DO concentration. This prediction can provide useful guidance to people in related industries.

Fig. 8. Scatter plots of actual observations and corresponding forecasting results generated by the proposed model and other models.
This study proposes a novel hybrid model that can generate reliable DO forecasting results. The model takes temperature,salinity, turbidity, oxygen saturation, and many other factors closely related to DO as input variables,and finally outputs a DO forecasting result.Fig.9(f)shows the division of DO data and influence factors data. The specific multiple-input–single-output forecasting results are shown in Fig. 9. Potential applications for users of the proposed model are presented as follows:
· Aquaculture farmers can utilize the proposed DO forecasting model to determine future DO concentration changes in ponds and offshore aquaculture areas.They can then take corresponding emergency measures under guidance to reduce their economic losses.
· Fishery department managers can fully understand the situation of and trends in DO by means of accurate forecasting.This can provide a scientific decision-making basis for improving the living environment of marine life, which is conducive to the restoration and regulation of ecological water quality.
5. Conclusions
The development of DO forecasting technology has brought more possibilities to seafood farmers and related industries.Accurate real-time forecasting of DO can provide managers with scientific guidance for decision-making.Unfortunately,the instability of the marine DO series and various other potential factors present challenges to DO forecasting. In our study, a novel hybrid model is proposed for DO forecasting: the MF-RNNs-EWT-BEGOE. The main characteristics of this model include multi-factor analysis,adaptive decomposition, and a multi-model ensemble. After the analysis of the experimental results in the case study,the following conclusions can be drawn:
(1)Considering that many factors affect DO concentration in the ocean, a multi-factor analysis method is proposed to incorporate the effects of these factors on DO concentration. The influence of abundant physical, chemical, and biological systems makes the DO fluctuation mechanism more complicated. Reasonable multifactor consideration will make model forecasting more accurate.
(2) An adaptive data preprocessing decomposition method is used to reduce the instability of marine DO series, making subseries easier to predict.The experimental results demonstrate that this method of forecasting after decomposing the original series is effective.
(3)A novel multi-model ensemble method is proposed to complete the combination of multiple models, which can absorb the excellent quality of each benchmark model to make the ensemble model more mature. A comparison with the experimental results of multiple benchmark models shows that the complementary advantages of multiple models can indeed cause the performance of the ensemble model to develop in a better direction.
(4) Each component of the proposed hybrid model can significantly improve the model’s forecasting performance for DO. By detecting and eliminating outliers through RNNs, the negative impact of extreme outliers on the model can be reduced.The environmental factors that affect the change of DO can be considered more comprehensively through the multi-factor correlation analysis by GR. EWT adaptive decomposition effectively improves the forecasting accuracy of the model and reduces the impact of series non-stationarity.The BEGOE ensemble model combines the advantages of multiple benchmark models to maximize the model’s forecasting performance. Thus, the proposed hybrid model is significantly better than the other models used for comparison.

Fig. 9. DO vs input data change trend chart of the multiple–input–single–output model.
Given the potential for application described in Section 4, it is clear that accurate DO prediction can provide scientific guidance enabling aquaculture farmers to reduce their economic losses.Accurate DO forecasting can also provide a scientific basis for fishery department managers to help them improve the living environment of ponds and marine life.It can also help decision-makers to regulate and restore ecological water quality.The proposed hybrid model has excellent multi-step forecasting performance. The MIMOS mechanism provides sufficient information about future DO fluctuations for relevant industry personnel, thereby allowing effective management.
Acknowledgments
The study was fully supported by the National Natural Science Foundation of China(61873283),the Changsha Science&Technology Project(KQ1707017),and the innovation-driven project of the Central South University (2019CX005).
Compliance with ethics guidelines
Hui Liu,Rui Yang,Zhu Duan, and Haiping Wu declare that they have no conflict of interest or financial conflicts to disclose.
Appendix A. Supplementary data
Supplementary data to this article can be found online at https://doi.org/10.1016/j.eng.2020.10.023.
杂志排行
Engineering的其它文章
- The Intelligent Beijing–Zhangjiakou High-Speed Railway
- Mechanisms of Steatosis-Derived Hepatocarcinogenesis: Lessons from HCV Core Gene Transgenic Mice
- Microneedle Makers Seek to Engineer a Better Shot
- Battery Recycling Challenge Looms as Electric Vehicle Business Booms
- Global Top Ten Engineering Achievements 2021
- Biomedical Engineering: Materials, Devices, and Technological Innovation Continue to Build a Better Future for Humankind
