Gut Microbiota Community Shift with Severity of Coronary Artery Disease
2021-04-22JiLuHuZhiFengYoMinTngChunTngXioFnZhoXiSuDnBoLuQiuRongLiZhngShengWngYnYnZenengWng
Ji-Lu Hu, Zhi-Feng Yo, Min-N Tng, Chun Tng, Xio-Fn Zho, Xi Su, Dn-Bo Lu,Qiu-Rong Li, Zhng-Sheng Wng, Yn Yn,*, Zeneng Wng*
a Department of Cardiology, Zhongshan Hospital, Fudan University, Shanghai 200032, China
b Research Institute of General Surgery, Jinling Hospital, Medical School of Nanjing University, Nanjing 210002, China
c Department of Laboratory Medicine, Zhongshan Hospital, Fudan University, Shanghai 200032, China
d Department of Cardiology, The Fifth People’s Hospital of Shanghai, Fudan University, Shanghai 200240, China
e Department of Cardiovascular and Metabolic Sciences, Lerner Research Institute, Cleveland Clinic, Cleveland, OH 44195, USA
Keywords:Gut microbiota Atherosclerosis Coronary artery disease
ABSTRACT Gut microbiota community shift with coronary artery disease(CAD)has been reported in several limited cohorts during the past several years.However,whether the enriched or decreased microbiota taxa with CAD can be reproducible deserves further investigation and validation. In this study, 78 human subjects were recruited. Of these, 19 were diagnosed without stenosis in coronary artery(control group, referred to herein as Ctrl), 14 with stenosis less than 50% (LT50), and 45 with stenosis greater than 50% (GT50).Fecal samples were collected and DNA was extracted to perform 16S ribosomal RNA (rRNA) gene sequencing. The operational taxonomic units (OTUs) were analyzed to identify taxa specific to different groups;next,multivariate logistic regression was employed to test whether the defined taxa could independently predict CAD risk.We found that Deltaproteobacteria,Fusobacterium,Bilophila,Actinomyces,and Clostridium XIX were enriched in Ctrl;Prevotellaceae,Parabacteriodes,and Butyricicoccus were enriched in LT50; and Roseburia and Butyricimonas were enriched in GT50. Further analysis revealed that increased populations of Deltaproteobacteria, Fusobacterium, Bilophila, and Desulfovibrionaceae were associated with a 0.26-fold, 0.21-fold, 0.18-fold, and 0.26-fold decreased risk of CAD, respectively (p <0.05), and an increased Prevotellaceae population was associated with a 5.63-fold increased risk of CAD(p <0.01).A combination of the 20 microbial taxa achieved an area under the receiver operating characteristic (ROC) curve of higher than 0.88 for all discriminations between LT50 vs Ctrl, GT50 vs Ctrl,LT50+GT50 vs Ctrl,and GT50 vs Ctrl+LT50.However,the microbial taxa previously reported as enriched in CAD patients or healthy controls could not be observed in our cohort except for Bacteroides.In conclusion, CAD patients showed a different microbial taxa signature than the healthy controls. However, the non-reproducibility of the microbiota taxa enriched in CAD across different cohorts limits the use of this signature in early diagnosis and prevention.Only decreased Bacteroides abundance was found to be a reliable marker to indicate CAD progression.
1. Introduction
The gut microbiota plays an important role in human health.Trillions of microbes, mainly bacteria, inhabit the human gut, and help to train the human immunosystem, inhibit pathogenic bacterium growth, ferment undigested fiber to produce short-chain fatty acids(SCFAs),and produce vitamins[1–4].Due to the separation of gut-microbiota-derived metabolites from target sites, the gut is now regarded as an endocrine organ [5,6].
The gut microbiota controls adipose tissue expansion, the gut barrier, and glucose metabolism [7]. Under normal physiological conditions, pathogenic microbes and beneficial commensal microbes are in a balanced state. Once this balance is disrupted,the imbalance facilitates the growth of pathogenic microbes,which is called dysbiosis,leading to gut-microbiota-related diseases,such as stomach ulcers, inflammatory bowel disease, obesity, diabetes,non-alcoholic fatty liver disease (NAFLD), cirrhosis, colon cancer,allergy, cardiovascular disease (CVD), Alzheimer, autism,attention-deficit/hyperactivity disorder (ADHD), and Parkinson’s disease [8].
Recently, the involvement of the gut microbiota in CVD was noted, and the shift in the gut microbiota community with coronary artery disease (CAD) was reported by several groups [9–13].Different cohorts showed different community enrichment in CVD patients. In addition, the gut microbiota community can change with age and diet [14,15]. Thus, the association of the gut microbiota community with CVD requires further validation with more independent cohorts to make it possible to define which gut microbiota taxon is a reliable marker to link with CVD.
The gut microbiota involved in CVD is related to metabolites;so far,gut-microbiota-derived metabolites, including trimethylamine N-oxide (TMAO), p-cresyl sulfate, and indoxyl sulfate, have been investigated and were reported to be mechanistically causally linked to CVD [16–19]. Other gut-microbiota-derived metabolites,such as SCFAs, bile acids, and phytoestrogens, may play a protective role against CVD [16].
In this study, we compared the structure of the gut microbiota community among three groups based on stenosis in coronary artery. The results indicated that the gut microbiota community structure shifts with CAD progression, and several bacterium taxa can independently predict CAD risk. In addition,we validated previous reports on the gut microbiota community shift with CVD.
2. Materials and methods
2.1. Study population
A total of 381 patients with suspicious CAD were consecutively enrolled in this study from 1 April 2015 to 30 June 2015. Of these 381 patients,273 were excluded according to the following exclusion criteria: gastrointestinal ulcers, inflammatory bowel disease(Crohn’s disease or ulcerative colitis), hepatitis B or cirrhosis, cancer,organ failure,and other medical history;exposure to probiotics(including fermented dairy products, such as yogurt) or prebiotics within one month; receiving treatment with antibiotics, antacids,steroids, or anti-inflammatory drugs (except aspirin) within one month; suffering from constipation or diarrhea within one month; or receiving immunosuppressive or biological agents during the past six months.A total of 108 patients underwent coronary angiography;finally,78 patients with qualified fecal samples were included in the study.
The 78 eligible patients were divided into three groups:participants with no evidence of stenosis in coronary artery (the control group, referred to herein as Ctrl); participants with evidence of stenosis less than 50% (LT50); and participants with evidence of stenosis greater than 50% (GT50). The subjects in GT50 were defined as CAD patients. All subjects provided written informed consent. The Institutional Review Board of Zhongshan Hospital affiliated to Fudan University approved all study protocols (IRB#327).Fasting blood glucose,lipid profiles,enzymatic activities,bile acid, urea, and so forth were measured on the Abbott ARCHITECT platform (Abbott Diagnostics, USA).
2.2.Sample collection,DNA extraction,16S rRNA gene sequencing,and taxonomic analysis
Fresh fecal samples (~0.2 g each) were obtained from all the patients in hospital;these were then snap frozen in liquid nitrogen and stored at -80 °C until use. Bacterial DNA was isolated from feces using the QIAamp DNA Stool Mini Kit(QIAGEN,USA)following the manufacturer’s instructions. 16S ribosomal RNA (rRNA)gene V4 hypervariable regions were amplified using primers F357 + GC/R518 [20]. Polymerase chain reaction (PCR) products were purified with Agencourt AMPure beads (Beckman Coulter,USA).An aliquot(50 ng)of purified DNA was used for the construction of barcoded libraries with the Ion Plus Fragment Library Kit(Life Technologies, USA).
A sample-specific ‘‘DNA molecular tag (barcode),” which is a 14-base semi-random sequence, was intended to uniquely identify original template molecules. The DNA concentration of the libraries was estimated using a QubitTMdsDNA HS Assay Kit(Thermo Fisher Scientific Inc., USA). The libraries for each run were diluted to 26 pmol·L–1for template preparation. Emulsion PCR was carried out using the Ion OneTouch 200 Template Kit v2 (Life Technologies). Sequencing of amplicon libraries was conducted on 318 chips using the Ion TorrentTMPersonal Genome Machine (PGMTM) system with the Ion PGM Sequencing 200 Kit(Life Technologies). After sequencing, the individual sequence reads were filtered by the PGM software to remove low-quality and polyclonal sequences. All PGM quality-approved, trimmed,and filtered data were exported as FASTQ files. Sequences with a length between 150 and 220 base pairs and a mean quality score ≥20 were then aligned online to operational taxonomic units (OTUs) with the Cluster Database at High Identity with Tolerance (CD-HIT) [21]. OTUs were classified taxonomically using the Ribosomal Database Project (RDP) classifier with a 50% bootstrap threshold [22].
All procedures followed were in accordance with the ethical standards of the responsible committee on human experimentation (institutional and national). Informed consent was obtained from all patients included in the study.
2.3. Statistical analysis
The biodiversity and richness of OTUs were calculated following formulas, as reported previously [23]. Categorical variables were expressed as a percentage and compared using the χ2test between different groups. Student’s t test was used to compare the difference in mean value between different groups for most other studies,unless otherwise indicated.A web-based genome analysis tool,Galaxy,which is accessible from the Huttenhower lab†† http://huttenhower.sph.harvard.edu/galaxy/.[24,25],was used to analyze the microbial community discrimination among different groups.
Multivariate logistic regression models were developed to calculate odds ratios (ORs) and 95% confidence intervals (95% CI) of the prevalence of CAD for each taxon with an abundance above the median versus below the median using Statistical Package for the Social Sciences (SPSS) software (version 11.0.1). Adjustments were made for individual traditional cardiac risk factor or Framingham Risk Score and renal function.The overall predicting value and discriminatory ability of the final multivariate binary logistic regression analysis were assessed by the Hosmer–Lemeshow goodness-of-fit test and the area under the receiver operating characteristic (ROC) curve by SPSS.
The relative abundances of microbial taxa at the phylum, class,and genus levels were drawn by the R program(version 3.6.2)with the ggplot2 package installed.One-way Kruskal–Wallis analysis of variance (ANOVA) was used to compare the differences in the Chao1 index, Shannon index, Simpson index, and Evenness index among the three CAD phenotypes. The Wilcoxon rank sum test was used to compare the discrimination in microbial relative abundance between two different groups by the R program.Principal component analysis (PCA) and partial least square discriminant analysis (PLSDA) were performed by MetaboAnalyst[26].β diversity was determined by Bray–Curtis dissimilarity with permutational analysis of variance (PERMANOVA) to test the microbiome community structure difference among the three groups. An hierarchical clustering dendrogram plot using the β diversity defined by the Bray–Curtis dissimilarity and the ward clustering agglomeration method were performed by MicrobiomeAnalyst [27,28]. Goodness of prediction (Q2) and goodness of fit (R2) for PCA were calculated by the R program with the pcaMethods and pls packages, respectively.
For all statistical tests,p <0.05 was considered to be significant.
All methods were performed in accordance with the relevant guidelines and regulations.
3. Results
3.1. Baseline characteristics
The average ages of the three groups, Ctrl, LT50, and GT50,were (61.4 ± 7.5), (60.6 ± 10.8), and (61.7 ± 9.0) years with 68.4%, 64.3%, and 84.4% males, respectively (Table 1). The GT50 group had a significantly lower low density lipoprotein cholesterol(LDL-C)compared with the LT50 group.Triglyceride(TG)level is a risk factor for atherosclerotic CVD[29],and an elevated TG plasma level with atherosclerosis progression was observed in this study.Diabetes mellitus (DM) is a risk factor for CAD [30], where DM is defined as having a fasting glucose greater than 7.0 mmol·L-1or a history of DM.In our cohort,we observed that the DM rates in the LT50 and GT50 groups were significantly lower than those in the Ctrl group, although there was no significant difference in fasting glucose among the three groups. The high blood pressure (HBP)rate in GT50 was significantly lower than in the Ctrl. We saw no significant differences in other parameters among the three groups.
3.2. Richness (Chao1, Evenness) and α diversity (Shannon, Simpson)estimators of gut microbiota community structure
In this study, the bacterial community of the fecal samples was investigated using Illumina high-throughput sequencing. At a dissimilarity level of 3%, we identified a total of 164 690 OTUs with an average of 2111 (n = 78) OTUs per sample. The OTUs showed a decreasing trend with increasing severity of CAD, but the difference did not reach statistical significance, and the genus number did not show a significant difference among the three groups, suggesting that the α diversity of the controls was not significantly higher than that of the patients with CAD. This observation was further confirmed by a comparison of the Chao1 index, Shannon index, Simpson index, and Evenness index among the three groups, which showed no significant difference among the three CAD phenotypes for each parameter (Fig. S1 in Appendix A).
3.3. Gut microbiome β diversity
On the other hand, the gut microbiome similarity determination across samples based on β diversity using a multidimensional scaling plot (MDS) of the Bray–Curtis similarities showed that a relative separation was visible along the first axis,which accounted for 37.4%of the dimensional spread in the data.Using the PERMANOVA statistical method, the CAD phenotypes explained around 6.1% of the variation in microbial similarities (R2= 0.061,p < 0.01, Fig. 1(a)). The hierarchical clustering dendrogram(Fig. 1(b)) showed that the similarity was not related to their respective CAD phenotypes.

Table 1 Baseline characteristics and laboratory data of the study populations.
3.4. Differences in gut microbiota community structure
A further hierarchical clustering analysis was used to compare the similarity of the gut microbiome among the 78 patients. Multivariate unsupervised PCA (Fig. 2(a)) did not separate the three CAD phenotypes—that is, Ctrl, LT50, and GT50—from one another.The supervised PLSDA(Fig.2(b))showed the discrimination among the three CAD phenotypes with a Q2= 0.20, suggesting that the predictive ability of the model was very low. We then compared the gut microbiota community structure among the three groups at the phylum level and class level; the results showed that more than 95%of the bacterial populations were classified into four phylums, Actinobacteria, Bacteroidetes, Firmicutes, and Proteobacteria, and several classes, including Bacteroidia, Bacilli, and Clostridia(Fig. 3). The relative abundances of Firmicutes and Clostridia showed a significant increase and the relative abundance of Proteobacteria showed a significant decrease in LT50 compared with Ctrl (p <0.05). A total of 233 genera were detected for the 78 subjects combined;the ten most abundant genera from greatest to least, based on the average relative abundance in all three groups,are shown in Fig.4(a).Based on the discovery of three different enterotypes of human distal gut microbiota [31,32], we assessed whether the three different groups had different enterotype profiles. Fig. 4(b) shows that the proportions of Enterotype I and III decreased while those of Enterotype II increased with CAD pathogenesis. Furthermore, the enterotype profile showed a significant difference between the Ctrl group and the GT50 group(p = 0.04,χ2test). The Firmicutes to Bacteroidetes ratio (F/B ratio)has been reported to be associated with metabolic disease [33];however, in our study, we found that there was no significant difference in the F/B ratio among the three groups.The ratios(median(interquartile (IQR))) were 0.49 (0.37–0.61), 0.54 (0.44–0.64), and 0.47 (0.36–0.61) for Ctrl, LT50, and GT50 groups, respectively.
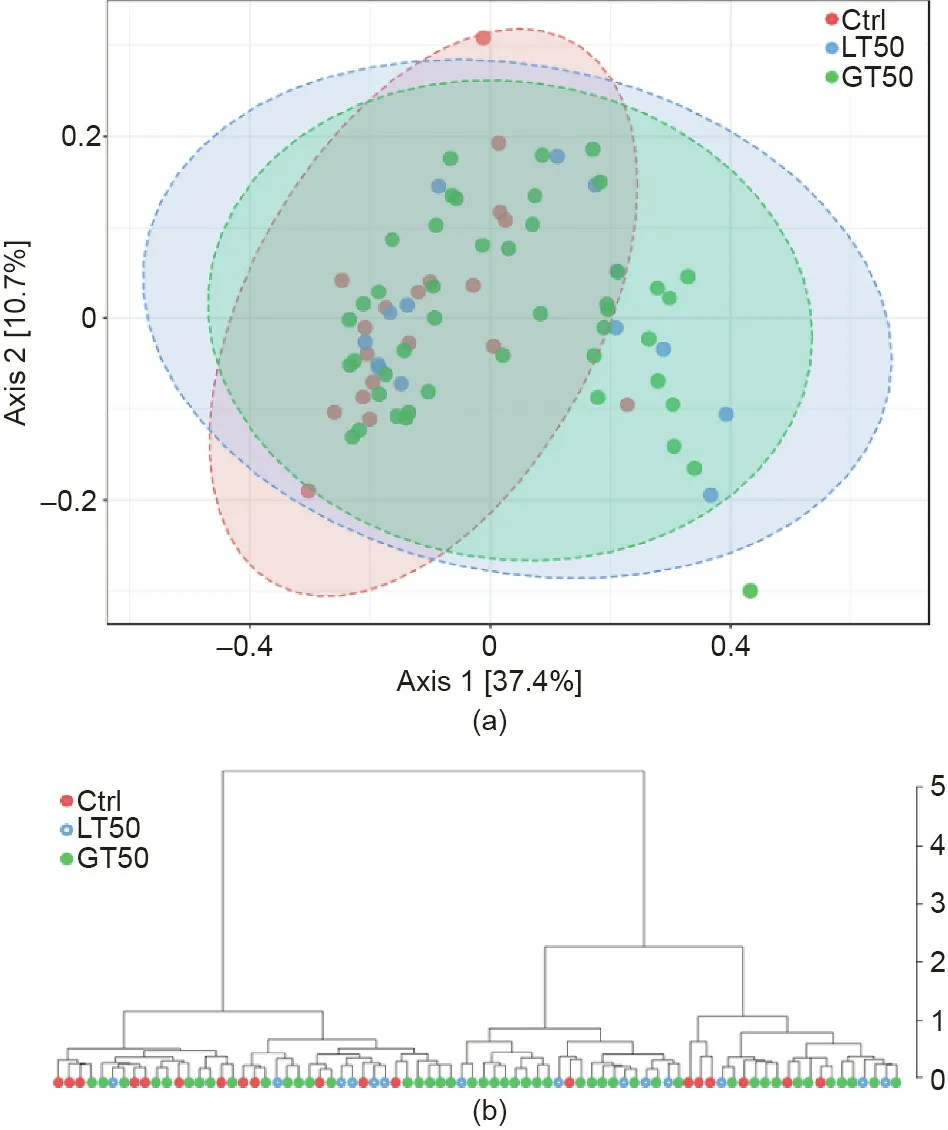
Fig. 1. (a) The β diversity of the gut microbiome visualized by CAD phenotypes.MDS plot based on the Bray–Curtis dissimilarities among the three CAD phenotypes: Stenosis <50% (LT50, n = 14), stenosis >50% (GT50, n = 45), and no stenosis(Ctrl, n = 19) are shown. PERMANOVA F = 2.42, R2 = 0.061, p <0.01. (b) The hierarchical clustering dendrogram uses the Bray–Curtis dissimilarity and the ward agglomeration method.
We further used the linear discriminant analysis (LDA) effect size (LEfSe) method to identify taxonomic units that could discriminate between different groups. In Fig. 5(a), a total of 20 bacterial taxa were differentially enriched in the Ctrl, LT50, and GT50 groups. In the fecal samples of the Ctrl group, 13 bacterial taxa were enriched: Bacteroidaceae (the family and its genus Bacteroides); Deltaproteobacteria (the class, its order Desulfovibrionales, its family Desulfovibrionaceae, and its genus Bilophila);Fusobacteria (the phylum, its class Fusobacteriia, its order Fusobacteriales,its family Fusobacteriaceae,and its genus Fusobacterium); the genera Actinomyces; and Clostridium XIX. In the LT50 group, the enriched bacteria were the family Prevotellaceae and four genera, Parabacteroides, Butyricicoccus, Clostridium sensu stricto,and Anaerobacter.Prevotellaceae and Parabacteroides belong to Bacteroidales and the other three genera belong to Clostridiaceae. In the GT50 group, the enriched bacteria were two genera,Roseburia and Butyricimonas; the former belongs to Firmicutes and the latter belongs to Bacteroidetes.
The relative abundance for each taxon identified above is shown in Fig.5(b).Since the class Deltaproteobacteria and its order Desulfovibrionales had the same abundance as its family Desulfovibrionaceae, the family Bacteroidaceae had the same abundance as its genus Bacteroides, and the phylum Fusobacteria and its class Fusobacteriia had the same abundance as its order Fusobacteriales,five relatively higher taxonomic levels of taxa were omitted in Fig. 5(b). The relative abundances of the genera Parabacteroides and Butyricimonas and the abundance of the family Prevotellaceae in the LT50 and GT50 groups were both significantly higher than those in the Ctrl group. The relative abundances of the family Desulfovibrionaceae, the genus Bacteroides, the order Fusobacteriales,its family Fusobacteriaceae,and its genus Fusobacterium were significantly lower in the LT50 and GT50 groups than in the Ctrl group. The relative abundance of the genus Roseburia in the GT50 group was significantly higher than that in the Ctrl group. The relative abundance of the genus Butyricicoccus in the GT50 group was significantly lower than that in the LT50 group.
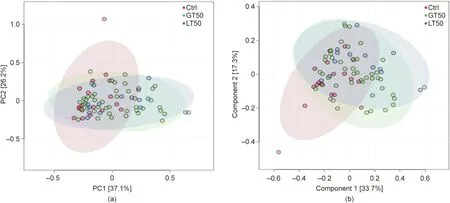
Fig. 2. Multivariate statistical analysis of human fecal microbial community discrimination. (a) PCA two-dimensional (2D) scores plots of the total cohort (R2 = 0.88,Q2 = 0.82). (b) Supervised PLSDA 2D scores plots showing the discrimination among three different CAD phenotypes: stenosis <50% (LT50), stenosis >50% (GT50), and no stenosis (Ctrl) (R2 = 0.85, Q2 = 0.20). PC: principal component.
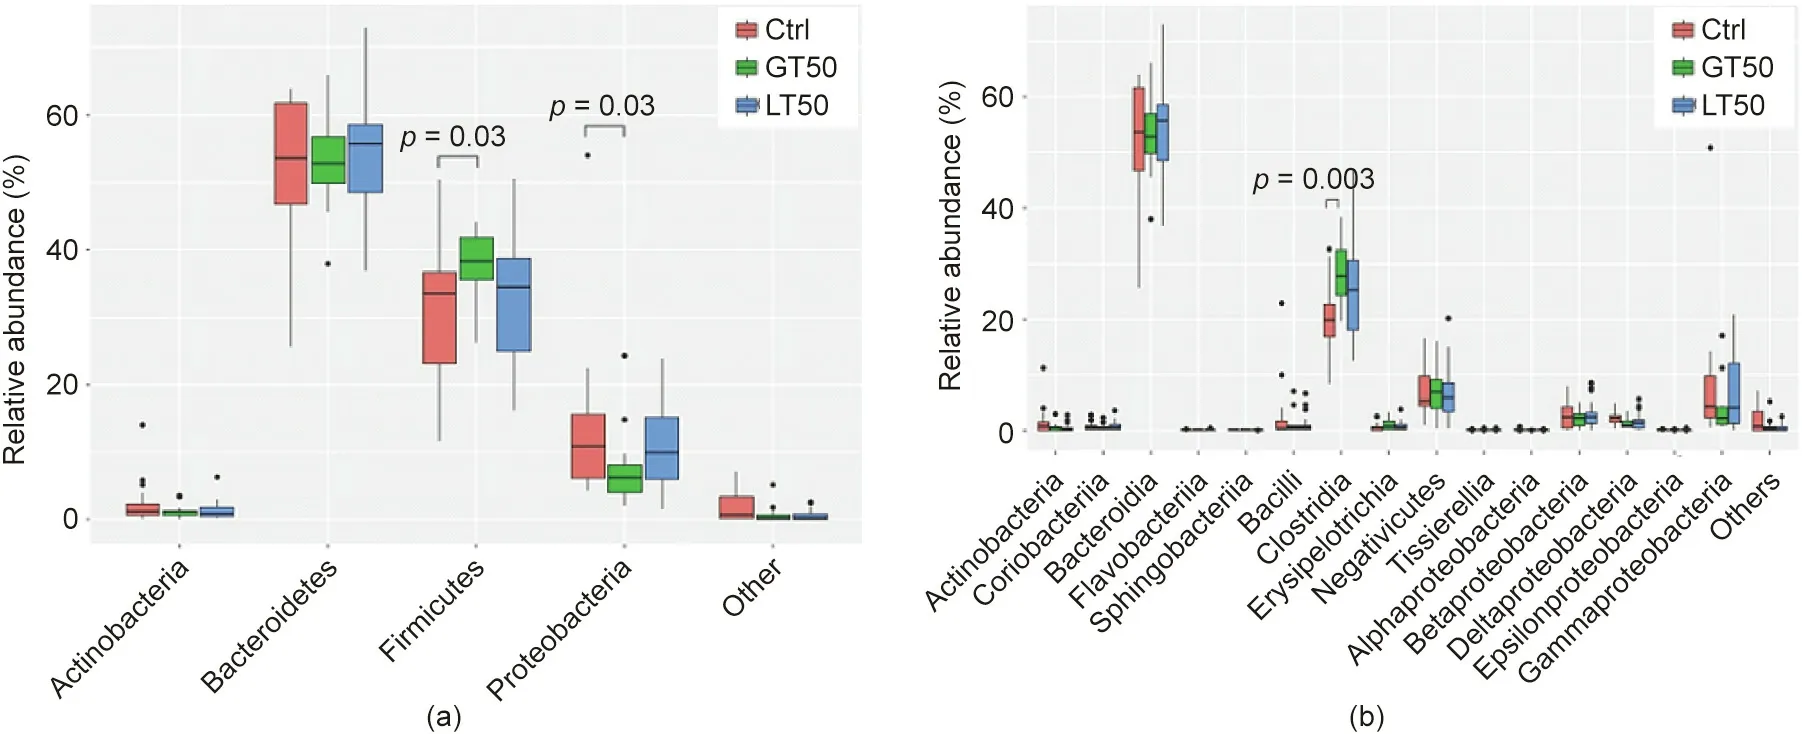
Fig.3. Fecal microbial comparison at the(a)phylum and(b)class levels among human subjects with three different CAD phenotypes:stenosis <50%(LT50),stenosis >50%(GT50), and no stenosis (Ctrl). The p values were calculated by the Wilcoxon rank sum test, and only p values less than 0.05 were labeled.
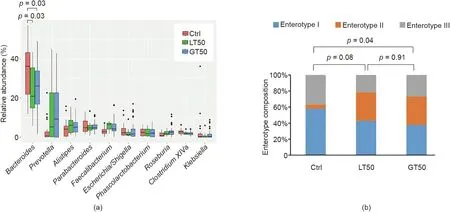
Fig. 4. Fecal microbial comparison at the genus level and enterotype composition. (a) Fecal microbial comparison at the genus level among human subjects with three different CAD phenotypes.Only the ten most abundant genera based on the total of all three groups were shown.The p values were calculated by the Wilcoxon rank sum test,and only those less than 0.05 were labeled.(b)Comparison of the enterotype composition among the three CAD phenotypes:stenosis <50%(LT50),stenosis >50%(GT50),and no stenosis (Ctrl). The p values were calculated by the χ2 test.
Using multivariate logistic regression analysis, we tested each gut microbiota taxon’s abundance mentioned above and its association with the CAD phenotype. As shown in Table 2, increasing abundance of Fusobacteria (the phylum, its class Fusobacteriia,its order Fusobacteriales,its family Fusobacteriaceae,and its genus Fusobacterium) and Bilophila was associated with a decreased likelihood of developing atherosclerosis; for example,human subjects with fecal Fusobacteria abundance at above median range were only 19% (95% CI: 4.1%–84%, p = 0.028) likely to develop LT50 and 26% (95% CI: 8.1%–80%,p = 0.02) likely to develop GT50. After adjustments for Framingham risk factors (age, sex, HBP, high density lipoprotein (HDL), LDL, and diabetes) and renal function, the traditional factors for CAD risk [34,35], the associations still existed, except for the association of Fusobacteriaceace and its genus Fusobacterium with LT50, suggesting that an increasing abundance of Fusobacteria and its sub-taxa was independently associated with a decreased risk for CAD. The increased relative abundance of taxa Deltaproteobacteria and Clostridium XIX was significantly associated with the absence of CAD (i.e., GT50), even after adjustment for Framingham risk factors and renal function,but was not significantly associated with the absence of LT50,since participants in the LT50 group were in an early progression stage of CAD,suggesting the roles of the two taxa in reducing atherosclerosis risk. On the other hand, increased Prevotellaceae or Parabacteroides abundance was independently associated with an increased likelihood of developing LT50 or GT50, suggesting that the two taxa may be pro-atherogenic. In contrast, Fusobacteria,Deltaproteobacteria, Bilophila, and Clostridium XIX may be antiatherogenic and can function as probiotics.
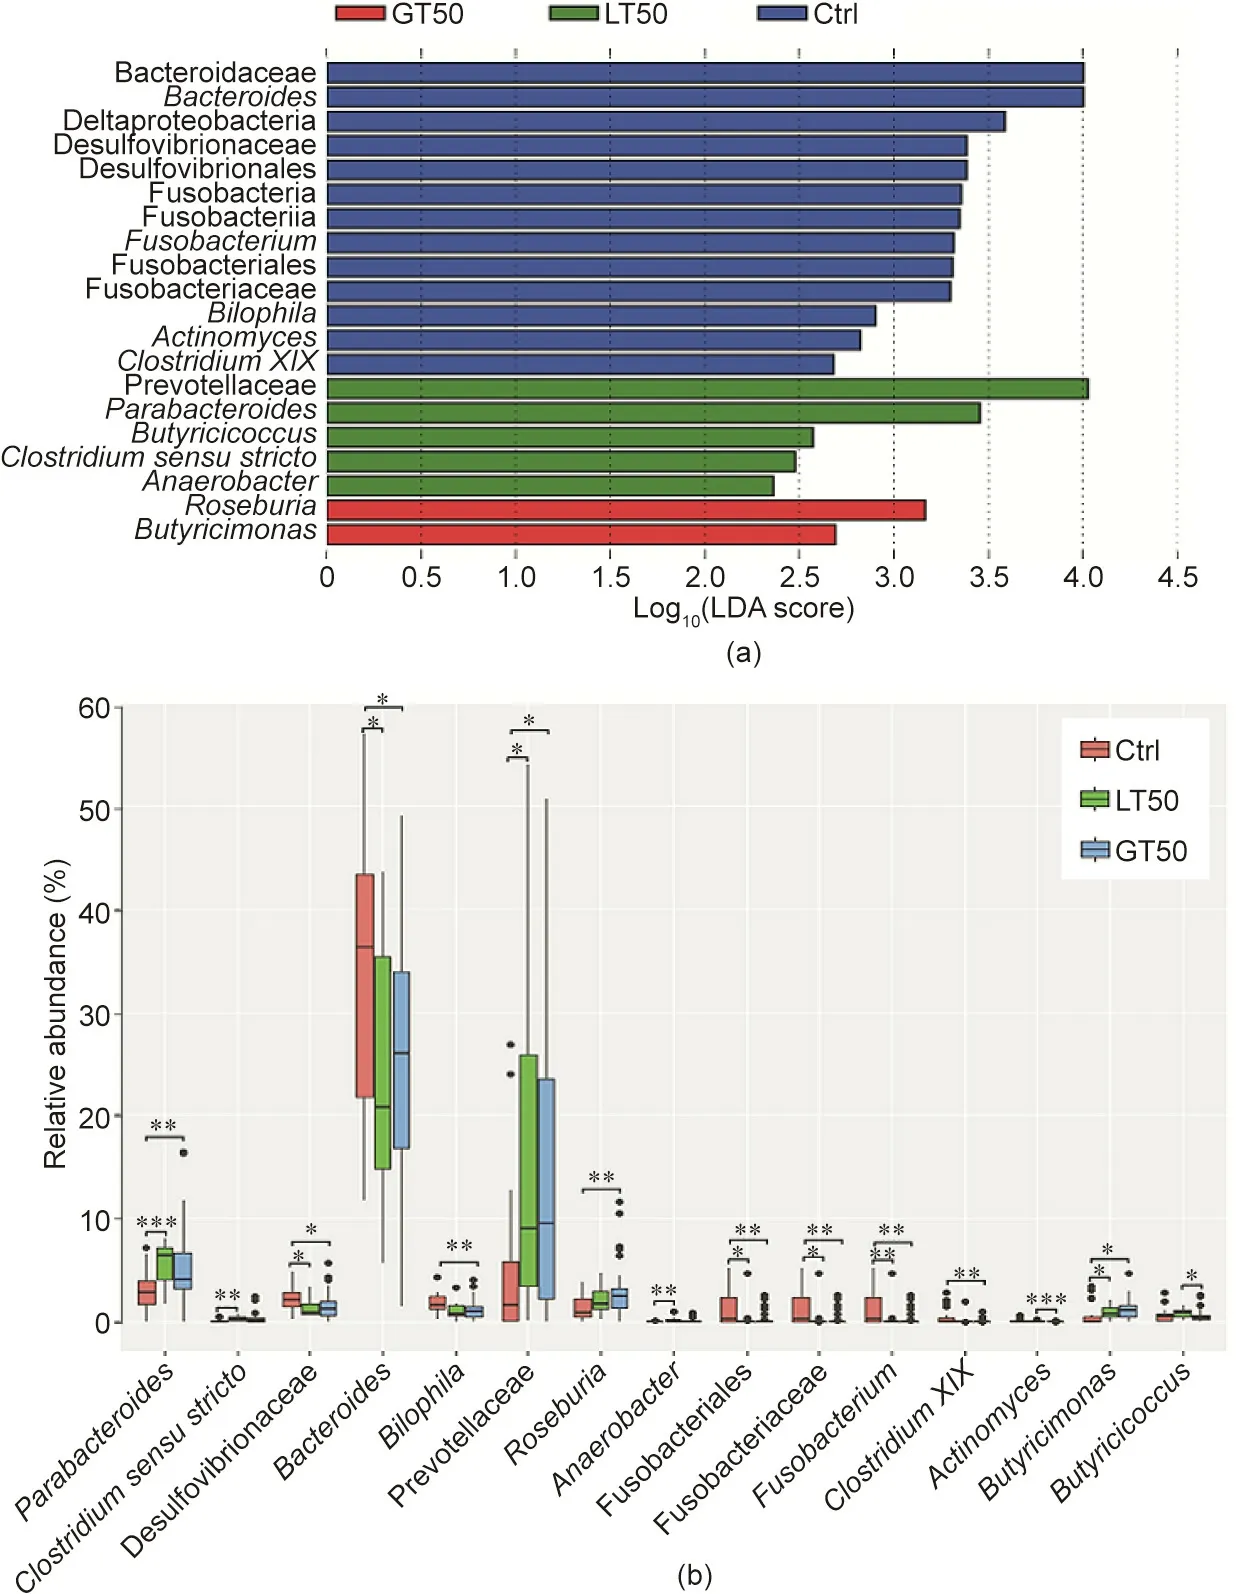
Fig.5. Characteristics of microbial community composition in human participants with three different CAD phenotypes.(a)LEfSe identified fecal microbial taxa enriched in different CAD phenotypes, LT50 and GT50 vs Ctrl (p <0.05 by the Kruskal–Wallis test, log10(LDA score) >2). (b) Relative abundances of the identified microbial taxa:stenosis <50%(LT50),stenosis >50%(GT50),and no stenosis(Ctrl).*p <0.05,**p <0.01,and***p <0.001 were significantly different according to the Mann–Whitney U test.
To further investigate the predicting value of the bacterial signature comprising 20 taxa identified by LEfSe for the different CAD phenotypes, the Hosmer–Lemeshow test was used to determine the goodness of fit of the binary logistic regression model between the 20 microbial taxa abundances and the CAD phenotype, and the area under the ROC curve (AUC) was used to assess the discrimination. Fig. 6(a) shows an AUC of 1.00 for LT50 vs Ctrl and a p value of 1.00 in the Hosmer–Lemeshow goodness-of-fit test(χ2= 0, degree of freedom (df) = 7), which suggests that the combined 20 microbial taxa signatures can perfectly discriminate between LT50 and Ctrl. Fig. 6(b) shows an AUC of 0.97 (95% CI:0.92–1.02, p <0.001) for GT50 vs Ctrl and a p value of 0.13 in the Hosmer–Lemeshow goodness-of-fit test (χ2= 12.4, df = 8), which suggests that the combined 20 microbial taxa signatures can discriminate between GT50 vs Ctrl. Fig. 6(c) shows an AUC of 0.95(95% CI: 0.89–1.01, p = 0.03) for LT50 + GT50 vs Ctrl and a p value of 0.78 in the Hosmer–Lemeshow goodness-of-fit test (χ2= 4.8,df=8),which suggests that the combined 20 microbial taxa signatures can discriminate between LT50 + GT50 and Ctrl. Fig. 6(d)shows an AUC of 0.88 (95% CI: 0.80–0.96, p = 0.04) for GT50 vs Ctrl + LT50 and a p value of 0.12 in the Hosmer–Lemeshow goodness-of-fit test (χ2= 12.7, df = 8), which suggests that the combined 20 microbial taxa signatures can discriminate between GT50 vs Ctrl + LT50. By selecting the maximum value of the Youden index for the ROC curve, we found that the prediction accuracy was 100%, 95.3%, 88.4%, and 87.2%, respectively, for the combined 20 microbial taxa to discriminate between LT50 vs Ctrl,GT50 vs Ctrl, LT50 + GT50 vs Ctrl, and GT50 vs Ctrl + LT50,respectively.
3.5. Validation of the reproducibility of previously found gut microbiota community enrichment in CAD
Several taxa were previously reported to be abundant in CAD patients. Jie et al. [36] compared fecal microbes between 218 individuals with atherosclerotic cardiovascular disease (ACVD)and 187 healthy controls,and found that ACVD was enriched with Enterobacteriaceae and Streptococcus spp.Our data did not support the enrichment of Enterobacteriaceae or Streptococcus spp.in CAD,which showed an abundance(median(IQR))of Enterobacteriaceae of 0.039 (0.023–0.086), 0.017 (0.010–0.036), and 0.037 (0.008–0.105), and of Streptococcus spp. of 0.0024 (0.0016–0.0038),0.0032 (0.0016–0.0072), and 0.0028 (0.0013–0.0055) in the Ctrl,LT50, and GT50 groups, respectively. Different groups showed no significant difference according to the Wilcoxon rank sum test.Jie et al. [36]also reported that Bacteroides spp.showed decreased abundance with ACVD, which was consistent with our findings that the genus Bacteroides relative abundances in LT50 (median(IQR): 0.21 (0.13–0.36)) and GT50 (median (IQR): 0.26 (0.16–0.34)) were significantly decreased compared with the Ctrl group(median (IQR): 0.36 (0.17–0.43)). Yin et al. [37] compared fecal microbiota community differences between patients with largeartery atherosclerotic stroke or transient ischemic attack (TIA)and healthy controls, and also found decreased Bacteroides abundance with stroke/TIA. Thus, it seems that Bacteroides protects against CVD.
Roseburia was reported to decrease with increased atherosclerosis symptoms [38], and the colonization of Roseburia intestinalis in germ-free apolipoprotein E (ApoE)-null mice could modulatececal butyrate accumulation, lower systemic inflammation, and ameliorate atherosclerosis[39].However,in our study,we noticed that fecal Roseburia abundance was significantly higher in the GT50,CAD group than in the Ctrl group,and that it showed a trend of increasing with atherosclerosis progression(ANOVA,p =0.002).The abundance (mean ± standard deviation (SD)) of the three groups, Ctrl, LT50, and GT50, was 0.014 ± 0.003, 0.022 ± 0.004,and 0.028 ± 0.004, respectively.

Table 2 Odds ratio (95% CI) of coronary atherosclerosis phenotypes according to gut microbiota community abundance.
4. Discussion
Dietary habits are important determinants of commensal bacteria clustering, also named as enterotype [40]. Enterotype II is enriched in vegetarian subjects [41]. In our study, we found that Enterotype II was enriched in CAD, which is contrary to an early report from Emoto et al. [10]. A vegetarian diet confers health benefits [41]. The increased Enterotype II with CAD might be due to active dietary modulation based on patients’knowledge.In fact,De Filippis et al. [42] reported that Prevotella oligotypes show discrimination between vegetarians and omnivores, and omnivore diet-associated oligotypes have been found to be positively correlated to circulating levels of TMAO[43],a pro-atherogenic metabolite for atherosclerotic CVD and thrombosis development [44,45].Emoto et al. [10] reported that Enterotype II decreases with CAD pathogenesis, which could be due to decreased vegetarian-associated Prevotella oligotypes. Our findings of an increased Enterotype II with CAD may be due to increased vegetarian-associated oligotypes.Further demonstration of the relationship between Enterotype II and CAD risk should be focused on the Prevotella oligotype composition or strain levels.
CAD is a chronic inflammatory disease, and the gut microbiota has become a novel therapeutic target to reduce the inflammatory process by producing bioactive metabolites, such as SCFAs, protocatechuic acid, bile acids, and enterolactone [16,46]. Different microbiota communities show different effects on inflammation,including pro-, anti-, or no effect, so the association between the gut microbiota and ACVD has become a hot topic. Thus far, a very limited number of papers have reported on the association between gut microbiota abundance and CVD. In one paper, it was reported that the order Lactobacillales was significantly increased and the phylum Bacteroidetes was decreased in CAD patients compared with controls [10].
In our study,we used LefSe-Galaxy and identified 20 bacterium taxa that were associated with the prevalence of CAD. Furthermore, we used multivariate logistic regression and confirmed that the abundance of the taxa Fusobacteria/Fusobacteriia/Fusobacteriales/Fusobacteriaceae/Fusobacterium, Biolophila, and Clostridium XIX was negatively associated with CAD risk and that the abundance of Prevotellaceae and Parabacteroides was positively associated with CAD risk. We also found that the nine taxa mentioned here can independently predict CAD risk.
We did not find any significant difference in the order Lactobacillales between CAD patients and the controls. We did observe that the family Bacteroidaceae and its genus Bacteroides were decreased in CAD patients. Using multivariate logistic regression,we noticed that an increased family Bacteroidaceae and its genus Bacteroides were associated with reduced coronary artery patients with GT50 only after adjustment of the Framingham risk factors and renal function(Table 2).Lactobacillales is regarded as a probiotic since it can ferment food to produce lactic acid[47].Therefore,the previous report on an increased order Lactobacillales in CAD patients was not reproducible in this study, which could be expected. Bacteroides species can ferment undigestive polysaccharides into small molecules, such as bioactive SCFAs [48]. SCFAs have anti-inflammatory properties and are helpful for maintaining cardiovascular health[49].Acetic acid and propionic acid can modulate blood pressure via olfactory receptor 78 (OLFR78) [50,51]. A previous report also mentioned that the abundance of Bacteroides decreased in patients with artery atherosclerotic stroke or TIA[37]. Thus, a decreased Bacteroides abundance may be a reliable indicator of CAD.
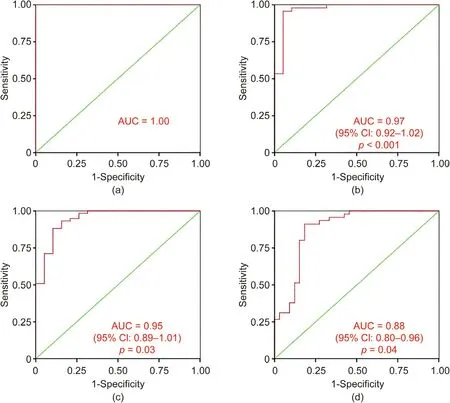
Fig. 6. ROC curve from the binary logistic regression model for the predication probability of CAD with the Hosmer–Lemeshow goodness-of-fit test. A combination of the bacterial signature comprising 20 taxa identified by LEfSe achieved an AUC higher than 0.88 for all the cross-sectional comparisons. (a) LT50 vs Ctrl; (b) GT50 vs Ctrl;(c) LT50 + GT50 vs Ctrl; (d) GT50 vs Ctrl + LT50.
Fusobacterium nucleatum induces mucin secretion and tumor necrosis factor (TNF)-α expression, leading to gut diseases such as inflammatory bowel disease (IBD) [52]. On the other hand,Fusobacteria and its sub-taxa seem to be anti-atherogenic. A species of Fusobacteria, Fusobacterium nucleatum, which is a Gramnegative anaerobe that is prevalent in periodontal disease, was reported to be atheroprotective for ApoE-null mice through modulation of the host immune response and atherosclerotic risk factors[53,54].Whether Fusobacteria leads to pathogenesis or has a beneficial effect is dependent on the bacterial community it interacts with [54].
Bilophila and Clostridium XIX also show a decrease with CAD risk. Bilophila, a genus of Desulfovibrionaceae, increases with an animal diet[55].Some species of Bilophila can reduce sulfite to produce H2S,leading to T-cell activation and increased gut permeability [56,57], which is expected to increase the likelihood of CAD.Therefore, a reduced Bilophila abundance in CAD patients might be due to dietary habit adjustment, and should not be used as a reliable marker to assay CAD risk. One group compared the gut microbiota community structure between major depressive disorder patients and healthy controls and reported that Clostridium XIX was one of the genera found to be higher in patients than in healthy controls [58]. Thus, reduced Clostridium XIX abundance with CAD requires further confirmation.
Prevotellaceae and Parabacteroides are two taxa that are positively associated with CAD risk.In the gut,the Prevotellaceae family can be enriched with dietary carbohydrates and is responsible for polysaccharide breakdown [59–61]. The Prevotellaceae family produces succinate, which is increased in hypertension, ischemic heart disease,and type 2 diabetes,and is regarded as a metabolite signature of CVD risk driven by the gut microbiome [61,62].Prevotellaceae was reported to increase after dietary supplementation with probiotic Lactobacillus [63]. In uremic rat, both Lactobacillaceae and Prevotellaceae were found to be decreased [64],showing a positive correlation between the two taxa.Patients with Parkinson’s disease show a reduced abundance of Prevotellaceae[62,65]. An independent report by Jeffery et al. [66] stated that high abundance of Prevotellaceae in the gut is associated with reduced risk of developing immune-mediated brain disease,which suggests that this taxon has some beneficial effects. Parabacteroides was increased in mouse gut after feeding with alcohol[67]. One species of Parabacteroides, Parabacteroides goldsteinii,was reported to be an anti-inflammatory bacterium, and was decreased in mice fed with a choline-deficient amino acid(CDAA)-defined diet, which develops steatohepatitis [68]. One group compared gut microbiota community structure between multiple sclerosis patients and healthy controls,and reported that Parabacteroides was higher in the healthy controls. Thus, it seems that Parabacteroides should be regarded as a probiotic [69].Lingonberries can increase the cecal relative abundance of Parabacteroides[70]. In addition,Parabacteroides is related to SCFA production. Pectin can increase the abundance of this taxon [71],so the enriched Parabacteroides in LT50 may be the effect of diet switching for CVD patients, which will be helpful for attenuation of atherosclerosis progression. Therefore, Parabacteroides is probably not the cause leading to CAD.
Clostridium sensu stricto shows an increase in abundance with CAD pathogenesis. Many species in the genus Clostridium can utilize choline to produce trimethylamine, which contributes to production of a pro-atherogenic agent, TMAO. Thus, an enriched genus Clostridium will lead to ACVD. However, after the logistic regression assay, an increased population of this taxon was only significantly associated with an increased frequency of LT50, not with GT50. In addition, after adjustment for Framingham risk factors and renal function, the significant association between this taxon abundance and LT50 frequency disappeared (Table 2). This finding suggests that multiple factors modulate the abundance of this taxon. Nevertheless, we can say that Clostridium sensu stricto may be involved in the modulation of multiple factors related to atherosclerotic CVD.
LT50 is the early atherosclerosis development stage, while GT50 is the further progression stage of atherosclerosis development. Most of the taxa mentioned above show nearly the same tendency changes compared with the controls, suggesting that the CAD-related gut microbiota may be stably limited to several taxa.
Whether the association between the defined gut microbiota taxa and CAD is the cause or the effect requires further investigation.Usually,probiotic community decrease in the gut is the cause that leads to a disease. However, some unexpected results related to CAD exist, such as the previous reported increased Lactobacillales in CAD patients [10] and the currently reported increased Prevotellaceae and Parabacteroides.
The association of the gut microbiota with CAD is an interesting and important area that deserves further investigation. Based on our data and on previously published data [12], only reduced Bacteroides is a reliable indicator for CAD pathogenesis. Thus, treating heart disease by increasing Bacteroides abundance through the optimization of diet composition may become a promising therapeutic treatment.
5. Conclusions
The gut microbiota links to CAD progression and can potentially be used to diagnose CAD prevalence. However, the microbial taxa associated with CAD are not always reproducible across different cohorts, and only the reduced Bacteroides is a reliable indicator for CAD prevalence.
Acknowledgments
This study was supported in part by the Shanghai Xuhui District Science and Technology Commission, Artificial Intelligence Project 2 for Jia-Lu Hu; Shanghai Public Health Talents Training Project(GWV-10.2-YQ11) for Jia-Lu Hu; the National Natural Science Foundation of China (81873538) for Yan Yan; and the National Heart, Lung, and Blood Institute and the Office of the Director,National Institutes of Health (RO1HL130819) for Zeneng Wang.
Compliance with ethics guidelines
Jia-Lu Hu, Zhi-Feng Yao, Min-Na Tang, Chun Tang, Xiao-Fan Zhao, Xi Su, Dan-Bo Lu, Qiu-Rong Li, Zhang-Sheng Wang, Yan Yan, and Zeneng Wang declare that they have no conflict of interest or financial conflicts to disclose.
Appendix A. Supplementary data
Supplementary data to this article can be found online at https://doi.org/10.1016/j.eng.2020.05.025.
杂志排行
Engineering的其它文章
- The Intelligent Beijing–Zhangjiakou High-Speed Railway
- Mechanisms of Steatosis-Derived Hepatocarcinogenesis: Lessons from HCV Core Gene Transgenic Mice
- Microneedle Makers Seek to Engineer a Better Shot
- Battery Recycling Challenge Looms as Electric Vehicle Business Booms
- Global Top Ten Engineering Achievements 2021
- Biomedical Engineering: Materials, Devices, and Technological Innovation Continue to Build a Better Future for Humankind
