Hybrid Method to Identify Second-trip Echoes Using Phase Modulation and Polarimetric Technology
2021-04-20ShuaiZHANGJinzhongMINChianZHANGXingyouHUANGJunLIUandKaihuaWEI
Shuai ZHANG, Jinzhong MIN*, Chian ZHANG, Xingyou HUANG, Jun LIU, and Kaihua WEI
1Key Laboratory of Meteorological Disaster of Ministry of Education, Nanjing University of Information Science and Technology, Nanjing 210044, China
2Beijing Metstar Radar Co. Ltd., Beijing 100094, China
3Taizhou Meteorological Administration, Taizhou 225400, China
4Guangdong Meteorological Observatory, Guangzhou 510080, China
(Received 7 July 2020; revised 2 October 2020; accepted 19 October 2020)
ABSTRACT For pulse Doppler radars, the widely used method for identifying second-trip echoes (STs) in the signal processing level yields significant misidentification in regions of high turbulence and severe wind shear. In the data processing level,although the novel algorithm for ST identification does not yield significant misidentification in specific regions, its overall identification performance is not ideal. Therefore, this paper proposes a hybrid method for the identification of STs using phase modulation (signal processing) and polarimetric technology (data processing). Through this approach, most of the STs are removed, whereas most of the first-trip echoes (FTs) remain untouched. Compared with the existing method using a signal quality index filter with an optimized threshold, the hybrid method exhibits superior performance (Heidke skill scores of 0.98 versus 0.88) on independent test datasets, especially in high-turbulence and severe-wind-shear regions, for which misidentification is significantly reduced.
Key words: second-trip echo, phase modulation, polarimetric radar, wind shear
1. Introduction

R
) can be calculated from the relation wherec
is the speed of light, and PRT is the pulse repetition time [the reciprocal of the pulse repetition frequency(PRF)]. However, if the distance between the radar and target exceedsR
, an additional pulse will be transmitted before the echo of a given pulse reaches the radar. In that case, the radar cannot relate the echo with the transmitted pulse from which it originated. This problem is called range ambiguity, and the echo received by the radar under this condition is called a second-trip echo (ST). Doppler radar can measure the radial velocity of a target using the Doppler effect (Doviak and Zrnić, 2006). The maximum unambiguous velocity (V
) can be calculated from
where λ is the radar wavelength. Equations (1) and (2) can be combined to yield

λ
has been determined, a direct increase inR
tends to decreaseV
. This phenomenon is called the Doppler dilemma and is an intrinsic weakness of pulse Doppler radar (Doviak and Zrnić, 2006). Therefore, certain special techniques are necessary to resolve the range ambiguity and achieve desirable performance.Initially, range ambiguity was resolved to a certain extent by optimizing the scanning strategy. Taking volume coverage pattern 21 of the Weather Surveillance Radar-1988 Doppler (WSR-88D) as an example, additional scans with long PRT were performed at lower elevation angles,and batches of long PRT pulses were alternated with batches of short PRT pulses at the middle elevation angles(OFCMSSR, 2006). With the development of electronic and computer technology, the range ambiguity problem has become increasingly resolved in the signal processing level.At present, phase diversity is a widely used approach in this level. In this approach, successive pulses with different phases are transmitted through random modulation (Zrnić and Mahapatra, 1985) or systematic coding (Sachidananda and Zrnić, 1999); hence, the phases of the returned echoes differ from one pulse to the next. Using this characteristic, the STs can be separated from the first-trip echoes (FTs) and recovered into their real ranges. Through various studies, it has been proven that the method of systematic coding is superior to that of random modulation (Sachidananda and Zrnić,1999, 2003; Bharadwaj and Chandrasekar, 2007). Recently,a novel algorithm targeting at the data processing level was proposed by Park et al. (2016) (hereafter referred to as P16)to identify STs using polarimetric radar measurements. In this algorithm, several polarimetric features that can characterize STs to a certain extent are combined using fuzzy logic technology to obtain the final identification results. The main advantage of this method is that it does not require the special capabilities of a radar system (e.g., a hardware capability of controlling phase).
A considerable amount of research (Zrnić and Mahapatra, 1985; Sachidananda and Zrnić, 1999, 2003;Frush et al., 2002; Bharadwaj and Chandrasekar, 2007; Cao et al., 2012) has shown that the phase diversity approach yields superior range ambiguity resolution. Although systematic coding performs better than random modulation, random phase processing algorithms have been integrated into some commercial radar signal processors (e.g., RVP900;Vaisala, 2014), making them more widely applicable.However, when the random phase processing algorithm is activated, “holes ” commonly appear in radar data for regions having high turbulence and severe wind shear (Vaisala, 2014). This phenomenon occurs because there is a considerable risk of FTs being misclassified as STs and eliminated from the radar data in the case of a large Doppler spectrum width, and such a large Doppler spectrum width is a salient characteristic of turbulence and wind shear regions(Fang et al., 2004). In addition, although P16 does not yield significant misidentification in specific regions, unlike the random phase processing algorithm, its overall identification performance must be further improved because of the lack of features that can significantly distinguish STs from FTs. To resolve the range ambiguity problem more effectively, the complementary advantages of these two methods must be exploited. Therefore, this paper proposes a hybrid method to identify STs with phase modulation (signal processing) and polarimetric technology (data processing),through which most of the STs are removed whereas the FTs are almost untouched, especially for the FTs in high-turbulence and severe-wind-shear regions.
The remainder of this paper is organized as follows: Section 2 briefly describes the radar systems used in this study and the necessary pre-processing of radar data. Section 3 provides a detailed explanation of the proposed algorithm,and section 4 reports the algorithm performance evaluation results. Finally, section 5 provides the conclusions.

Table 1. Main parameters of NUIST-CDP and NJ-SD.
2. Data
2.1. Instruments
Radar data collected by a C-band dual-polarization Doppler weather radar, owned by the Nanjing University of Information Science and Technology (NUIST-CDP), were adopted in this study. The main parameters of NUIST-CDP are listed in Table 1 [for more details on NUIST-CDP, see Chu et al. (2017)]. The available measurements include the reflectivity factor at the horizontal polarization (Z
), Doppler velocity (V
), Doppler spectrum width (W
), differential reflectivity (ZDR), differential propagation phase shift(PhiDP), co-polar correlation coefficient (CC), signal-tonoise ratio (SNR), and signal quality index (SQI). Considering the spatiotemporal resolution and data quality (e.g., the power attenuation and the estimation accuracy of radar variables) of the radar, theR
of NUIST-CDP is set to 150 km.Therefore, range ambiguity inevitably occurs at lower elevation angles during large-scale precipitation events (e.g.,squall lines and stratiform precipitation). In addition,NUIST-CDP is equipped with a RVP900 Vaisala radar signal processor (Vaisala, 2014), which can randomly modulate the phases of the transmitted pulses and filter and recover the STs.Another radar involved in this study was the S-band Doppler weather radar deployed at the city of Nanjing (NJ-SD),which is part of the Chinese operational weather radar network (Min et al., 2019). Table 1 also lists the main parameters of NJ-SD, which are similar to those of WSR-88D(Crum and Alberty, 1993). Compared with the NUIST-CDP data, the NJ-SD data are not commonly contaminated with STs becauseR
is sufficiently large (up to 460 km at lower elevation angles). The distance between NUIST-CDP(32.21°N, 118.72°E) and NJ-SD (32.19°N, 118.7°E) is less than 3 km; thus, these two radar systems can be considered to be at the same position in the context of large-scale precipitation events. Therefore, the STs in NUIST-CDP data can be accurately located through a qualitative comparison with echoes from the NJ-SD data, which was a considerable advantage when selecting NUIST-CDP datasets for algorithm development (Table 2) and testing (Table 3) in this work.
Table 2. List of cases from NUIST-CDP used for development of the hybrid method.
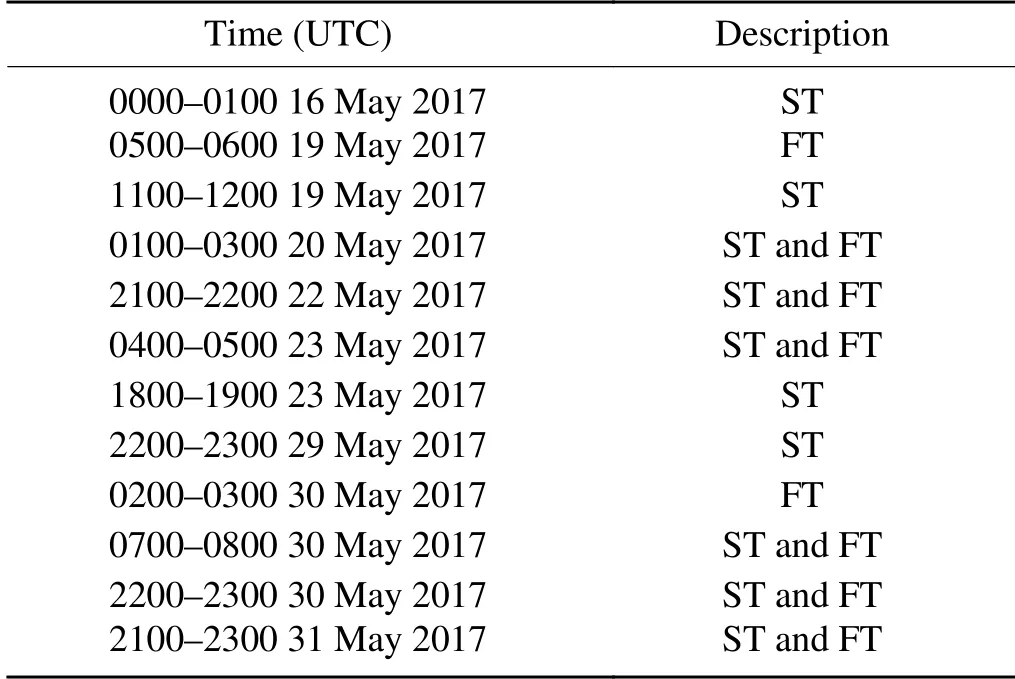
Table 3. List of test cases from NUIST-CDP for evaluating the performance of the hybrid method.
2.2. Pre-processing
To obtain the desired ST identification performance, several preprocessing steps for the NUIST-CDP data were necessary, which can be summarized as follows:
(1)Z
was calibrated through comparison with spaceborne and adjacent ground-based radar systems (Han et al.,2017; Li et al., 2017);(2) ZDR was calibrated using the vertical pointing method (Gorgucci et al., 1999; Bringi and Chandrasekar,2001);
(3) Non-meteorological echoes (e.g., ground clutter,anomalous propagation, and clear-air echoes) and noise(i.e., data with SNR of less than 5 dB) were identified and eliminated using the method proposed by Zhang et al.(2020);
(4) The method proposed by Gourley et al. (2006) was adopted to resolve the phase folding of PhiDP.
Note that, although NUIST-CDP is a C-band radar system and attenuation is inevitable when convective precipitation or large-scale stratiform precipitation events occur,Z
and ZDR were not attenuation-corrected because of interference from the STs.3. Method
The hybrid method consists of two submodules: a signal processing submodule employing phase modulation and a data processing submodule implementing polarimetric technology and post-processing.
3.1. Signal processing
3.1.1.Random phase processing algorithm
Figure 1 shows schematics that briefly elucidate the random phase processing algorithm through the Doppler spectrum processing flow [for more details, see Zrnić and Mahapatra (1985)]. As shown in Fig. 1a, when a fully coherent radar system (e.g., NUIST-CDP) transmits pulses without special processing, the echoes are coherent regardless of whether they are FTs or STs. However, when the pulses are transmitted with a random phase shift (i.e., after phase modulation), the echoes are coherent with the pulses that cause them but are incoherent with other pulses. Therefore, as shown in Fig. 1b, when the FTs (STs) are coherently processed, the STs (FTs) appear as white noise in the Doppler spectra. As the strong echo generates noise that obscures the weaker echo (the FT is stronger than the ST in the example shown in Fig. 1; however, the reverse may also occur in practice), a band-rejection filter was adopted to filter the recohered echo from the other trip (Fig. 1c). After rejection, as shown in Fig. 1d, a subsequent residue recohering process was adopted to recover the incoherent echoes.Although residual noise caused by the overlaid signal persisted, the ratio between the desired and overlaid signals was enhanced through this approach.
Although the RVP900 Vaisala radar signal processor can filter and recover STs, it was set to perform phase modulation only for NUIST-CDP instead of the whole processing flow. This choice was made because NUIST-CDP does not save time series signals as they require large amounts of storage space; therefore, “accidental injury” to FTs in the high-turbulence and severe-wind-shear regions is an irreversible loss. It is worth mentioning that the step of random phase modulation mentioned earlier can be omitted for radar systems with magnetron transmitters. This is because the phases of different pulses are random in a magnetron (noncoherent) system; that is, the random phase modulation is inadvertently and automatically completed.
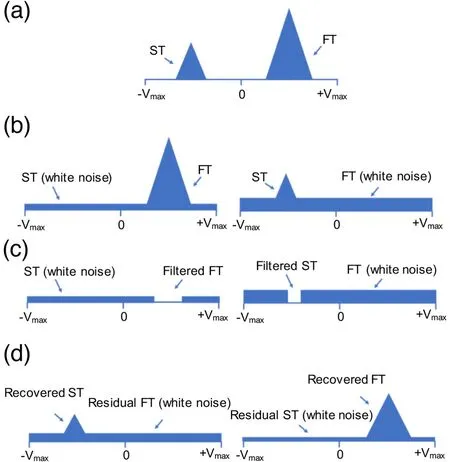
Fig. 1. Schematics of random phase processing algorithm: (a) Doppler spectra for FT and ST of a fully coherent radar system; (b) Doppler spectra for FT and ST after phase modulation;(c) Doppler spectra for FT and ST after band-rejection filter; and (d) Doppler spectra for FT and ST after recohering incoherent echoes.
3.1.2.SQI
Although STs are not filtered and recovered in the signal processing level, they appear as white noise in the Doppler spectrum because of the phase modulation of the transmitted pulses, which broadens the Doppler spectrum (i.e.,increasesW
). In addition, because STs are usually caused by long-range targets (exceedingR
at least), the power of an ST is usually lower than that of an echo caused by targets of the same size at a close range. Therefore, assuming constant noise power, the SNR of an ST is generally smaller than that of an FT. To combine these two characteristics(i.e., largeW
and small SNR) to identify STs, SQI is utilized in the hybrid method. In terms of the Gaussian model,SQI can be defined as (Vaisala, 2014):
W
and decreasing SNR cause SQI to decrease. Therefore, radar data contaminated by STs should have smaller SQI values.To analyze the differences in SQI for FTs and STs quantitatively, the datasets listed in Table 2 were used for statistical analysis. As shown in Fig. 2, the normalized frequency distributions of SQI were divided into two parts, with the distributions of STs and FTs being concentrated in the smalland large-value ends, respectively. This outcome is consistent with the expected results. Note also that the SQI values of most STs are less than 0.6 (red line in Fig. 2). Therefore,these STs can easily be identified by setting an SQI threshold of 0.6. However, a considerable portion of the FTs is also included within this range (i.e., an SQI value lower than 0.6), mainly resulting from turbulence and wind shear. As shown in Fig. 3a, NUIST-CDP observed a typical case of stratiform precipitation at 0734 UTC 1 May 2017. In that case, because the widely distributed precipitation echoes exceeded theR
of NUIST-CDP, the ST (red ellipse in Fig. 3a) appeared approximately 50 km southeast of NUIST-CDP. This finding can be verified by comparison with the NJ-SD data for the adjacent time (Fig. 3c). As shown in Fig. 3b, the SQI values in this region are lower,which indicates that the SQI values can be used to identify STs. However, the SQI values of some FTs, at 100-150 km west of NUIST-CDP (blue ellipse in Fig. 3b), are as low as those for the ST. From the vertical cross section (VCS) of theV
obtained from the NJ-SD data at the azimuth of 265°(Fig. 3d), it is apparent that these low SQI values for the FTs were caused by wind shear (purple ellipse in Fig. 3d).Therefore, only potential ST regions can be determined using phase modulation and the SQI threshold, and accurate identification cannot be achieved. The FTs overlapping with the STs in the SQI distribution must be distinguished through subsequent data processing.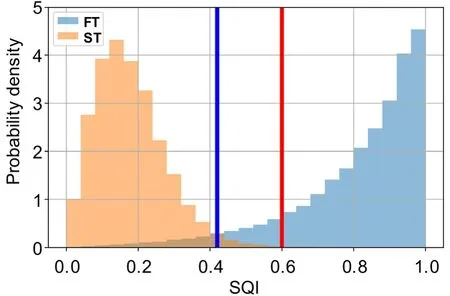
Fig. 2. Normalized frequency distributions of SQI. The red line (0.6) indicates the threshold used in the hybrid method to obtain the potential regions of STs and to calculate the improved Delta PhiDP value. The blue line (0.42) indicates the threshold used by the SQI filter.
3.2. Data processing
3.2.1.Polarimetric features
As some of the polarimetric features used in the hybrid method are similar to those used in P16, the features used in P16 are briefly introduced here. The fuzzy logic algorithm of P16 has seven input features: the standard deviations of ZDR [SD(ZDR)], PhiDP [SD(PhiDP)], CC [SD(CC)], andW
[SD(W)]; as well as CC,W
, and Delta PhiDP (see definition below). Apart fromW
and SD(W), the other five are polarimetric features. The information contained inW
that can be used to identify STs is incorporated into the SQI; therefore,W
and SD(W) are eliminated from the hybrid method.The statistical results given by P16 show that the standard deviations of the polarimetric variables [i.e., SD(ZDR),SD(PhiDP), and SD(CC); hereafter referred to as the SDs]of the ST are larger than those of the FT, and the CC of the ST is smaller than that of the FT. Therefore, these four polarimetric features are incorporated in the hybrid method, and the SDs are calculated over a range interval of 2 km along the radial.Delta PhiDP was first proposed for use in identifying STs in P16. It is defined as the difference of PhiDP at each gate from the system offset. Delta PhiDP is employed based on the principle that FTs are started from the system offset at a given ray. Therefore, when a gate satisfies the constraint that the mean of several consecutive range gates is below the preset threshold, any gates appearing before this start gate are most likely to be STs (i.e., the membership function values are set to 1), and any gates beyond the start gate are most likely to be FTs (i.e., the membership function values are set to 0). The concept of Delta PhiDP is novel;however, there are still some flaws. First, when two ST regions distributed along the radial direction of the radar are separated by an FT region in the middle, the ST far from the radar is inevitably misidentified as an FT by Delta PhiDP.Second, although the phase folding can easily be resolved,the initial phase (of every ray) is difficult to determine because the initial phase usually changes with the azimuth and time (Gourley et al., 2006). Therefore, the threshold used to determine the start range cannot be set optimally. To solve these problems, an improved Delta PhiDP is proposed in this paper, which is defined as the difference between PhiDP at each gate and the mean of the last several range gates (the default is 27, which is 2 km for NUIST-CDP) for each ray. The improved Delta PhiDP is implemented based on the principle that the theoretical maximum PhiDP in each ray should be at the end of the ray.When PhiDP of a gate is larger than the theoretical maximum PhiDP (i.e., when the difference is positive), it is more likely to be an ST; otherwise (i.e., when the difference is negative), it is more likely to be an FT. Therefore,the probability that a range gate is an FT or ST can be approximately quantified based on this difference. Compared with the Delta PhiDP proposed in P16, which has a Boolean type output, the output of the improved Delta PhiDP is a continuous value. Therefore, it has a higher fault tolerance, especially at the boundary between the ST and FT regions. To prevent some rays from ending with STs or all of their gates from being STs, additional conditions must be satisfied when determining the theoretical maximum PhiDP. That is,the SQI values of the range gates used to determine the theoretical maximum PhiDP must exceed a specific threshold(the default is 0.6; red line in Fig. 2). If there are insufficient range gates to meet this condition, Delta PhiDP of all range gates in the ray is set to a large positive value (the default is 50°). As shown in Fig. 4a, NUIST-CDP observed a typical squall line case at 1444 UTC 3 May 2017. Because theR
of NUIST-CDP was relatively small compared with the distribution range of this case, a large area of STs appeared within 100 km of NUIST-CDP, which could be verified and located by comparison with the NJ-SD data for the adjacent time (Fig. 4c). In addition, there was no high turbulence or severe wind shear within 100 km of the 0.5° elevation angle; therefore, the ST-contaminated regions could be characterized more clearly by the lower SQI values in Fig. 4d.Comparison of the improved Delta PhiDP (Fig. 4f) with the SQI values reveals that the small and large SQI values have good correspondence with the positive and negative Delta PhiDP values, which indicates that Delta PhiDP has good identification performance for STs.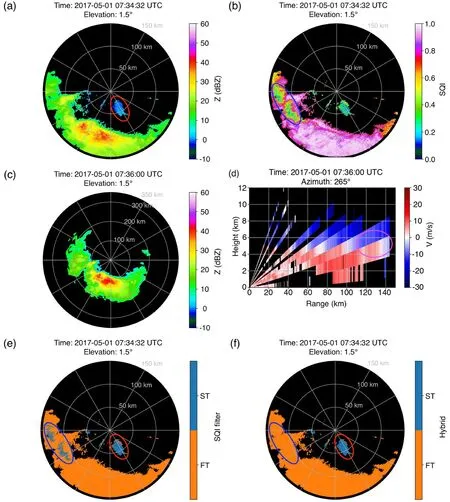
Fig. 3. (a) Z and (b) SQI for NUIST-CDP data obtained at 0734 UTC 1 May 2017 at 1.5° elevation. (c) Z obtained from NJ-SD data at 0736 UTC 1 May 2017 at 1.5° elevation. (d) VCS of V from NJ-SD data obtained at 0736 UTC 1 May 2017 at an azimuth of 265°. Identification results of the (e) SQI filter and (f)hybrid method for NUIST-CDP data obtained at 0734 UTC 1 May 2017 at 1.5° elevation. The red ellipses in(a), (e), and (f) highlight the ST region. The blue ellipses in (b), (e), and (f) highlight the FT region influenced by wind shear. The existence of wind shear can be proved by the purple ellipse in (d).
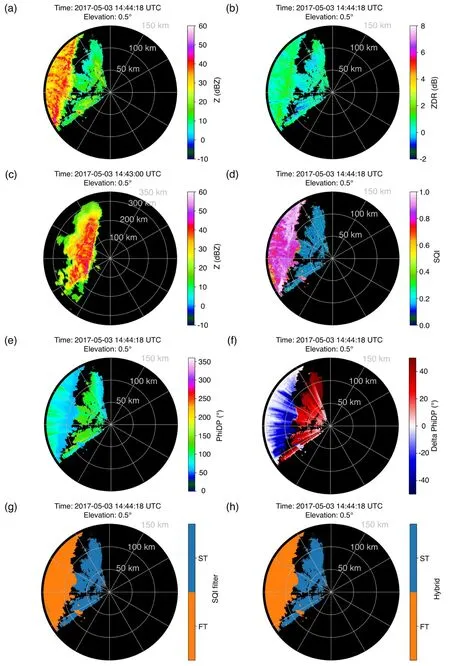
Fig. 4. (a) Z and (b) ZDR for data from NUIST-CDP obtained at 1444 UTC 3 May 2017 at 0.5° elevation. (c)Z from NJ-SD obtained at 1443 UTC 3 May 2017 at 0.5° elevation. (d) SQI, (e) PhiDP, (f) Delta PhiDP, (g)identification results of the SQI filter, and (h) identification results of the hybrid method for data from NUIST-CDP obtained at 1444 UTC 3 May 2017 at 0.5° elevation.
In addition to the polarimetric features used in P16, a novel polarimetric feature based on the relationship betweenZ
and ZDR is also used to distinguish STs from FTs in the proposed method; this feature is called Z-ZDR. According to the radar equation (Doviak and Zrnić, 2006),Z
can be expressed as:
P
is the received radar power;R
is the range between the radar and target; andC
is the radar constant, which includes all the constant radar parameters, such as the transmitted power, beam width, and pulse width. However, for STs, theR
term in Eq. (5) is smaller than the actual distance (the difference isR
); thus,Z
is smaller than its actual value for STs, and the reduction ratio changes withR
.Taking NUIST-CDP as an example,Z
is approximately 22 500 and 4 times smaller (44 and 6 dB, respectively) for the STs when the actual distance is 151 and 300 km, respectively. However, as ZDR is defined as the ratio of the reflectivity factor at horizontal polarization to that at vertical polarization (Ryzhkov and Zrnić, 2019), it is not affected by theR
term and can represent the actual microphysical information of the target causing the ST. The STs within 100 km of NUIST-CDP in Fig. 4a should have been caused by targets 150-250 km from NUIST-CDP. From the NJ-SD data(Fig. 4c),Z
generally exceeded 30 dBZ
in those regions.However, because theR
term in Eq. (5) is incorrectly set,Z
decreases significantly for the ST in Fig. 4a. UnlikeZ
, ZDR(Fig. 4b) shows no obvious discontinuity between the STs and FTs, except for some sectors with severe attenuation.Therefore, for the same ZDR,Z
should generally be higher for the FT than for the ST (see the following section for more statistical analysis).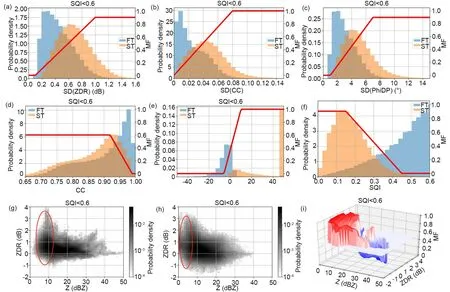
Fig. 5. Normalized frequency distributions and membership functions of features: (a) SD(ZDR); (b) SD(CC); (c) SD(PhiDP); (d) CC;(e) Delta PhiDP; and (f) SQI. Normalized frequency distributions of Z-ZDR for (g) FT and (h) ST. (i) Membership function of Z-ZDR. The red ellipses in (g) and (h) highlight the region influenced by noise (with SNR values less than 15 dB).
3.2.2.Fuzzy logic algorithm
A fuzzy logic algorithm similar to the technique proposed by Zhang et al. (2020) was adopted to combine the features mentioned above, i.e., SD(ZDR), SD(CC), SD(PhiDP),CC, Delta PhiDP, Z-ZDR, and SQI. The aggregation value of the ST (A
) at each range gate is defined as follows:
W
are the membership function value and weight of thei
th input, respectively. To obtain enough objective membership functions, the NUIST-CDP measurement data listed in Table 2 were used for statistical analysis. Note that the purpose of the data processing submodule is to distinguish the overlapping STs and FTs on the SQI distribution;therefore, statistical analysis was performed only for datasets with SQI values of less than 0.6.As shown in Figs. 5a-c, the SDs exhibit similar normalized frequency distributions; that is, the ST distributions are more concentrated in the large-value regions than the FT distributions. Nevertheless, the ST and FT distributions have large overlaps, indicating that the SDs have only limited ability to identify STs. This limitation exists because the SNR of the ST is usually low; under that condition, the fluctuations (which can be quantified by the SD) of the polarimetric variables increase for both the FTs and STs (Zhang et al., 2020). As shown in Fig. 5d, when CC is less than 0.95,the distributions of the STs and FTs almost overlap (the reason is similar to that for the SDs), and the probability densities of both increase with increasing CC. However, when CC exceeds 0.95, the probability density of the STs greatly decreases and gradually reduces to close to zero, whereas that of the FTs increases continuously. Therefore, CC only plays an important role in the identification of STs when its magnitude is large. As shown in Fig. 5e, Delta PhiDP is mainly distributed in the region less (greater) than zero for the FTs (STs). The existence of partial Delta PhiDP greater(less) than zero for the FTs (STs) is mainly due to the random fluctuation of PhiDP (Ryzhkov and Zrnić, 2019). Note that the distribution of STs has an abnormally high probability density at the large-positive-value end. This characteristic exists because there are insufficient range gates satisfying the SQI threshold in some rays, such that the Delta PhiDP values of all range gates in these rays are filled to the default of 50°. Unlike those shown in Fig. 2, the statistical results in Fig. 5f were obtained using data with SQI values less than 0.6 only. Although the SQI distributions of the STs and FTs are still mainly in the small- and large-value ends, respectively, the overlap is significantly increased compared with that in Fig. 2. As Z-ZDR is a 2D feature, the FT and ST distributions are shown in Figs. 5g and h, respectively. It is apparent that, for the same ZDR,Z
is larger for the FTs than for the STs. In addition, the ST is rarely distributed in the region whereZ
is large because of the incorrect setting of theR
term in Eq. (5). However, whenZ
is small, the ST and FT distributions have a significant overlap. After analysis, the overlapped part mainly arises from the data with SNR values less than 15 dB (red ellipses in Figs. 5g and h).Therefore, Z-ZDR is expected to have better identification performance for STs in the case of large SNR.After the normalized frequency distributions are obtained, the method proposed by Cho et al. (2006) is used to determine MF andW
. MF is given by whereF
andF
are the normalized frequencies of the ST and FT, respectively. For all features except Z-ZDR, the trapezoidal functions are adopted to indicate the MF values by fitting the results of Eq. (7) using the least-squares method (red lines in Fig. 5). The MF value of Z-ZDR is 2D,in which the range and interval ofZ
are 0-50 dBZ
and 1 dB,respectively, while those of ZDR are -2 to 4 dB and 0.2 dB,respectively. If some Z-ZDR pairs do not appear in the data listed in Table 2-that is, if bothF
andF
are zero-the MF values of Z-ZDR at these grids points are set to 0.5, indicating that they do not contribute to the identification of STs.The overlap areaA
of the normalized frequency distributions of FTs and STs for a specific feature can reflect the identification performance; that is, a smallerA
indicates better performance (Cho et al., 2006). Therefore,W
of thei
th input is determined by the reciprocal ofA
, such that
W
andA
.AfterA
is determined from Eq. (6), it is compared to a preset threshold between 0 and 1. IfA
exceeds the threshold, the target gate is classified as an ST; otherwise,an FT is identified. Similar to the membership function determination, theA
threshold is also determined objectively based on the statistical results obtained for the data listed in Table 2. As shown in Fig. 6, there is a certain degree of overlap between the normalized frequency distributions of the FTs and STs, with an obvious intersection at 0.52(red line in Fig. 6). Therefore, 0.52 can be considered an optimalA
threshold for implementation in the hybrid method.3.2.3.Post-processing
As shown in Fig. 6, the overlap area of the normalized frequency distribution ofA
(0.07) is smaller than that of each feature (Table 4), which indicates that the identification performance of the fuzzy logic technology combining multiple features is better than that achieved using any single feature. However, there is still a certain degree of overlap in Fig. 6; therefore, some post-processing rules are necessary to further improve the identification performance.

Table 4. Overlap area and feature weights.
Because clouds and precipitation usually only exist in the troposphere (Houze, 2014), the theoretical maximum detection range of a weather radar is limited by the tropopause height (the default is 12 km). If a specific range gate is an ST, the sum (i.e., the actual range of ST) of its apparent range andR
should still be within the theoretical maximum detection range. If the gate is an FT, the sum of its apparent range (i.e., the actual range of FT) andR
may exceed the theoretical maximum detection range. Therefore,the height corresponding to the apparent range of a specific gate plusR
[obtained through inverse implementation of the altimetry formula (Doviak and Zrnić, 2006)] is defined as the potential height of the gate. If the potential height exceeds the tropopause height, the gate cannot be an ST and should be reclassified as an FT.As shown in Fig. 7a, NUIST-CDP observed a typical squall line case at 1953 UTC 11 May 2018. When the hybrid method was employed for identification before postprocessing (Fig. 7b), some echoes were identified as STs at approximately 140 km northeast of NUIST-CDP (red ellipse in Fig. 7b). Although the SQI values in this region are relatively low (Fig. 7f), a comparison with the NJ-SD data for the same time indicates that no ST was present(Fig. 7c). The SQI values in this region were lower for the same reason as in the case shown in Fig. 3-that is, because of wind shear. The presence of wind shear can be well verified by considering the VCS ofV
obtained from the NJ-SD data at an azimuth of 40° (purple ellipse in Fig. 7d). Analysis revealed that the main cause of misidentification is that the lower SNR values (Fig. 7e) in that region caused some polarimetric features (e.g., the SDs, CC, and Z-ZDR) to appear more like STs (not shown here). In addition, the SQI values were lower than 0.6 in that region; therefore, the region was excluded from the calculation of the theoretical maximum PhiDP values of the sectors in which the region was located. Hence, Delta PhiDP was positive in the region(Fig. 7g). However, the identification results obtained by the hybrid method after post-processing indicate an efficient performance, as shown in Fig. 7h. The misidentification in this region was completely eliminated. Although NJSD observed echoes in the range of 150-250 km in some sectors, the hybrid method did not classify any echoes within 100 km of NUIST-CDP as STs. This result occurred because the FT echo power within 100 km of NUIST-CDP was sufficiently high (as reflected to some extent by the SNR shown in Fig. 7e) to be unaffected by the STs (as reflected to some extent by the SQI shown in Fig. 7f). Therefore,these kinds of overlaid echoes were regarded as FTs in this study.In addition, in accordance with the statistical results shown in Fig. 5, some thresholds can be optionally adopted to correct the classification results. For example, range gates withZ
greater than 40 dBZ
or Delta PhiDP lower than -10°can also be force-classified as FTs.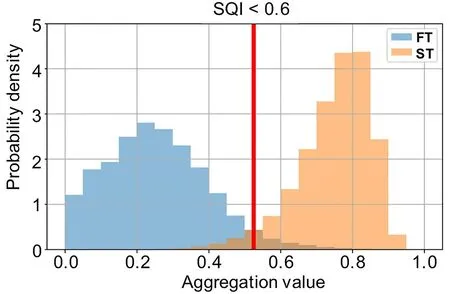
Fig. 6. Normalized frequency distribution and threshold (0.52)of AST.
4. Evaluation
When it is not necessary to recover the STs, setting a threshold value of the SQI (typically set to a value of 0.4-0.5) is another relatively simple processing mode in the RVP900 Vaisala radar signal processor to identify and eliminate the regions contaminated by STs. Therefore, a filter based on the SQI threshold (the default is 0.42; blue line in Fig. 2) was selected for comparison with the hybrid method,which can be regarded as the substitute for the identification results of the RVP900 Vaisala radar signal processor.As shown in Table 5, two 2 × 2 contingency tables were created using the test datasets listed in Table 3 (consists of 370842 range gates of ST and 479 778 range gates of FT) to objectively evaluate the performance difference between the SQI filter and hybrid method. In addition, the overall Heidke skill score (HSS; Doswell et al., 1990) was used to measure the identification skill, which is defined as

a
,b
,x
, andy
represent the number of hits, false alarms, misses, and correct nulls, respectively.From the skill results listed in Table 5, it is apparent that the SQI filter and hybrid method have good identification performance in general, as all correct classification fractions (i.e., the four items on the main diagonals in the two contingency tables) are above 90%. Taking the case shown in Fig. 4 as an example, when there are no special conditions(e.g., turbulence or wind shear), both methods can effectively distinguish STs from FTs (Figs. 4g and h). However,compared with the hybrid method, the SQI filter performance is not ideal in the case of FT identification. The main reason for this relatively poor identification performance is the presence of turbulence and wind shear. Taking the case shown in Fig. 3 as an example, the SQI filter yields a large misidentification area in the wind-shear region (blue ellipse in Fig. 3e). However, the hybrid method overcomes this problem well because of the multiple polarimetric features incorporated into the fuzzy logic algorithm and the additional post-processing rules (Fig. 3f). In contrast, the difference in identification performance between the two methods for the STs is less prominent than that for the FTs. The tolerable misidentification of STs by the SQI filter is due to a few STs for which SQI exceeds the preset threshold (i.e., distribution of STs on the right side of the blue line in Fig. 2). By introducing multiple polarimetric features into the fuzzy logic algorithm for comprehensive identification, the misidentification of STs caused by the hybrid method is further reduced. Finally, it is apparent from HSS that the hybrid method (HSS = 0.98) performs better than the SQI filter(HSS = 0.88) when distinguishing between FTs and STs.
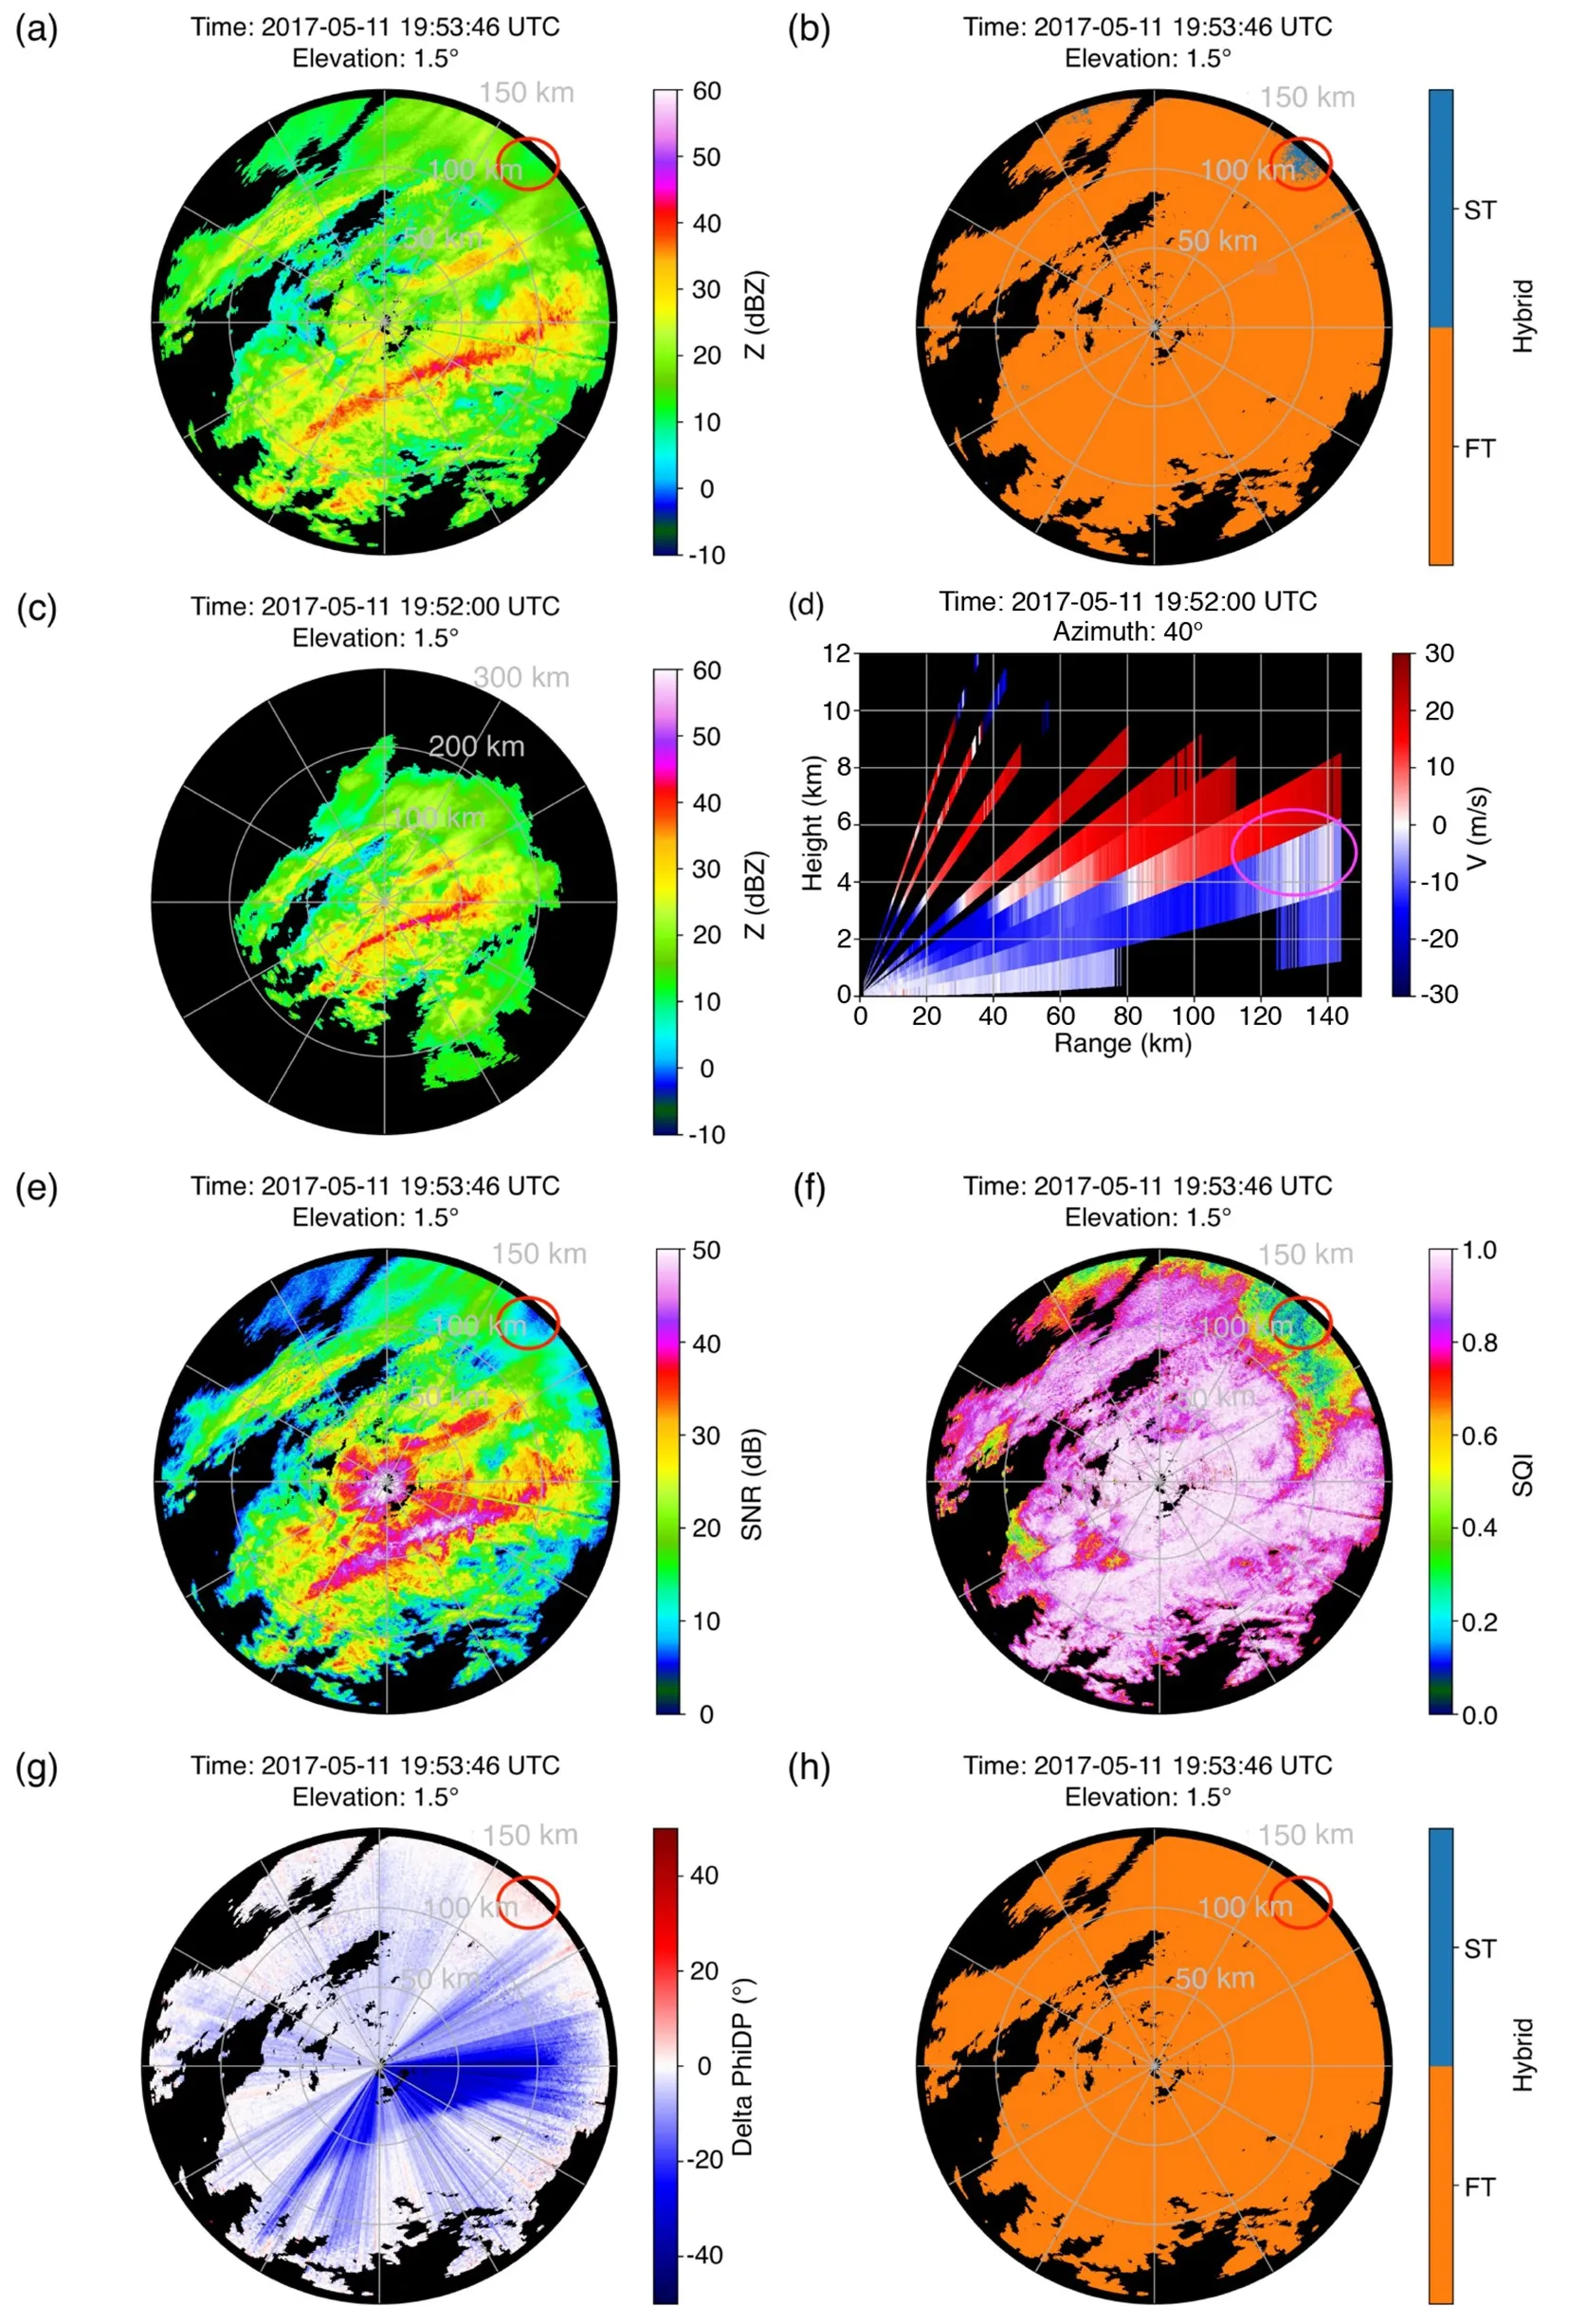
Fig. 7. (a) Z and (b) identification result of the hybrid method before post-processing for data from NUISTCDP obtained at 1953 UTC 11 May 2017 at 1.5° elevation. (c) Z from NJ-SD obtained at 1952 UTC 11 May 2017 at 1.5° elevation. (d) VCS of V from NJ-SD at 1952 UTC 11 May 2017 at an azimuth of 40°. (e) SNR,(f) SQI, (g) Delta PhiDP, and (h) identification results of the hybrid method after post-processing for data from NUIST-CDP obtained at 1953 UTC 11 May 2017 at 1.5° elevation. The red ellipses in (a), (b), (e), (f),(g), and (h) highlight the region misidentified by the hybrid method (before post-processing) but corrected after post-processing.

Table 5. Classification performance of SQI filter and hybrid method.
5. Conclusions
This paper proposes a hybrid method for the identification of STs using phase modulation and polarimetric technology, which removes most STs while leaving most FTs untouched, especially for the FTs in high-turbulence and severe-wind-shear regions. The hybrid method consists of three main steps in which (1) most FTs are identified correctly by setting an SQI threshold (the default is 0.6); (2) a fuzzy logic algorithm with multiple features [i.e., SD(ZDR),SD(CC), SD(PhiDP), CC, the improved Delta PhiDP,Z-ZDR, and SQI] as input is adopted to distinguish between FTs and STs with SQI values lower than 0.6; and(3) a series of post-processing rules are adopted to reclassify some FTs incorrectly identified by the fuzzy logic algorithm.
An independent test dataset was selected to evaluate the hybrid method performance, and an SQI filter with an optimized threshold (the default is 0.42) was adopted for comparison with the hybrid method. The results show that the hybrid method has superior overall performance to the SQI filter, especially for the identification of FTs. This is mainly because the hybrid method incorporates multiple polarimetric features into the fuzzy logic algorithm for comprehensive identification to resolve the problem of the misidentification of the SQI filter in high-turbulence and severe-windshear regions.
It is worth mentioning that attenuation is inevitable in a C-band (adopted in this study) or shorter wavelength radar system when convective precipitation or large-scale stratiform precipitation events occur. Under this condition, the identification ability of some polarimetric features (e.g., CC and Z-ZDR) used in the fuzzy logic algorithm will be affected, which may lead to unsatisfactory performance of the hybrid method. Although attenuation correction ofZ
and ZDR may improve the identification performance to some extent, the current mainstream attenuation correction methods are performed gate-by-gate in the radial direction(Bringi et al., 1990; Testud et al., 2000), which cannot be completed owing to the interference of STs. In addition,because of the absence of correction for weak signals in NUIST-CDP, the data quality of the polarimetric variables is very poor in the regions with low SNR (Zhang et al.,2020), which are also the regions prone to STs. Therefore,the hybrid method is expected to demonstrate better performance when implemented in radar systems with longer wavelengths and using noise correction or multilag correlation estimation algorithms (Schuur et al., 2003; Lei et al.,2012).Although the hybrid method exhibits considerable progress in suppressing the misclassification in high-turbulence and severe-wind-shear regions, it can only identify and eliminate data contaminated by STs in the data processing level. When the FTs and STs overlap, the information contained in the FTs is inevitably lost. Therefore, the principle of the clutter mitigation decision algorithm (Hubbert et al., 2009a, b) can be adopted in the future to further improve the hybrid method. That is, the hybrid method can be used to locate ST-contaminated regions; subsequently, a random phase processing algorithm can be applied to filter and recover the STs in these regions. Hence, the FT component in overlaid signals can be preserved, and the ST component can be mitigated.
. This research was supported by the National Key Research and Development Program of China (Grant Nos. 2017YFC1502102, 2017YFC1502103, 2018YFC1506100,and 2018YFC1506102) and the National Natural Science Foundation of China (Grant No. 41430427).杂志排行
Advances in Atmospheric Sciences的其它文章
- A New Global Solar-induced Chlorophyll Fluorescence (SIF) Data Product from TanSat Measurements
- Phase Two of the Integrative Monsoon Frontal Rainfall Experiment (IMFRE-II) over the Middle and Lower Reaches of the Yangtze River in 2020
- Integrative Monsoon Frontal Rainfall Experiment (IMFRE-I):A Mid-Term Review
- Intermodel Diversity of Simulated Long-term Changes in the Austral Winter Southern Annular Mode: Role of the Southern Ocean Dipole
- Classification of Northeast China Cold Vortex Activity Paths in Early Summer Based on K-means Clustering and Their Climate Impact
- Determination of Surface Precipitation Type Based on the Data Fusion Approach
