A simple and easy method to measure ammonia volatilization:Accuracy under field conditions
2021-04-14rcioMARTINSLeonardoSARKISRoniGUARESCHICamilaSANTOSSelenobaldoSANTANNAMohammadZAMANClaudiaJANTALIABrunoALVESRobertBODDEYEdnaldoARAJOandSegundoURQUIAGA
Márcio R.MARTINS∗Leonardo F.SARKISRoni F.GUARESCHICamila A.SANTOSSelenobaldo A.C.SANT’ANNAMohammad ZAMANClaudia P.JANTALIABruno J.R.ALVESRobert M.BODDEYEdnaldo S.ARAÚJO and Segundo URQUIAGA
1Embrapa Agrobiology,Rod.BR 465,km 7,Seropédica RJ CEP 23891-000(Brazil)
2Agroscope,Research Division Agroecology and Environment,Climate and Agriculture Group,Reckenholzstrasse 191,Zurich 8046(Switzerland)
3Federal Rural University of Rio de Janeiro(UFRRJ),Rod.BR 465,km 7,Seropédica RJ CEP 23891-000(Brazil)
4Soil and Water Management&Crop Nutrition,Joint FAO/IAEA Division of Nuclear Techniques in Food&Agriculture,P.O.Box 100,Vienna A-1400(Austria)
ABSTRACT Field studies on soil ammonia(NH3)volatilization are restricted in many countries owing to the high costs commonly demanded for accurate quantification.We assessed the accuracy of a simple,open chamber design to capture NH3 under field conditions,as affected by different chamber placement schemes.Urea-15N was surface applied to lysimeters installed in the spaces between maize rows.Open chambers made from plastic bottles were installed on each lysimeter with variations in i)N rates(3,8,13,and 18 g m−2),ii)the height of the chamber above the soil surface(0,5,and 10 mm),and iii)chamber relocation(static vs.dynamic).Reference lysimeters without chambers were used to measure NH3 losses by 15N-balance.Losses of NH3-N accounted for more than 50%of the applied N.Relocation of the chambers had no impact on their NH3-trapping efficiencies,proving to be an unnecessary procedure.Variation in the height of the chambers above the soil surface affected the capture of NH3,but the results still maintained high linearity with the NH3 losses quantified by the reference method(R2 >0.98).When the same placement scheme used in the introductory study describing the chamber was utilized(static and touching the soil surface),we found a trapping efficiency of 60%,which was very similar to that(57%)obtained in the previous study.Our results show that this simple,open chamber design can be used with satisfactory accuracy under field conditions,provided that simple,standardized procedures are warranted.
Key Words: ammonia collector,chamber method,field sampler,gas emission,low-cost chamber,nitrogen cycling
INTRODUCTION
With the notable exception of soybeans,most important commercial crops are very dependent on the use of high rates of synthetic or organic nitrogen(N)-fertilizers.The use of synthetic organic compounds,such as urea,as fertilizer can generate high N losses through ammonia(NH3)volatilization,especially when applied on the soil surface.Another primary source of NH3volatilization is the deposition of livestock excreta(Nicholset al.,2018).After urea hydrolysis into NH3, some of this gas escapes into the atmosphere,reducing the soil N available to plants.Under propitious soil and weather conditions, more than 50% of the N applied can be lost to the atmosphere as NH3(Rochetteet al.,2013;Martinset al.,2017).The emission of this caustic gas can cause significant economic losses and can result in a reaction with acid compounds in the atmosphere forming fine particles of salts less than 2.5µm,known as PM2.5(Davidet al.,2019).The humid or dry deposition of these salts on water and land surfaces can contribute to the eutrophication and acidification of ecosystems and indirectly cause the emission of nitrous oxide(N2O),a potent greenhouse gas(Lamet al.,2018).The fine salt particles,approximately the thickness of a blood cell,can be transported long distances and exacerbate air pollution in large cities such as Sao Paulo,Beijing,Cairo,Jakarta,and Los Angeles(Penconek,2018).Such air pollution is known to cause inflammatory responses in the respiratory system and reduce the resistance of the lungs to infections(Liet al.,2019).
To compare practices with the potential to abate NH3emissions,it is necessary to use reliable and viable measurement methods.Among the most used methods of quantifying NH3volatilization,are micrometeorological techniques(Nelsonet al., 2019), wind tunnels (Pelsteret al., 2019),closed static chambers(Rawluket al.,2001),closed dynamic chambers(Marianoet al.,2019),and semi-open static chambers (Nômmik, 1973; Rinaldiet al., 2019). Wind tunnels and micrometeorological techniques are expected to cause less disturbance to the environmental conditions near the soil surface,thus,presenting satisfactory accuracy(Sommer and Misselbrook,2016;Nelsonet al.,2019).However,these methods are expensive,require highly-skilled technicians,and demand relatively large plots,which make them nonviable for field studies with multiple treatments and relatively small plots.Because of their viability and convenience,small chambers are very often used to measure NH3volatilization.Even so,the construction of some types of chambers,as well as their installation and handling in the field,is sometimes time-consuming and complicated,especially in experiments with more observations(e.g.,N rates×sources).Therefore,a chamber type that has received great attention in NH3volatilization studies is a simple,open chamber design using an acid trap inside a plastic bottle with the base removed(Jantaliaet al., 2012; Nicholset al., 2018). This type of chamber was first described by Araújoet al. (2009). The advantages of this type of open chamber are i)easy construction,with the necessary materials available in any region at low cost; ii) easy handling in field experiments, allowing more replication; and iii) free air circulation through the chamber,which minimizes the differences in terms of temperature and humidity between the inside and the outside of the chamber.However,there is a lack of detailed studies on the possible factors affecting the accuracy of this type of chamber under field conditions.This is an intrinsic concern when using techniques of low complexity. The reliability of a method of quantifying gaseous emissions is highly dependent on experimental calibration based on reference methods.Factors related to chamber placement,such as the prolonged deployment of the chamber in one position on the soil surface,could influence its NH3trapping efficiency by affecting the microenvironment above the soil surface(Parkeret al.,2013).For instance,previous studies showed that an “oasis effect”can affect NH3volatilization losses from small-scale measurement areas,causing misinterpretation of the effects of the treatments in a given study(Wattet al.,2016).
The aim of the present study was to assess the influence of the placement scheme of a simply designed open chamber on its NH3-N trapping efficiency and on its linearity with NH3-N losses measured by an isotopic reference method to define specific correction factors.The hypothesis is that the observation of simple methodological procedures in the application of this low-cost methodology warrants NH3volatilization measurements with an appropriate degree of accuracy.
MATERIALS AND METHODS
Field experiment
A mesocosm experiment was conducted at the Experimental Station of the Brazilian Agricultural Research Corporation,National Agrobiology Research Center,Seropédica,Rio de Janeiro State,Brazil(22◦45′S,43◦40′W,33 m above sea level).The climate of the experimental site is tropical(Köppen’s Aw) with a mean annual rainfall of 1 300 mm and a mean annual temperature of 19.8◦C.The wet season occurs from December to March.The experiment simulated a surface broadcasting of urea as a N top-dressing for maize at the six-leaf stage.The soil in the experimental area is a Haplic Acrisol,based on the World Reference Base for Soil Resources(FAO,2015)or an Ultisol(Typic Hapludult),based on the United States Department of Agriculture(USDA)Soil Taxonomy(Soil Survey Staff,2018).A square area of 30 m×30 m was plowed and harrowed to 20 cm depth.A single-cross hybrid of maize(Zea maysL.,cv.BM207)was sown in this area on January 23,2018,using a row spacing of 1.0 m(6 plants m−1).
Approximately 5 Mg moist soil was collected from the 0—20 cm layer in an area adjacent to that prepared for maize sowing. The collected soil was mechanically sieved (<4 mm),transported to a shed,and spread out in a 3-cm layer for air-drying in the shade for 48 h.An aliquot of the collected soil was used for chemical and physical characterization.The soil presented the following properties:pH(H2O),5.0;cation exchange capacity,74 mmolckg−1;base saturation,39%;soil organic carbon(SOC),12 g kg−1;total N,1.1 g kg−1;δ15N,10.7‰;sand,750 g kg−1;silt,60 g kg−1;and clay,190 g kg−1. After that, the soil was amended with lime(2.0 g kg−1soil) and thoroughly homogenized using a concrete mixer.The soil was limed to increase the soil urease activity(van Slyke and Zacharias,1914)and,therefore,the potential NH3volatilization.
After liming,the soil was transferred into small lysimeters made of two stacked plastic boxes (Fig. 1). Each box was 37 cm long,30 cm wide,and 15.5 cm deep.The upper plastic box was filled with 16.5 kg air-dried soil.The bottom of this box was perforated with 20 holes(8-mm diameter)and covered with a thin layer of fine gravel and a piece of synthetic fabric to allow free drainage.The lower box was used as a reservoir to collect the leachate from the soil.A small plastic tube was connected to the bottom of this box for leachate collection using a vacuum pump(Fig.1).
Soil moisture was increased to field capacity (24.8%,volume/volume) over a period of 2 d by slowly dripping water through 200-mL disposable plastic cups very finely perforated with a needle.After that,a 2-week pre-incubation was performed to stabilize the microbial activity(Martinset al.,2013)and some natural physical processes(Dexteret al.,1988).Water content was adjusted by weighing every 2 d during pre-incubation.The soil pH rose to 6.3 at the end of this period. After that, the lysimeters were transported to the field and inserted and buried in the pre-excavated holes between plant rows.The surface of the soil inside each lysimeter was level with the soil surface in the field(Fig.1).The lysimeters were spaced evenly,about 2 m apart.
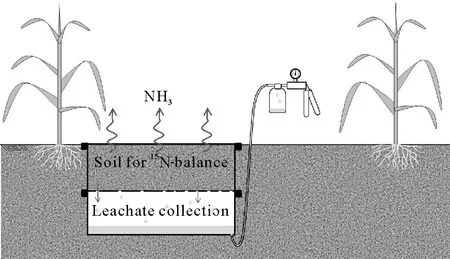
Fig.1 Schematic representation of the lysimeters used to measure NH3 volatilization losses based on15N-balance. This method was used as a reference for calibration of the open chambers based on linear regression.
At the end of the experiment (on day 9 after urea application),500 mL 0.1 mol L−1sulfuric acid solution was carefully and homogeneously spread over the soil surface in each lysimeter to minimize further NH3-N losses. The lysimeters were immediately transported to a shed.The soil was removed,spread out in 3-cm layers,and air dried in the shade for 48 h over pre-labeled 0.8-m2plastic sheets.
Ammonia volatilization measurements using open chambers
Chambers were installed in the lysimeters immediately after application of urea to the soil surface.The design of the chambers was first introduced by Araújoet al.(2009).Briefly, the chamber consists of a 2-L plastic soda bottle with the base removed(Fig.2).A piece of wire(1.24 mm in diameter) was used to install the removed base on top of the bottle, serving as protection against rainwater and dust.The chamber is 0.10 m in diameter;i.e.,it traps NH3from an area of 0.007 85 m2.A foam strip(250 mm long,25 mm wide,and 3 mm thick)presoaked in 10 mL of an acid solution of sulfuric acid(1.0 mol L−1)and glycerol(2.0%,volume/volume)was placed vertically inside the chamber to trap NH3. The lower end of the foam strip was placed inside a 60-mL plastic pot, which was used to retain the acid solution not absorbed by the foam,thereby avoiding any dripping to the soil surface.A basket made of wire(1.24 mm in diameter)was hung from the top of the bottle and used as a support for the plastic pot and the foam inside the chamber.Further details about this type of chamber were described by Jantaliaet al.(2012)and Nicholset al.(2018).
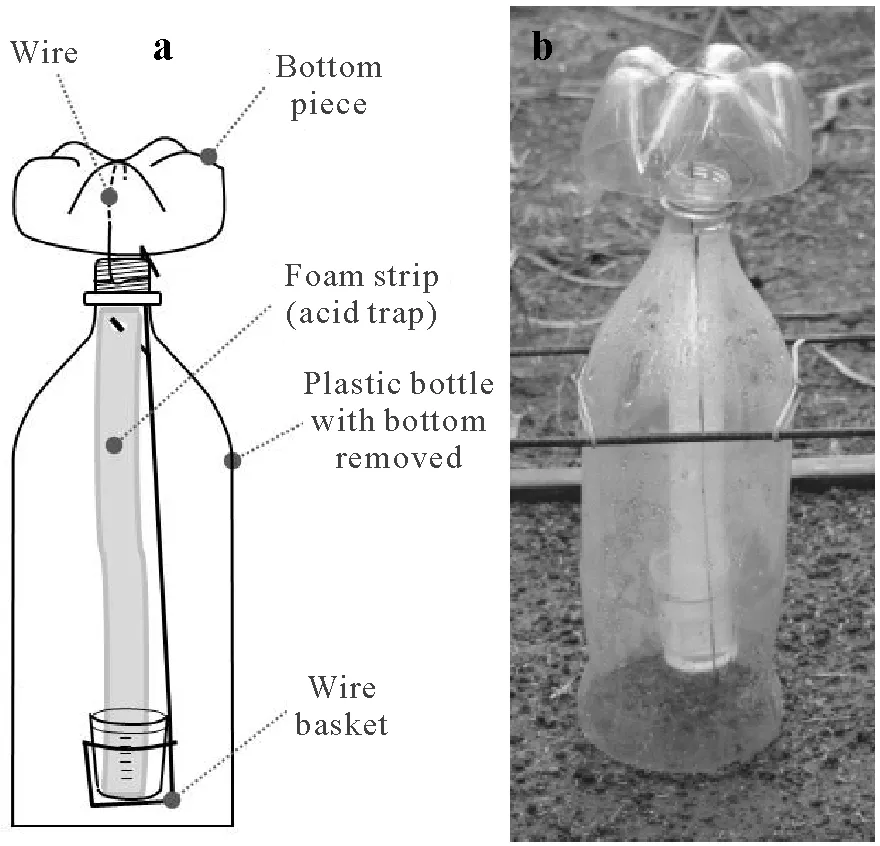
Fig.2 Schematic representation(a)and a photo(b)of the simple,open chamber used to measure NH3 volatilization losses in the field.
Metallic supports were used to vertically anchor the chamber inside the area of the lysimeter.To make the supports,wire stakes,4.2 mm in diameter and 105 cm in length,were shaped to form square U-profiles (35 cm wide and 35 cm high). Two parallel supports were installed 20 cm above the lysimeter by inserting their extremities 15 cm into the soil outside the lysimeter. Rubber bands were placed perpendicularly between the parallel supports to hold the chamber in a vertical position above the lysimeter.A‘blank’chamber was installed in the middle of each experimental block to quantify the “outside NH3”,i.e., the amount of trapped NH3not originating from the soil(e.g.,NH3from the upper opening of the chamber).This‘blank’chamber was the same as those described above except for a 40-cm plastic disc installed to cover the soil surface below the chamber.
The foam strips were replaced on days 3 and 6 after N fertilization, with a final collection on day 9. The plastic pots with the collected folded foam strips were hermetically sealed with their lids and transported to the laboratory.The foam strips were then transferred to Erlenmeyer flasks by rinsing the plastic pots with 40 mL of deionized water.The Erlenmeyer flasks were shaken for 20 min at 220 r m−1on an orbital shaker.Then,a 10-mL aliquot of the solution was used for the analysis of NH+4by steam distillation and titration using sulfuric acid solutions with concentrations ranging from 3 to 25 mmol L−1.
Treatments
The experiment adopted a 4×3×2 factorial arrangement in a randomized complete block design with four replications. The first factor tested in the experiment was N rate,which consisted of 3,8,13,and 18 g N m−2.The different rates were applied with the purpose of creating increasing levels of NH3volatilization loss.The second factor in the study was the scheme of chamber placement above the soil surface.We tested three different placement schemes:i)the chamber opening just touching the soil surface,which was the scheme used in the introductory study performed by Araújoet al.(2009);ii)the chamber opening placed 5 mm above the soil surface;and iii)the chamber opening placed 10 mm above the soil surface. The precise height of the chamber above the emitting soil surface was ensured by three small feet made of 20-mm pieces of a translucent silicone tube(8 mm in diameter)with partial longitudinal cuts.The variation in the height of the chamber above the soil surface was tested with the purpose of simulating situations in which the chamber does not touch the soil surface,such as when there is a layer of plant residue on the soil surface.
The third factor tested in this experiment was the relocation of the chambers to different positions during the period of NH3volatilization measurement.Two different schemes were tested:i)static,in which the chamber stayed in the same position from the beginning to the end of the experiment and ii)dynamic,in which the chambers were moved on a daily basis to one of the four predefined positions in the lysimeter(Fig. 3). To standardize this procedure, the area of each lysimeter(0.111 m2)was split into four virtual quadrants.To facilitate this,the metallic supports of the chambers were placed in such a manner that the chambers could be switched between the four different positions located at the centers of these quadrants. The purpose of testing relocation was to assess if the prolonged presence of the chamber had an effect on the efficiency and linearity of NH3trapping.
Urea labeled with 3.5 atom%15N in excess was surface applied to the soil in the lysimeters when the maize was at the six-leaf stage (30 days after sowing). The urea was evenly distributed across the soil surface of the lysimeter by hand using a 60-mL salt shaker. For each lysimeter, 25 g of washed and dried sand was mixed with the urea to aid in even distribution.Reference lysimeters with no chamber but with the same rates of urea-15N applied(3,8,13,and 18 g N m−2) were included in each experimental block.These reference lysimeters were used to determine the NH3-N volatilization losses based on15N-balance, which was considered the‘gold standard’,that is,a reference method.The NH3-N losses quantified using these reference lysimeters were used to calibrate the NH3-trapping efficiency of the chambers.We also used a zero-N control to determine the natural abundance of soil15N(background soil15N level)at the end of the experiment.
Total N and 15N analyses
At the end of the mesocosm experiment,after air-dried,the soil from each reference lysimeter was sieved through a 2-mm mesh sieve and homogenized for 5 min using a concrete-mixer(30 r min−1).After that,two 25-g subsamples were taken and finely ground(<150µm)using a roller-mill apparatus described in detail by Arnold and Schepers(2004)and Sant’Annaet al.(2018).Aliquots(40 mg)of the ground soil were weighed into 12.5 mm×5.0 mm tared tin capsules(D1010, Elemental Microanalysis Ltd., UK). The total N content and15N enrichment analyses were performed with an Thermo-Finnigan Flash 2000 elemental analyzer coupled to a Delta V Advantage isotope ratio mass spectrometer(IRMS)(Thermo Fisher Scientific,USA)in the John Day Stable Isotope Laboratory of Embrapa Agrobiology. The amount of urea-N remaining in the soil at the end of the experiment(Nrem),in g N m−2,was calculated as follows:

where SDW is the soil dry weight in each lysimeter (g);Alysimiteris the soil surface area in the lysimeter(0.111 m2);Nsoilis the soil total N content at the end of the experiment(%);15NAPEsoilis the15N atom%excess in the soil at the end of the experiment;and15NAPEureais the15N atom%excess in the fertilizer.
A 100-mL composite sample of the leachate was obtained for each reference lysimeter by mixing weighed volumes according to the daily volume of leachate produced in the experiment. The analysis of the N concentration in the leachate was performed using steam distillation after a pretreatment with Devarda’s alloy to reduce nitrate(NO−3)and nitrite(NO−2)into ammonium(NH+4)(Liao,1981).

Fig.3 Schematic representation of the static(a)and dynamic(b)chamber deployment methods tested in the present study.
For15N analysis,a predetermined volume of the solution extracted from the foam strips or of the leachate was pipetted into a 50-mL plastic pot containing 500 mg of aluminum oxide powder (Com-Aid, Leco, USA). Each volume was calculated to obtain 1.0 mg N g−1aluminum oxide powder based on the total N concentration in the solution.Next,the plastic pots were placed in a forced-air oven at 55◦C for 72 h.After drying,40-mg aliquots of the aluminum oxide powder containing 40µg N were weighed into tin capsules for15N analysis following the same procedures described for the soil samples.This aliquot of N(40µg)was determined to be the best amount for the IRMS in terms of accuracy and precision based on pre-analyses with test samples.To avoid rupture of the tin capsules by oxidation owing to residual sulfuric acid,the IRMS analysis was performed on the same day as the weighing.
The total amount of leached N derived from urea(Nleach),in g N m−2,was calculated as follows:

whereVleachis the total volume of leached solution collected over 9 d of the experiment,in mL lysimeter−1;Cleachis the N concentration in the leached solution,in mg mL−1;and15NAPEleachis the15N atom%excess in the leached solution.
The NH3-N losses derived from urea measured by15Nbalance(ANLbalance),in g N m−2,was calculated as follows:

where Napplis the rate of urea applied to the lysimeter,in g N m−2. The losses of urea-derived NH3-N trapped by chambers(ANLchamber),in g N m−2,was calculated as follows:

where NTC is the amount of NH3-N trapped in the chamber,in g N;Achamberis the soil surface area covered by the chamber(0.007 85 m2);and15NAPEfoamis the15N atom%excess in the solution extracted from the NH3-N-trapping foam strip in the chamber.
Gaseous N losses other than NH3 volatilization
A nitrification inhibitor was added to the15N-labeled urea to control significant gaseous N losses other than NH3volatilization losses,i.e., to minimize gaseous N losses as N2O and N2, which are primarily associated with nitrification and denitrification. The compound 2-chloro-6-(trichloromethyl)pyridine,known as nitrapyrin,was used as a nitrification inhibitor and added to the urea at a rate of 1%.The detailed procedures followed when mixing the nitrapyrin with the urea were previously described by Martinset al.(2017).To check the effectiveness of nitrapyrin in controlling the gaseous N losses associated with nitrification and denitrification, a parallel experiment was conducted simultaneously to the study described above,to calibrate the NH3chambers. In this parallel experiment, we measured daily N2O fluxes as a general indicator of gaseous N losses due to nitrification and denitrification,based on the fact that this gas is an inherent by-product of both processes(Zhuet al.,2013).Three additional lysimeters were included in each experimental block previously described for the calibration of the NH3chambers.Three treatments were tested in this parallel experiment:i)regular urea at 10 g N m−2;ii)urea plus nitrapyrin at 10 g N m−2;and iii)a control(no added N).
The N2O emissions were measured using non-flowthrough, non-steady-state chambers, which consisted of a plastic box,identical to that described for the manufacture of the lysimeters.The chamber was insulated with a 30-mm layer of polyurethane foam (0.018 g cm−3) covered by a self-adhesive bituminous membrane faced with aluminum foil.A sampling port connected to a four-way medical tube,installed at different positions inside the chamber,was used for gas withdrawal.A pressure equilibration vent tube was used following the GraceNet protocol(Parkinet al.,2003).Rubber gaskets and fasteners were used to ensure adequate sealing of the chamber(Cloughet al.,2012).Gas sampling was performed daily between 8:30 a.m. and 10:00 a.m.,which is the period of day considered to represent the mean daily N2O flux(Alveset al.,2012).The gas was collected using a 60-mL plastic syringe(polyvinyl chloride syringe).A 35-mL gas sample was taken 0,20,40,and 60 min after chamber closure. To purge the system, 10 mL of gas was collected and discarded before each gas sampling.Further details on the procedures of gas collection,analyses of N2O concentration,and calculation of N2O fluxes were described by Martinset al.(2017).
Auxiliary variables
A rainfall gauge was used to measure daily precipitation(Rainlog Data Logger,Rainwise Inc.,USA).Data on temperature, relative air humidity, and wind speed were obtained from a Brazilian National Institute of Meteorology(www.inmet.gov.br)station located 2.0 km southwest of the experimental site.Additionally,for soil moisture monitoring,approximately 10 g of humid soil was sampled daily from an additional lysimeter in each block,using a small auger.These soil samples were oven-dried in aluminum cans for 48 h at 105◦C to determine the gravimetric soil water content.The volumetric water content was obtained by multiplication of the gravimetric water content by the soil bulk density,considering the soil dry mass and the internal dimensions of the lysimeter.
Statistical analyses
The data of the total amount of NH3-N trapped by the chambers over the nine days of the experiment were subjected to analysis of variance(ANOVA).After that,we tested the statistical significance(P <0.05)of the linear regressiony=a+bxto assess the linearity between the amount of volatilized NH3trapped by the open chamber(x)and the amount of volatilized NH3-N measured by15N-balance in the lysimeters without chambers(y).Statistical analyses were performed using the Sisvar 5.6 software (Ferreira, 2011).All regression analyses were performed only after testing the normality of the errors using the Shapiro-Wilk test and the homogeneity of the variance using Levene’s test.When the interceptionawas not statistically significant(P >0.05),we considered the correction factor for the calibration of the chamber as the slope of the equation(coefficientb)and we calculated the trapping efficiency of the chamber, in percentage,as 100/b.
RESULTS AND DISCUSSION
Ammonia volatilization measured by 15N-balance
The NH3-N losses measured using the reference method(15N-balance)attained more than 50%of the urea-N applied at 18.0 g N m−2(Table I).These high NH3-N losses were due to the favorable soil,weather,and fertilizer placement conditions (Fig. 4). The soil pH>6.0 and soil moisture content almost at field capacity just prior to urea application(Fig.4a)favored urea dissolution,hydrolysis by urease,and,consequently,NH3volatilization(Cabreraet al.,2010).After urea hydrolysis, the NH3volatilization process is closely related to soil water evaporation(Al-Kananiet al.,1991),which in turn is a function of wind speed and the partial pressure of water vapor in the atmosphere (Davarzaniet al., 2014). Therefore, the drying of the soil over the first few days,which was related to a lowering of the relative air humidity during the afternoon (Fig. 4a, c), as well as the non-limiting air temperatures and wind speeds(Fig.4b,d)were factors contributing to the high percentages of N lost through NH3volatilization.
The results of the parallel experiment to assess gaseous N losses other than NH3volatilization showed that cumulative gaseous N loss as N2O was very low(0.07 g N m−2)from lysimeters receiving regular urea(Fig.5).The addition of nitrapyrin to the urea further reduced cumulative N2O emission(0.01 g N m−2),and in these lysimeters the emissions did not differ(P >0.05)from those of the unfertilized control(0.004 g N m−2).This result indicates that nitrapyrin was effective in controlling gaseous N losses through nitrification and denitrification,considering that N2O is a primary indicator of the occurrence of both processes in soil(Zhuet al.,2013).Therefore,we assumed that gaseous N losses other than NH3volatilization were negligible and thus they were not considered in our reference15N-balance study to measure NH3volatilization losses (Table I). The use of nitrapyrin may also have been effective in minimizing losses through N leaching,which were less than 2%of the applied N.
Ammonia trapping by the open chamber
The highest amounts of NH3-N trapped by the chamber occurred during the first three days after urea application,representing,on average,75%of the total N trapped by the chamber(Table SI,see Supplementary Material for Table SI).The NH3-N losses in the intermediate period(days 3—6)and in the last period(days 6—9)represented, on average,17%and 8%of the total N trapped,respectively.High losses in the first few days after the application of urea are usual and have been observed in many experiments with different soil and climatic conditions(Blacket al.,1987;Wanget al.,2004;Singhet al.,2013).The amounts of NH3-N trapped by the blank chambers(outside NH3)were not detectable and therefore not considered in the final calculations.Only a minor portion of the NH3trapped by the chamber was derived from the soil,which contributed to a maximum of 0.3 g N m−2(Table SII, see Supplementary Material for Table SII).The maximum amount of urea-derived N trapped by the chambers was 5.5 g N m−2that occurred when the chamber was kept static and placed touching the soil surface at a N application rate of 18.0 g N m−2.
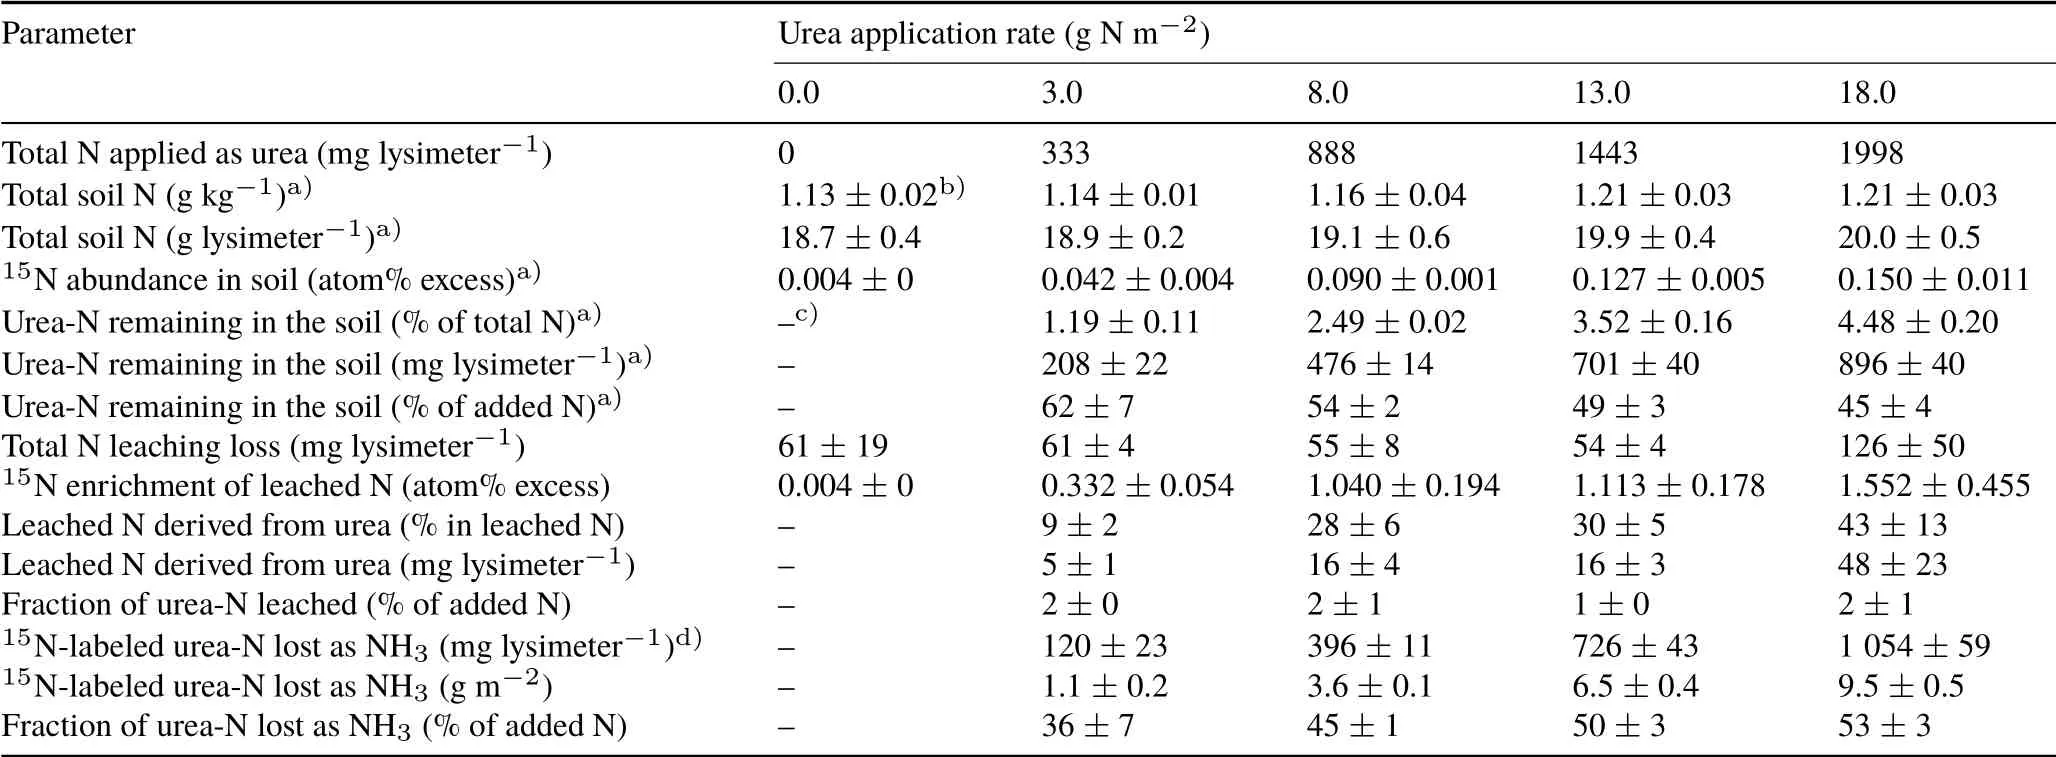
TABLE I Quantification of NH3 volatilization derived from urea based on 15N-balance
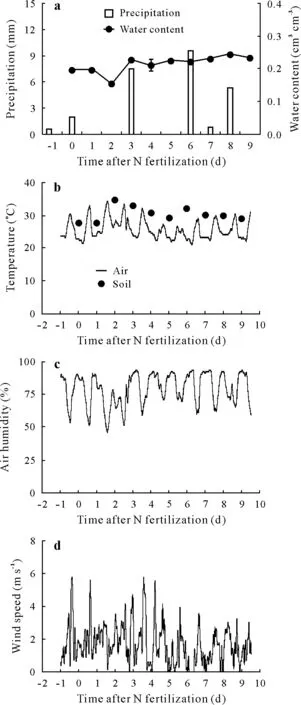
Fig. 4 Precipitation and volumetric soil water content (a), mean daily soil temperature and mean hourly air temperature(b),mean hourly relative air humidity (c), and wind speed (d) during the measurements of NH3 volatilization for calibration of the chambers.Soil temperature measured at 9:00 am was considered a rough estimate of the mean soil temperature based on the results of the study performed by Alves et al.(2012).
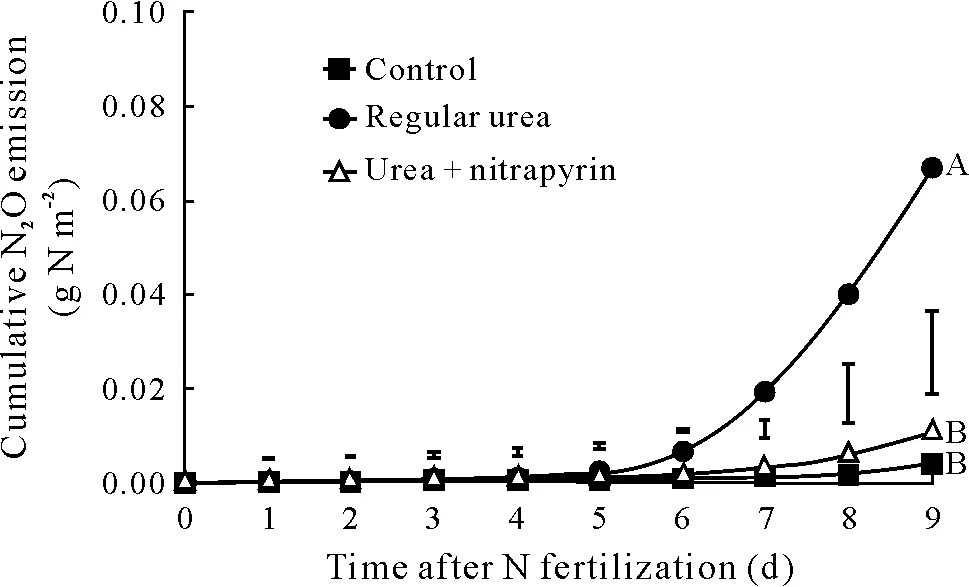
Fig.5 Cumulative N2O emission in the treatments during the 9-d experiment.The vertical bars indicate Tukey’s least significant differences(P <0.05). The same letters at the end of the lines indicate no significant di-fferences in total cumulative N2O emission between treatments during the experiment.Control=no N fertilization;regular urea=urea applied at 10 g N m−2; urea + nitrapyrin = regular urea and nitrapyrin at 1%(weight/weight)of urea.
The relocation of the chamber to different positions in the lysimeter(Fig.3)had no impact on NH3trapping efficiency(Table II).This indicates that the presence of the chamber itself does not affect the process of NH3volatilization from soil, which was also shown in previous studies using this type of chamber under different soil and climatic conditions(Araújoet al.,2009;Jantaliaet al.,2012).This shows that this chamber does not cause an“oasis”effect as reported in studiesusing other methods in which a larger emitting surface is covered,such as when using wind tunnels(Wattet al.,2016).The result of our study is likely due to the small area covered by the chamber(0.007 85 m2)and to the deployment method which did not use a collar inserted into the soil.Both factors make the homogenization of the soil water content in the area surrounding and enclosed by the chamber easier.This result has a practical consequence for the handling of the chambers in the field. The use of additional metallic supports and the fieldwork involved in daily chamber relocation becomes superfluous because keeping the chamber static does not reduce its NH3trapping efficiency (Table II). This is an important advantage when experiments are located at remote sites with many experimental plots and few field assistants.On the other hand,a potential problem associated with the small area of the chamber is the variability in NH3emissions caused by the spatial variability of soil properties or by uneven N-fertilizer distribution.This issue was addressed in a recent study testing the use of multiple chambers per plot in a field experiment(Martinset al.,2021).The study showed that the variability of NH3volatilization measured by open chambers on a field-plot scale can be significantly reduced by concentrating sampling effort(multiple chambers per plot)to the most critical period of NH3-N losses,which usually occurs during the first two weeks after N fertilization.
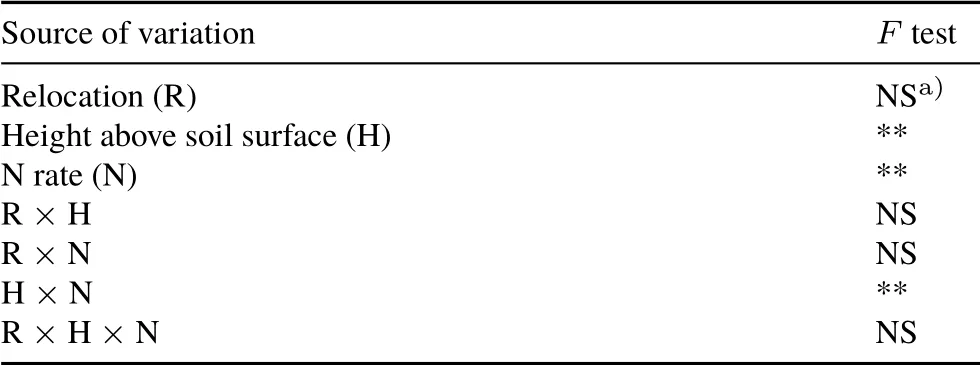
TABLE II Summary of analysis of variance (ANOVA) of the effects of chamber placement on the capture of NH3 by a simple,open chamber
The amount of urea-derived NH3-N trapped by the chamber was influenced by the interaction between N rate and the height of the chamber above the soil surface(P <0.01, Table II). The significant effect of this interaction means that the capability of the chamber to trap growing levels of NH3derived from growing urea-N rates depended on the height of the chamber above the soil surface(Tables II and SI).At the lowest urea-N rate,no significant differences between the amounts of NH3trapped by the chambers were observed(Table SI).In contrast,with increasing urea rate,there was a pronounced effect of chamber height above the soil surface on the capture of NH3.
Linear regression between the NH3 trapped by the chamber and the NH3 volatilization measured by 15N-balance
Because the relocation of the chamber did not affect the capture of NH3(Table II),the linear regressions between the NH3trapped by the chamber and the amounts of volatilized NH3measured by the reference method were performed for each height of chamber above the soil surface.The significant interaction between the height of the chamber above the soil surface and the urea-N rate (P <0.01, Table II) implies that the regression lines for each height have significantly different slopes(Fuchs,2011).This is clearly shown in Fig.6.The linear regression presented a good fit to the data obtained from different schemes of chamber placement,as denoted byR2>0.98(P <0.01,Fig.6).The close approximation to linearity exhibited by the regression lines show that the variance in the amounts of NH3measured by the reference method is highly predictable from the amounts of NH3trapped by the open chamber.This type of assessment under real conditions of measurement is essential to establish the reliability of a method(Almeidaet al.,2002).
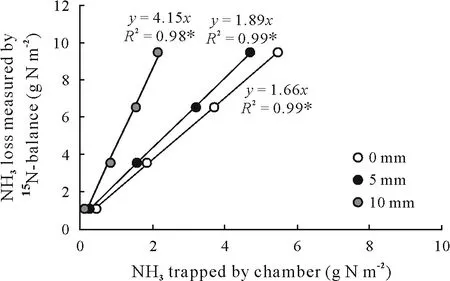
Fig. 6 Linear regression between the NH3-N loss determined by15Nbalance(no chamber deployment)and the NH3-N loss trapped by open chambers with three placement schemes(i.e.,0,5,and 10 mm above the soil surface).The significance of the parameters of regression(slope and intercept)was tested for each treatment.The P-values for the y-intercept in the regression models were greater than 0.05,and hence this constant was not considered in the equations.∗Significant at P <0.05.0 mm=0 mm above(or touching)the soil surface;5 mm=5 mm above the soil surface;10 mm=10 mm above the soil surface.
The values ofy-intercept(coefficienta)estimated for the linear regressions were not significantly different from zero(P >0.05,Fig.6).Therefore,the slopes of the regression lines were taken as the correction factors for calibration of the chamber.In other words,the coefficientbof the linear regression was used to convert the amount of NH3trapped by the chamber into the total amount of NH3lost through volatilization(Fig.6).It is interesting to note that when the chamber was positioned following the scheme described in the introductory study of Araújoet al.(2009)(touching the soil surface) the correction factor was 1.66. This value is close to the 1.74 obtained by those authors.The NH3trapping efficiency of the chamber,in percentage,was obtained by dividing 100 by the coefficientb.The efficiency was 60%when the chamber was placed touching the soil surface.This efficiency was reduced to 53%and 24%,respectively,when the chamber was placed 5 and 10 mm above the soil surface.Although the NH3trapping efficiency of the chamber dropped significantly with increasing height,the linearity of the fit continued to be high,showing a good capability of predicting real NH3-N losses using the chamber.
The good fit of the regression lines in Fig.6 shows that the chamber can be used reliably to assess NH3volatilization in field experiments,provided that i)the height of the chamber above the soil surface is standardized,and ii)the correction factor for NH3trapping efficiency is adjusted if the chamber is placed not touching the soil surface. Overall, the most practical and reliable manner of using the chamber is to keep it static and touching the soil surface.Our results indicate that if this scheme of placement is correctly followed,the correction factor of 1.74 proposed by Araújoet al.(2009)has a good possibility of producing an accurate measurement of NH3volatilization using the chamber. When the strict application of this scheme of placement is not possible due to the presence of short plants(e.g.,grass),plant residue on the soil surface,or the microrelief of the soil,a standardized height should be applied considering a specific correction factor,as presented in our study.It is also important to notice that heights<5 mm would not cause considerable variation in the NH3trapping efficiency of the chamber.Therefore,if the chamber is placed<5 mm above the soil surface,the use of a correction factor of 1.74(Araújoet al.,2009)would not cause a significant reduction in the accuracy of this method(Fig.6).
As a final remark, we stress that use of sophisticated methods,such as micrometeorological mass balance,offers indisputable advantages,including measurements over large areas with high representativeness.However,when the use of such techniques is not possible for financial or technical reasons, the plastic bottle chamber can be a viable option to reliably quantify NH3volatilization.Each sampler costs less than two US dollars(Shigaki and Dell,2015)and can be used with satisfactory accuracy in the field,provided that some simple,standardized methodological procedures are warranted.
CONCLUSIONS
The relocation of the chamber had no impact on its NH3trapping efficiency,proving it to be an unnecessary procedure.In contrast,variation in the height of the chamber above the soil surface affected the capture of NH3by the chamber,but the results still maintained high linearity with the NH3losses quantified using an isotopic reference method(R2>0.98).When we applied the same scheme of placement used in the study describing the chamber(Araújoet al.,2009),static and touching the soil surface,we observed a trapping efficiency of 60%(correction factor of 1.66).This result is very similar to the NH3trapping efficiency of 57%obtained in that previous study(correction factor of 1.74),showing that satisfactory accuracy is ensured if simple,standardized procedures are followed.The use of this simple,low-cost open chamber was shown to be a suitable and reliable approach to quantifying NH3volatilization losses from agricultural soils.
ACKNOWLEDGEMENTS
This study was supported by the International Atomic Energy Agency(IAEA),Vienna,Austria through a Coordinated Research Project(No.D15016),the“Carlos Chagas Filho”Foundation for Support of Research in the State of Rio de Janeiro(FAPERJ)of Brazil with grants awarded to BJRA,CPJ,RMB,and SU and postdoctoral scholarships to MRM,RFG and SACS,and the Brazilian National Council for Scientific and Technological Development(CNPq)with a Productivity Grant(PQ)awarded to BJRA,CPJ,RMB,and SU and scholarships to LFS and CAS.We thank Altiberto M.Baêta,Renato M.Rocha,Eduardo Rodolfo Rodrigues da Silva,and Raysa Alves Vila Nova from Embrapa for their assistance with the field work and the laboratory analyses.
SUPPLEMENTARY MATERIAL
Supplementary material for this article can be found in the online version.
杂志排行
Pedosphere的其它文章
- Yield-scaled nitrous oxide emissions from nitrogen-fertilized croplands in China:A meta-analysis of contrasting mitigation scenarios
- Optimizing the use of open chambers to measure ammonia volatilization in field plots amended with urea
- Nitrification inhibitor nitrapyrin does not affect yield-scaled nitrous oxide emissions in a tropical grassland
- Decreased nitrous oxide emissions associated with functional microbial genes under bio-organic fertilizer application in vegetable fields
- Nutrient cycling and greenhouse gas emissions from soil amended with biochar-manure mixtures
- Nitrapyrin effectiveness in reducing nitrous oxide emissions decreases at low doses of urea in an Andosol
