Optimizing the use of open chambers to measure ammonia volatilization in field plots amended with urea
2021-04-14rcioMARTINSLeonardoSARKISSelenobaldoSANTANNACamilaSANTOSKarlaARAUJORicardoSANTOSEdnaldoARAJOBrunoALVESClaudiaJANTALIARobertBODDEYMohammadZAMANandSegundoURQUIAGA
Márcio R.MARTINS∗Leonardo F.SARKISSelenobaldo A.C.SANT’ANNACamila A.SANTOSKarla E.ARAUJORicardo C.SANTOSEdnaldo S.ARAÚJOBruno J.R.ALVESClaudia P.JANTALIARobert M.BODDEYMohammad ZAMAN and Segundo URQUIAGA
1Embrapa Agrobiology,Rod.BR 465,km 7,Seropédica RJ CEP 23891-000(Brazil)
2Federal Rural University of Rio de Janeiro(UFRRJ),Rod.BR 465,km 7,Seropédica RJ CEP 23891-000(Brazil)
3Agroscope,Research Division Agroecology and Environment,Climate and Agriculture Group,Reckenholzstrasse 191,Zurich 8046(Switzerland)
4Soil and Water Management&Crop Nutrition,Joint FAO/IAEA Division of Nuclear Techniques in Food&Agriculture,P.O.Box 100,Vienna A-1400(Austria)
ABSTRACT Measuring ammonia(NH3)volatilization from urea-fertilized soils is crucial for evaluation of practices that reduce gaseous nitrogen(N)losses in agriculture.The small area of chambers used for NH3 volatilization measurements compared with the size of field plots may cause significant errors if inadequate sampling strategies are adopted.Our aims were:i)to investigate the effect of using multiple open chambers on the variability in the measurement of NH3 volatilization in urea-amended field plots and ii)to define the critical period of NH3-N losses during which the concentration of sampling effort is capable of reducing uncertainty.The use of only one chamber covering 0.015%of the plot(51.84 m2)generates a value of NH3-N loss within an expected margin of error of 30%around the true mean.To reduce the error margin by half(15%),3—7 chambers were required with a mean of 5 chambers per plot.Concentrating the sampling efforts in the first two weeks after urea application,which is usually the most critical period of N losses and associated errors,represents an efficient strategy to lessen uncertainty in the measurements of NH3 volatilization.This strategy enhances the power of detection of NH3-N loss abatement in field experiments using chambers.
Key Words: chamber method,experimental error,gas emission,low-cost chamber,nitrogen cycling,nitrogen loss,soil variability
INTRODUCTION
The amount of synthetic nitrogen(N)fertilizers used in agriculture globally in 2017 was estimated to be 150 Tg N year−1(USGS,2018)and may amount to 260 Tg N year−1by 2050(Mogollónet al.,2018).About 50%of the global N output as synthetic fertilizers is represented by urea(Heffer and Prud’homme,2016).A fundamental problem in using this fertilizer is the potential loss of N to the atmosphere as volatilized ammonia(NH3).Under favorable conditions for volatilization,the NH3-N loss can reach more than 50%of the applied urea-N(Martinset al.,2017).This process reduces the N-use efficiency of crops and causes air pollution because of the acidifying nature of NH3(Eurostat,2018).These losses also contribute indirectly to the greenhouse effect.Ammonia reacts in the atmosphere forming salts with a consequent redeposition of N to soil,which generates nitrous oxide(N2O)in the same manner as N fertilization(Kleinet al.,2007).The evaluation of mitigating techniques to reduce NH3volatilization,such as the use of enhanced-efficiency fertilizers,is based on field experiments with frequent use of chambers to trap NH3in acid solution(Cantúet al.,2017;Afsharet al.,2018).
Although the use of chambers to measure NH3volatilization in field experiments is common,the area of the plots is invariably much larger than the area covered by the chambers.Therefore,a question that may be raised is:how representative is the sampling of NH3trapped by a chamber in field plots? In fact,the first studies on NH3volatilization from fertilized soils were not usually performed under field conditions,but under laboratory or greenhouse conditions(Sokoloff,1938;Jewitt,1942).The development of chambers forin situmeasurement of NH3volatilization(Volk,1959;Nômmik,1973)made possible the conduction of experiments to evaluate N gaseous losses under more realistic field conditions,e.g.,with wetting-drying cycles in the soil,small-scale spatial variation in soil parameters,and plant-soil interactions. However, a difficulty that persists even after more than 50 years is to assess how much uncertainty is associated with measurements of NH3volatilization in field experiments.In statistics,the lower the uncertainty,the lower the probability of making a type II error(β),which is the failure to reject a null hypothesis that is actually false.The lower theβvalue,the higher the statistical power(1−β)of the test to evaluate the effect of treatments(Ellis,2010).In other words, the lower the uncertainty, the easier the detection of NH3-N loss abatement. However, decreasing the uncertainty involves increasing the sample size and,consequently, a higher cost of the measurement. Therefore, a rational strategy for field experiments is applying the principle of least effort or least cost required to obtain an estimate within an acceptable margin of error.
The uncertainty of the estimate is owing to the fact that the average value of NH3volatilization measured by chambersis not numerically equal to the real value of NH3volatilization(av)in the entire field plot.The uncertainty associated with the measurement is expressed by an error(E).

This error(E)is due to i)the specificity of the measurement method(Em),such as chamber design,ammonia-trapping efficiency,interaction with wind speed,and N quantification in laboratory,and ii)the sampling error(Es),which is usually the most critical factor(Cantaruttiet al.,2007).The sampling error depends on the number of sampling points in a given area,that is,the number of chambers per plot.The total error can be described as follows:

TheEs-type errors are determined by the variability in soil properties that influence N loss through NH3volatilization,such as small variation in particle size distribution,microrelief,soil water content,soil chemical properties,presence of organic residues,and urease activity.
Few studies have attempted to assess the uncertainty in NH3-N loss measurement,especially in small-scale areas,such as plots of field experiments(plots<100 m2).Most literature on spatial variability of gaseous emissions in smallscale areas has been focused on CO2(Pringle and Lark,2006;Herbstet al.,2009;Zhaoet al.,2018)and N2O(Chadwicket al.,2014;Liuet al.,2018).The assessment of uncertainty at the field-plot scale can serve as the basis to define the best strategy for the sampling of NH3derived from fertilized soils.Considering that the variability may also be time-dependent,concentrating sampling within critical periods of N losses and errors is an efficient approach to decrease the uncertainty in measurement of soil gaseous emissions (Bartonet al.,2015).
The assessment of uncertainty helps define the sampling strategy that optimizes the experimental efforts for attaining maximum possible precision in the measurements of NH3volatilization.The use of simple open chamber(Araújoet al.,2009)enables multiple observations per plot,making it possible to statistically assess the precision of quantification of NH3volatilization.The objectives of this study were:i)to investigate the effect of using multiple open chambers on the variability in the measurement of NH3volatilization in field plots amended with urea and ii)to define the critical period of NH3-N losses,wherein the concentration of sampling efforts is capable of reducing uncertainty.This kind of study would help improve the strategy of NH3sampling using chambers,with an increased power of detection of significant NH3-N loss abatement in field experiments.
MATERIALS AND METHODS
Field experiment
To assess the variability in NH3emission at the plot scale, an experiment using maize was designed and conducted from February to March 2017,in an experimental field of the Research Center for Agrobiology of the Brazilian Agricultural Research Corporation (Embrapa), in Seropédica,Brazil(22◦45′S,43◦40′W,altitude of 33 m).The soil of the area is a sandy clay loam,classified as a Haplic Acrisol according to the World Reference Base for Soil Resources(FAO,2015).The properties of the soil were:pH(H2O),5.8;organic carbon(C),8.5 g kg−1;total N,0.8 g kg−1;sand,680 g kg−1;silt,110 g kg−1;and clay,210 g kg−1.The area has a tropical climate with dry winter,mean annual temperature of 24◦C,and average annual rainfall of 1 300 mm.The area was deep-ploughed and disc-harrowed prior to the sowing of maize with a row spacing of 0.80 m.
Contrasting urea-based treatments were applied at the five-leaf stage of maize growth,with the purpose of creating contrasting cumulative N losses and different patterns of NH3volatilization.The following treatments were applied using side-dress application in a surface band:i)regular urea at 100 kg N ha−1(N100), ii)N-(n-butyl) thiophosphoric triamide(NBPT)-coated urea at 100 kg N ha−1(N100 +NBPT),iii)regular urea at 50 kg N ha−1(N50),and iv)control without N fertilizer.The coating of urea granules with NBPT,a urease inhibitor,was performed by adding a commercial solution(Agrotain®)at a rate of 530 mg NBPT kg−1urea.The experiment had a randomized complete-block design,with three replicates per treatment.Each plot was 7.2 m×7.2 m. One replicate plot of the control treatment was considered a missing observation because of poor emergence of maize seedlings,which could affect the NH3volatilization(e.g.,viathe effect on soil humidity).To perform the comparison among treatments,we applied the missing data formula technique for randomized complete block design(Gomez and Gomez,1984).
Measurement of NH3 volatilization
The NH3chambers were installed every 0.8 m along the surface band of urea (Fig. 1). To prevent any edge effect,NH3volatilization was not evaluated in an 80-cm strip at either end of the plot and the two outer rows. Therefore,the total number of chambers installed per plot was 49.To guarantee the uniformity of granules on the soil surface,small wood stakes were stuck each 80 cm along the location of the surface band-applied urea,dividing it into 9 segments.A corresponding amount of fertilizer was weighed and evenly spread in each segment, forming a 5-cm surface band at 15 cm distance from the maize stems. Metallic supports made of 4.2-mm diameter wire stakes were inserted 15 cm into the soil in the middle of each segment,forming three adjacent positions where the open chambers were relocated each day. The installation of the open chambers in each segment was performed immediately after urea application.The same scheme was followed in the control plots in the corresponding position to fertilized plots.The relocation of the chambers in three predetermined positions was performed to minimize an“umbrella effect”,that is,to avoid prolonged effects of chamber deployment on the soil surface and on the volatilization process itself(Martinset al.,2017).
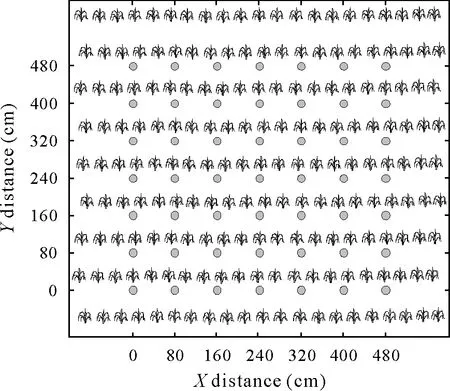
Fig. 1 Scheme of sampling of ammonia (NH3) volatilized after urea application using open chambers(circles)installed every 80 cm in a plot with maize.
The design of the open chamber was first introduced and calibrated by Araújoet al.(2009).A schematic representation of the chamber is shown in Fig.2.Briefly,the open chamber is made of a 2.0-L transparent polyethylene terephthalate bottle(soda bottle)with its bottom removed and carefully reattached above the top end of the bottle using a wire.This prevents the entry of rainwater and dust.The circular area covered by the open chamber was 78.5 cm2(10 cm diameter).A foam strip of 25 mm width,250 mm length,and 3 mm thickness was attached vertically inside the bottle using a wire with a small hook at the upper end and was hung from the top end of the bottle.The lower end of the foam strip was immersed in a 60-mL plastic pot containing 10 mL acid solution of H2SO4(1.0 mol L−1)and glycerol(2.0%,volume/volume).The foam strip was installed inside the chamber after soaked overnight in the acid solution to ensure a good NH3-trapping efficiency. During the NH3sampling periods,the plastic pot filled with the acid solution was positioned at the lower end of the wire to keep the foam strip moist with the solution. After urea application, the foams were collected and replaced at days 2,4,7,11,16,21,and 26.A“blank”chamber was installed in the middle of each plot to quantify the amounts of trapped NH3coming from the upper opening of the chamber(outside NH3).This“blank”chamber was identical to the one described above,except for a 40-cm plastic disc installed to cover the surface area enclosed by the chamber.
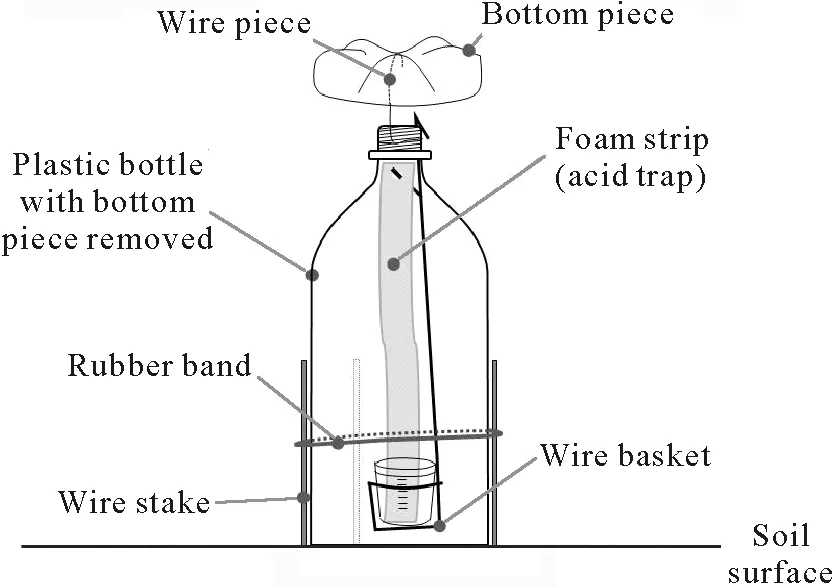
Fig. 2 Scheme of a simple open chamber for NH3 volatilization measurement under field conditions.Details of the chamber design were first presented by Araújo et al.(2009).
To optimize the replacement of the acid traps(foams),plastic pots containing new foams were placed close to their respective chambers before replacement.This operation was performed between 8:00 a.m.and 9:30 a.m.,following the same order of chambers,to avoid a time-series variability.The pots containing the foams collected from the field were transported to the laboratory,where the foam and the remaining solution in the pots were transferred to glass conical flasks. A 40-mL volume of deionized water was added to the conical flasks to extract N from the foams by shaking for 20 min on an orbital shaker at 220 r min−1.To determine the N concentration of this solution,a 10-mL aliquot was analyzed by steam distillation(Kjeldahl method)and subsequent titration of the distillate against 15 mmol L−1sulfuric acid.
We calculated the amounts of fertilizer-N applied per chamber based on the formulae for the area of a circular segment(Weisstein,2019).Considering the diameter of the chamber as 10 cm and that of the fertilizer band as 5 cm centered in the circular area of the chamber,we calculated the area fertilized and enclosed by chamber as 47.82 cm2.The urea rates in the area specifically covered by the 5-cm surface band was 8 mg N cm−2in the N50 treatment and 16 mg N cm−2in the N100 and N100+NBPT treatments.Therefore,the amount of N applied per chamber was 382.6 mg for treatment N50 and 765.1 mg for treatments N100 and N100+NBPT.These N application amounts per chamber were used to calculate the amount of NH3-N losses as follows:

where NLDF is the NH3-N loss derived from urea in kg N ha−1,NTC is the NH3-N trapped in the chamber in fertilized plots in mg N,NTCcis the NH3-N trapped in the chamber in control plots in mg N(background emission),1.74 is the correction factor for the chamber trapping efficiency(Araújoet al.,2009),NAC is the amount of urea applied per chamber in mg N, and UNR is the equivalent urea-N rate in kg N ha−1.The amount of NH3-N loss in control plots(NLC)in kg N ha−1was calculated as follows:

where 10−6,104,and 78.54×10⁻⁴are the factors to convert mg N per chamber to kg N ha−1,considering that 1 mg is 10−6kg,1 ha is 104m2,and the circular area of the chamber is 78.54×10⁻⁴m2.The amounts of outside NH3-N trapped in the respective “blank”chambers were subtracted from the total NH3-N trapped by the chambers to determine the values of NTC and NTCc.
Supporting variables
During the period of measurement of NH3volatilization,the daily precipitation was recorded by an automated pluviometer installed in the experimental area(RainWise Inc.,USA). Soil samples were taken from each plot (0—10 cm layer) on a daily basis and were oven dried (105◦C) to determine the gravimetric water content.The volumetric soil water content was determined by multiplying the gravimetric water content by soil bulk density,which was determined using the undisturbed core method(Blake and Hartge,1986).
Descriptive statistics and determination of required number of chambers per plot
The data obtained from the field experiment were analyzed in order to obtain the basic descriptive statistics parameters,including minimum and maximum values,mean,standard deviation,coefficient of variation(CV),and parameters describing the shape of values distribution(skewness and kurtosis).The normality of the data distribution for each plot was tested by Shapiro-Wilk’s test.The number of chambers required to determine the mean within a given margin of error was estimated using the following equation:

wherenis the number of chambers required per individual plot,dis the margin of error,tα=0.05is Student’stcritical value associated with the confidence level of 5%,ands2is the variance of the data set. The statistical analyses were performed using R software(R Development Core Team,2017).
Literature review on NH3-N losses from urea
We compiled data from published studies showing results of NH3volatilization from soils fertilized with urea in experiments conducted in different regions of the world(Table I).The purpose of this compilation was to obtain an overview of the most critical periods of NH3-N losses after urea application to soils.From these studies,we extracted the data on localization,soil textural class,soil pH,method of measurement of NH3volatilization,treatments tested in the study,and urea-N rates(kg N ha−1).The software GetData Graph Digitizer 2.24 (http://getdata-graph-digitizer.com)was used to obtain the cumulative NH3-N losses over the measurement period after urea application.Based on these data extracted from the graphs, we determined the total NH3-N loss as a percent of added N and the period for the occurrence of 70%of the total NH3-loss.
RESULTS AND DISCUSSION
Cumulative NH3 volatilization measured considering the whole set of chambers
The maintenance of volumetric soil water content close to 0.20 cm3cm−3in the first few hours after N application was caused by a precipitation of 40 mm prior to fertilization(Fig.3a),which was a condition favorable for urea hydrolysis and promoted the occurrence of NH3-N volatilization losses(Fig.3b).The NH3volatilization estimated using data from the whole set of chambers per plot(n=49)showed that the cumulative NH3volatilization amounted to 26.8 kg N ha−1in the N100 treatment,20.6 kg N ha−1in the N100+NBPT treatment,17.8 kg N ha−1in the N50 treatment,and only 0.8 kg N ha−1in the control(Fig.3c).
Considering the whole set of chambers per plot, the between-block errors indicated by error bars in Fig.3c were<1.0 kg N ha−1. By subtracting the NH3-N volatilized from control,it can be seen that the coating of urea granules with NBPT decreased the NH3-N loss by approximately25% (α= 0.05) (Fig. 3c). The reduction of urea-N rate by half(N50)caused an NH3-N loss equivalent to 34%of applied N,that is, a higher proportional NH3-N loss than that observed in the N100 treatment(26%of applied N).A possible explanation of the increase in proportional NH3-N loss by reduction of N rate is the higher urease efficiency,caused by a lower substrate:enzyme(urea:urease)ratio.
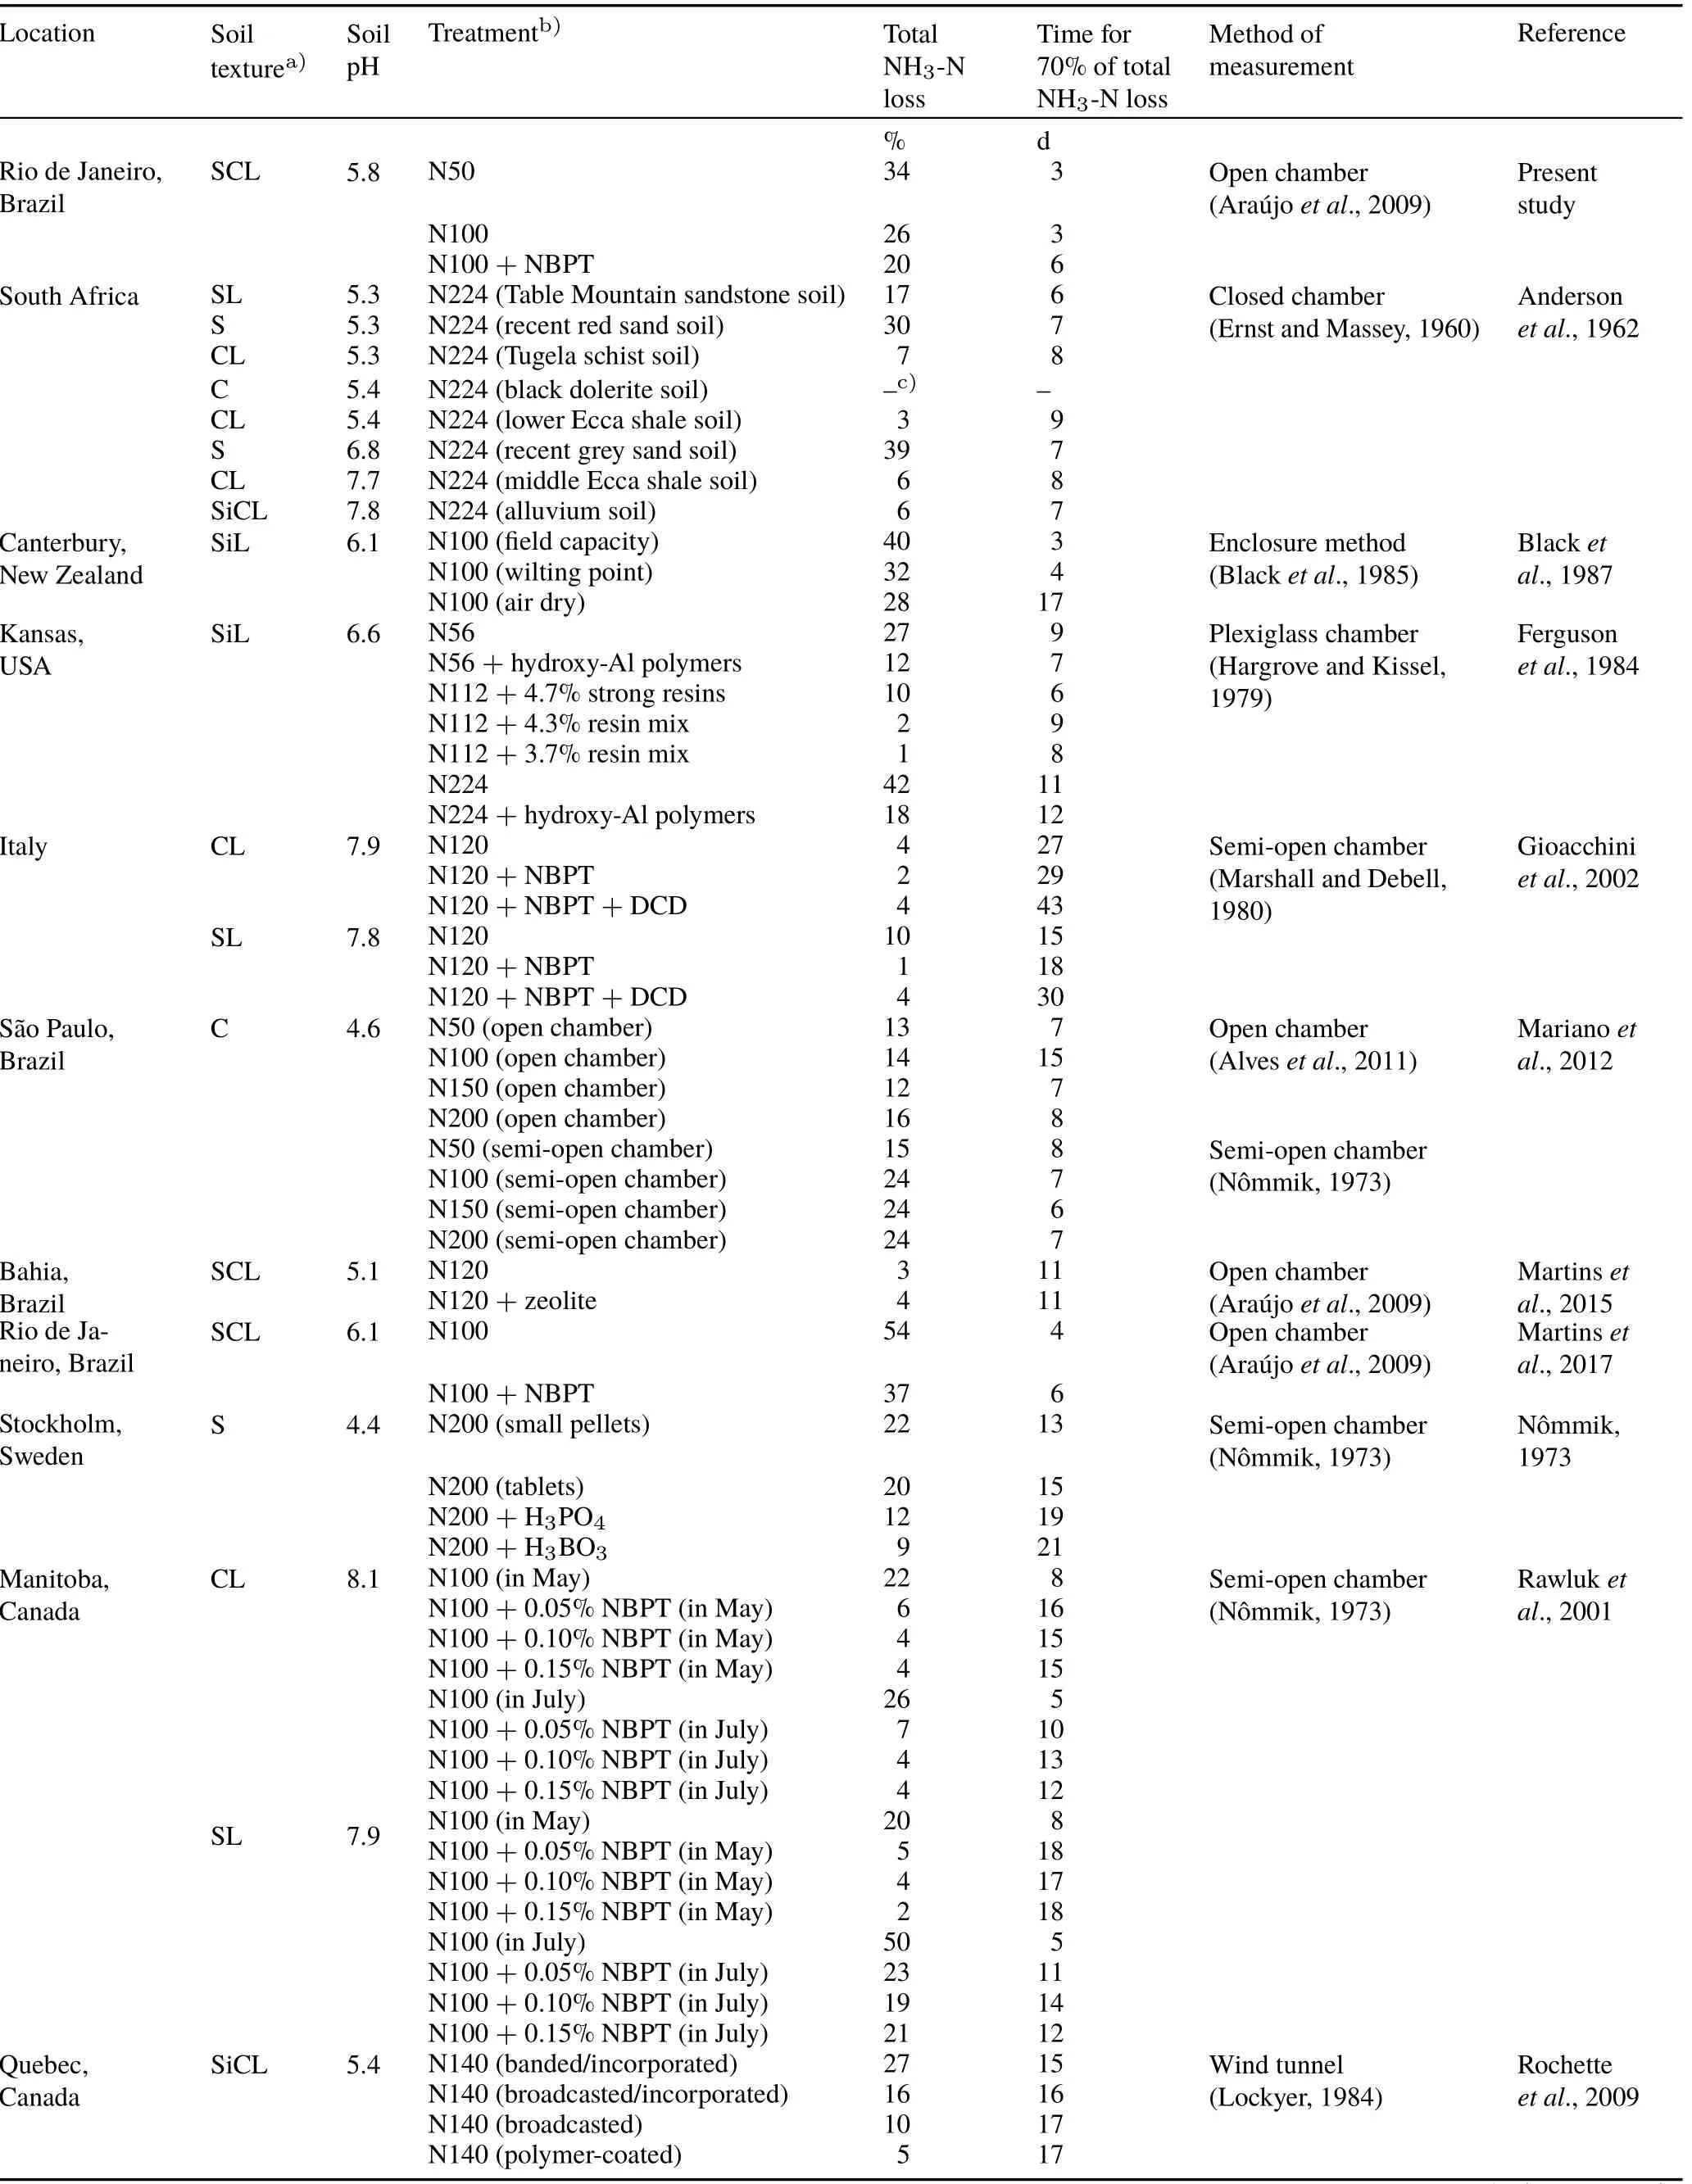
TABLE I Summary of data from studies on NH3-N losses from soils amended with urea
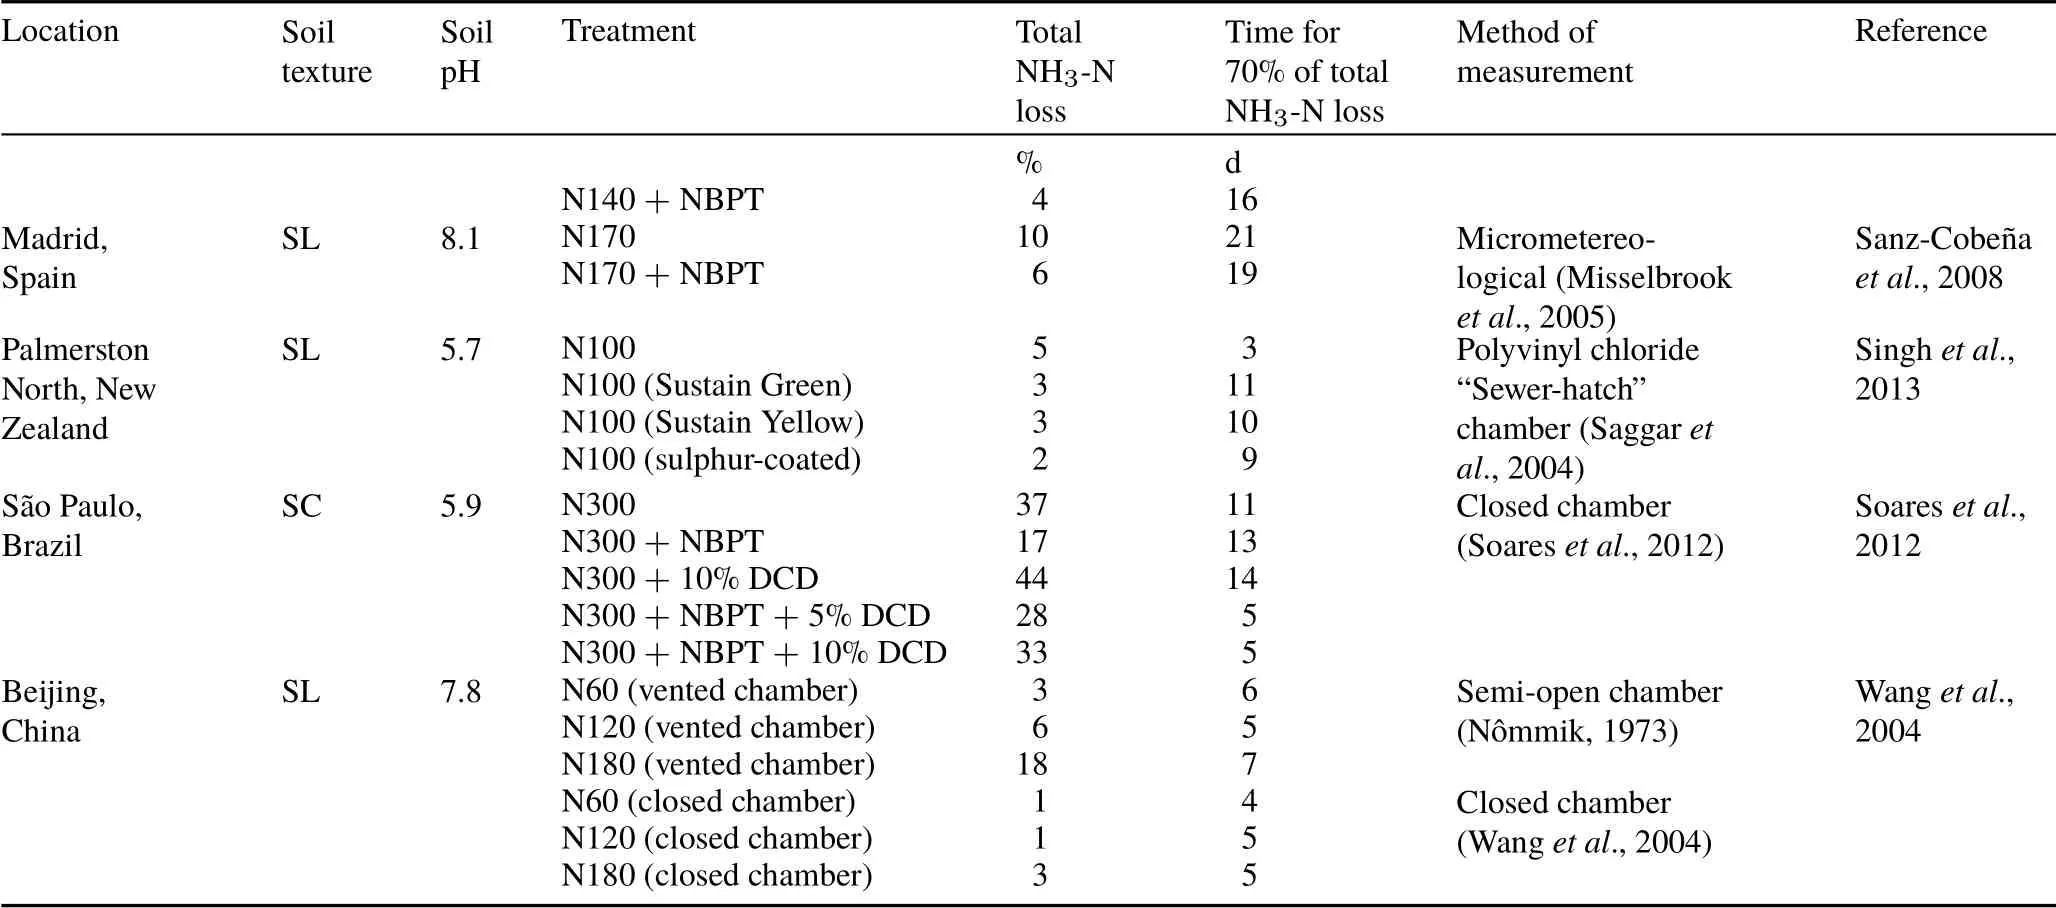
TABLE I(continued)
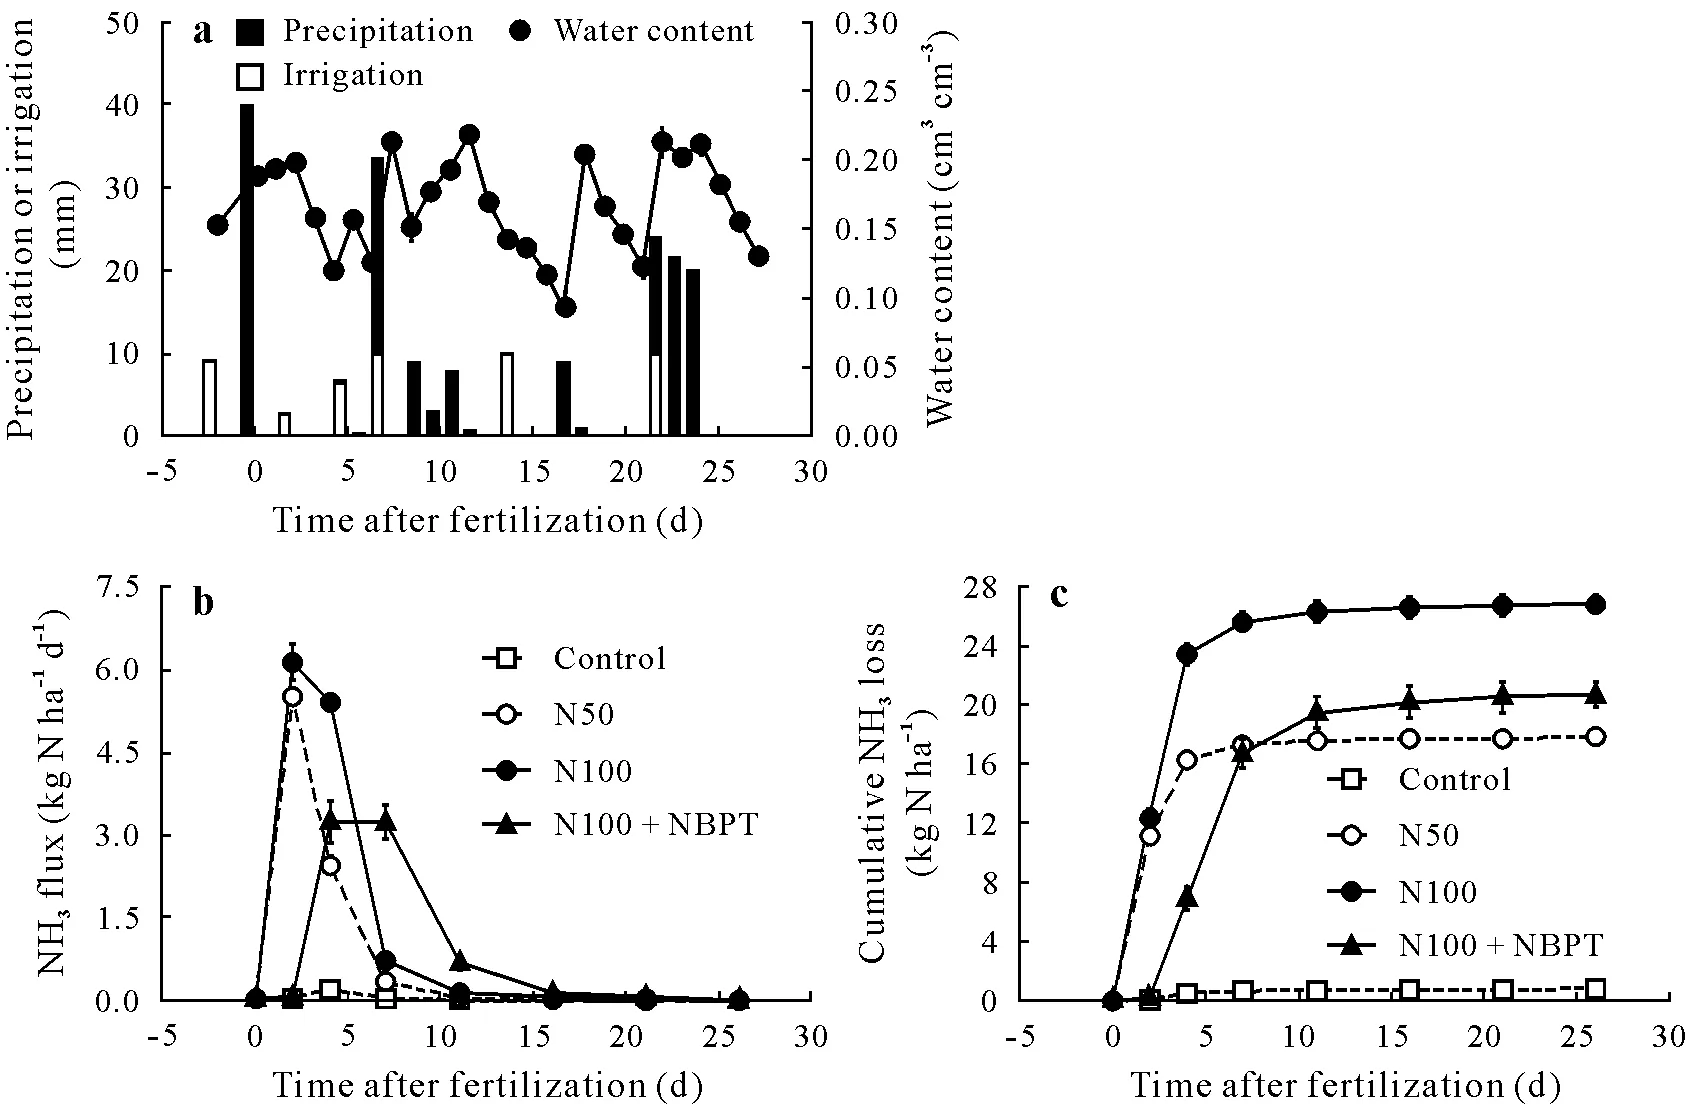
Fig.3 Precipitation,irrigation,and soil water content(a)and NH3 flux(b)and cumulative NH3 loss(c)from the control and urea-applied treatments during the field experiment in Seropédica,Brazil.The estimates were performed considering the mean NH3 loss of the 49 chambers installed in each plot.Bars are standard errors(n=3).Cumulative NH3 losses followed by different letters are significantly different based on Tukey’s honestly significant difference(HSD)test(α=0.05).Control=without nitrogen(N)fertilizer;N50=regular urea at 50 kg N ha−1;N100=regular urea at 100 kg N ha−1;N100+NBPT=N-(n-butyl)thiophosphoric triamide(NBPT)-coated urea at 100 kg N ha−1.
Temporal dynamics and standard errors of NH3 volatilization
Box plots were used to show the variability in NH3losses in each individual fertilized plot across different measurement periods(Fig.4).It can be clearly seen that the highest mean NH3-N losses occurred from day 0 to day 7 after application of regular urea(N50 and N100),and from day 2 to day 11 after application of urea granules coated with urease inhibitor(N100+NBPT).Using the data from the whole set of chambers from each plot,we determined the pattern of temporal variation in standard errors of NH3volatilization,in kg N ha−1d−1for each N treatment(Fig.5).This between-chamber errors peaked during the first 48 h after the fertilizer application in all the evaluated plots.These results indicate that the use of multiple chambers per plot during the first few days after urea application,which was the most critical in terms of mean losses and associated errors(Fig.5),would be an efficient strategy to reduce the uncertainty.Increasing the number of chambers can increase the reliability of the comparison of N treatments,when it is not possible or not viable to use large number of replicates in experimental fields.
Based on our estimates,70%of the total NH3-N losses occurred in the first 3 d after urea application in the N50 and N100 treatments and in the first 6 d after NBPT-coated urea application in N100+NBPT(Fig.1). Taking into consideration this same threshold level of cumulative losses(70%of total loss),we analyzed the results of NH3volatilization from urea-based fertilizers in studies conducted in different regions of the world(Table I).This analysis revealed that the major part of NH3-N losses usually occurs during the first two weeks after urea-N application,especially in studies showing high total NH3-N losses(>10%of applied N).This is consistent with the idea that the use of multiple chambers during the initial period following urea application,when the peak of emission and associated error is expected,represents a strategy to improve the precision of NH3volatilization measurements.This is a common temporal pattern for the NH3emission after urea amendment to soil(Table I),and it is significantly less variable than the temporal pattern of emission of other gases from soil(Bartonet al.,2015;Zhaoet al.,2018).For example,the prediction of the most critical periods of soil N2O or CO2emissions is relatively complex because of their high temporal variability (Bartonet al.,2015;Zhaoet al.,2018).
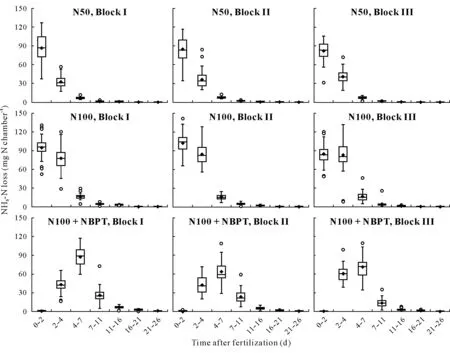
Fig.4 Box plots of NH3-N loss from individual field plots.The boxes indicate the range from the first to the third quartile.The median is indicated by horizontal line within the box.Diamonds indicate mean values(n=49).Whiskers show the upper and lower extremes.Circles indicate outliers.N50=regular urea at 50 kg N ha−1;N100=regular urea at 100 kg N ha−1;N100+NBPT=N-(n-butyl)thiophosphoric triamide(NBPT)-coated urea at 100 kg N ha−1.
Descriptive statistics
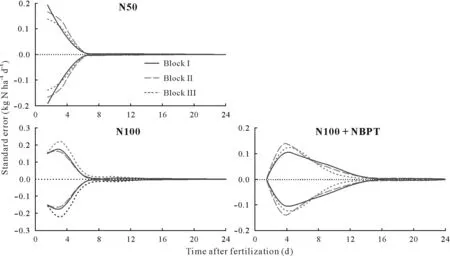
Fig.5 Standard error of the mean of NH3 volatilization for each individual plot as a function of the time after urea application to soil.N50=regular urea at 50 kg N ha−1;N100=regular urea at 100 kg N ha−1;N100+NBPT=N-(n-butyl)thiophosphoric triamide(NBPT)-coated urea at 100 kg N ha−1.
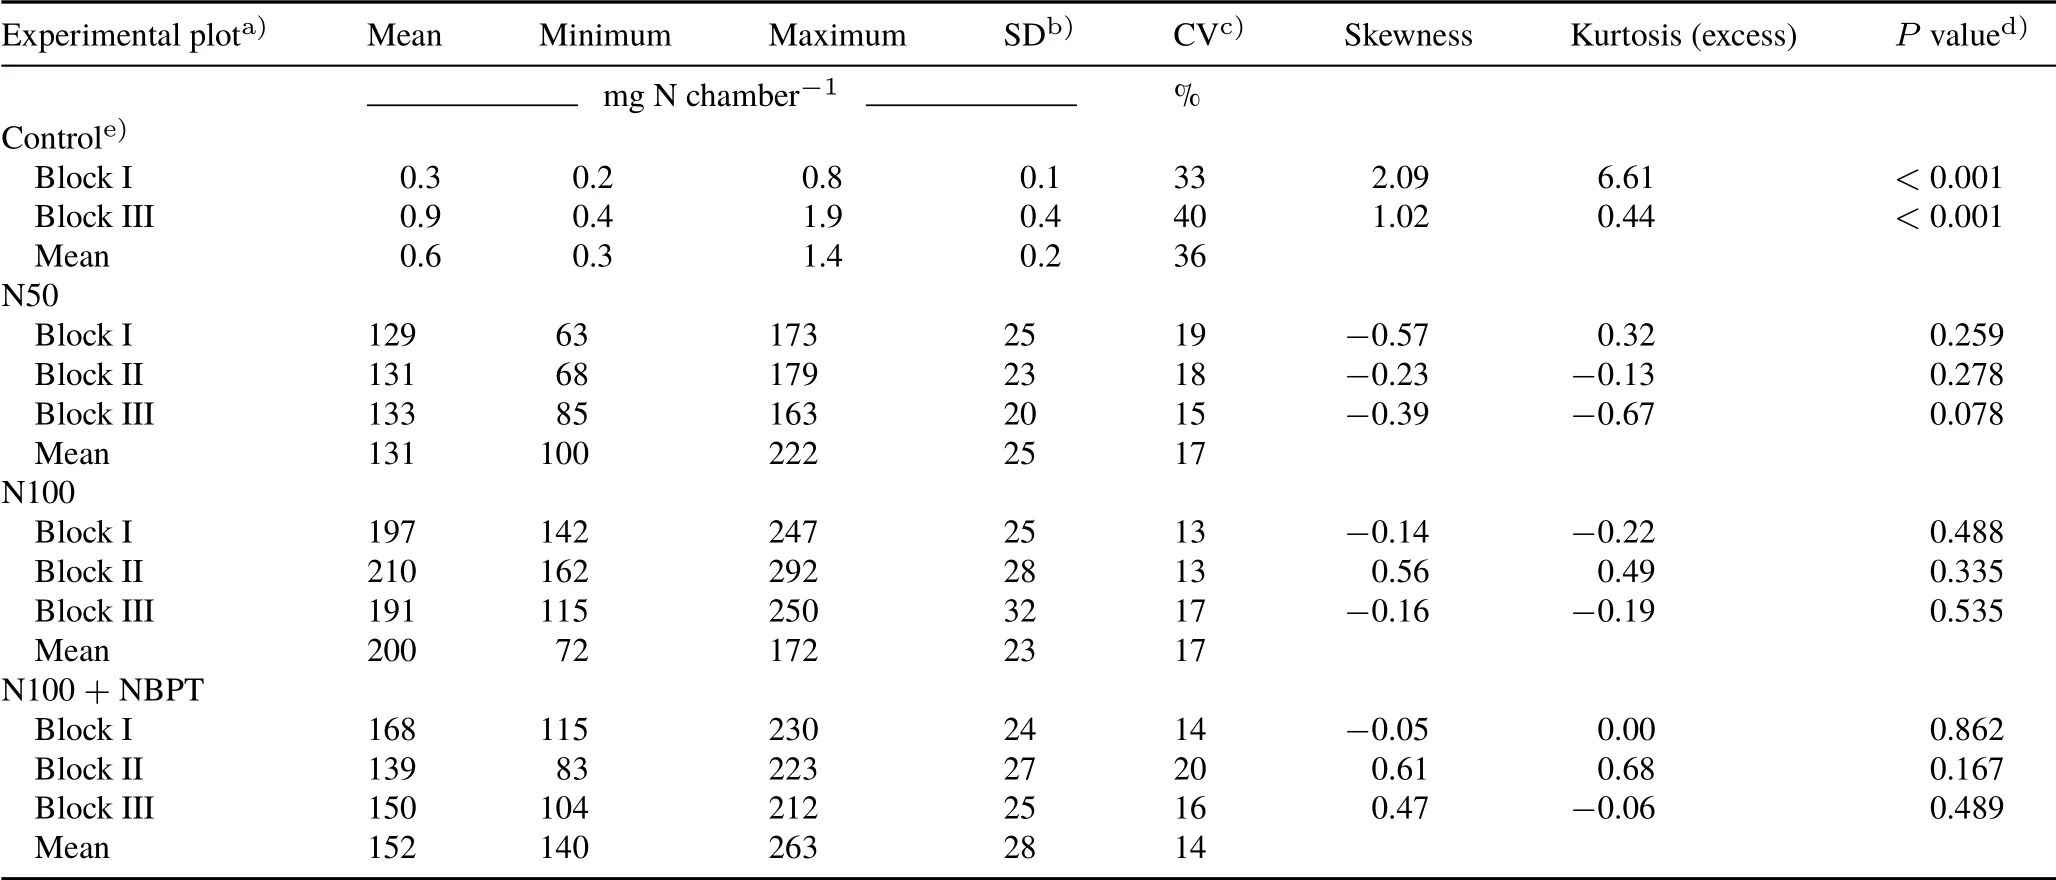
TABLE II Statistical summary of the cumulative NH3-N loss after the surface application of urea to maize crop at the five-leaf growth stage in the experimental field plots,where open chambers(49 in each plot)were used for the measurements
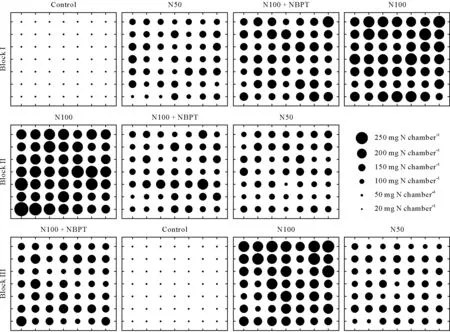
Fig.6 Variation in cumulative NH3-N loss measured by plastic bottle chambers placed on a 0.80-m2 grid after urea-N was surface applied to maize crop at the five-leaf growth stage in the four treatments of a field experiment in Seropédica,Brazil.Forty-nine chambers were used in each plot.One replicate plot of the control treatment was considered a missing observation because of poor emergence of maize seedlings.Control=without N fertilizer;N50=regular urea at 50 kg N ha−1;N100=regular urea at 100 kg N ha−1;N100+NBPT=N-(n-butyl)thiophosphoric triamide(NBPT)-coated urea at 100 kg N ha−1.
Considering the total NH3-N losses from each sampling point of each plot, it is apparent that, even with the level of between-chamber variability, there is an evident effect of the N rate and that of the urease inhibitor(Fig.6).The mean NH3-N loss per plot(n=49),in mg N chamber−1,ranged 0.3—0.9 in the control,129—133 in the N50 treatment,139—168 in the N100+NBPT treatment,and 191—210 in the N100 treatment(Table II).The magnitude of the betweenchamber CV was similar for the different fertilized treatments.The CV ranged 13%—17% in the N100 treatment, 14%—20% in the N100 + NBPT treatment, and 15%—19% in the N50 treatment. The values of skewness, kurtosis, and the significance of Shapiro-Wilk test showed that the NH3volatilization from different chambers in each fertilized plot followed a normal distribution.On the other hand,the observations in the control plots presented a higher CV than the fertilized plots(33%—40%)and did not follow a normal distribution.However,even with a higher CV and non-normal distribution of observations in the control plots,it was not expected that the background emissions of NH3significantly affected the overall variability of the experiment,considering that the NH3-N losses in the control plots and their associated errors were very low compared to values for the fertilized plots (Fig. 6, Table II). For example, the maximum value of NH3-N loss observed in the chambers from the control plots(1.9 mg N chamber−1,block III)was only 3%of the minimum NH3-N loss observed in the chambers from the fertilized plots(63 mg N chamber−1,block I of N50).
The level of between-chamber variability observed in the present study(Table II)was significantly higher than the variability obtained from N analysis in laboratory(Kjeldahl method)for the quantification of NH3-N trapped in foams(Table III).The variability in the N analysis is a part ofEmtype error.The precision of the analyses was very high in samples representing losses higher than 1.0 mg N chamber−1.Above this threshold,the CV of the N analysis ranged 0.3%—2.3%, which was very low compared with the betweenchamber CV of the fertilized plots(13%—20%,Table II).
Required number of observations
Using a classical statistical approach based on the standard deviation of the observations,we estimated the required number of chambers per plot as a function of the expected margin of error(Table IV).The required number of chambers per plot did not vary significantly with the treatment applied.It was shown that the use of only one chamber per plot generated a value of NH3-N loss within an expected margin of error of 30%of the true mean.To have a value of NH3-N loss within a margin of error reduced by half (15%), 3—7 chambers were required,with a mean of 5 chambers per plot.For a 12.5%margin of error,Herbstet al.(2009)estimated that 5—123(31 on average)observations were required formeasurement of CO2emission within a 13 m×14 m bare soil test plot in Germany.
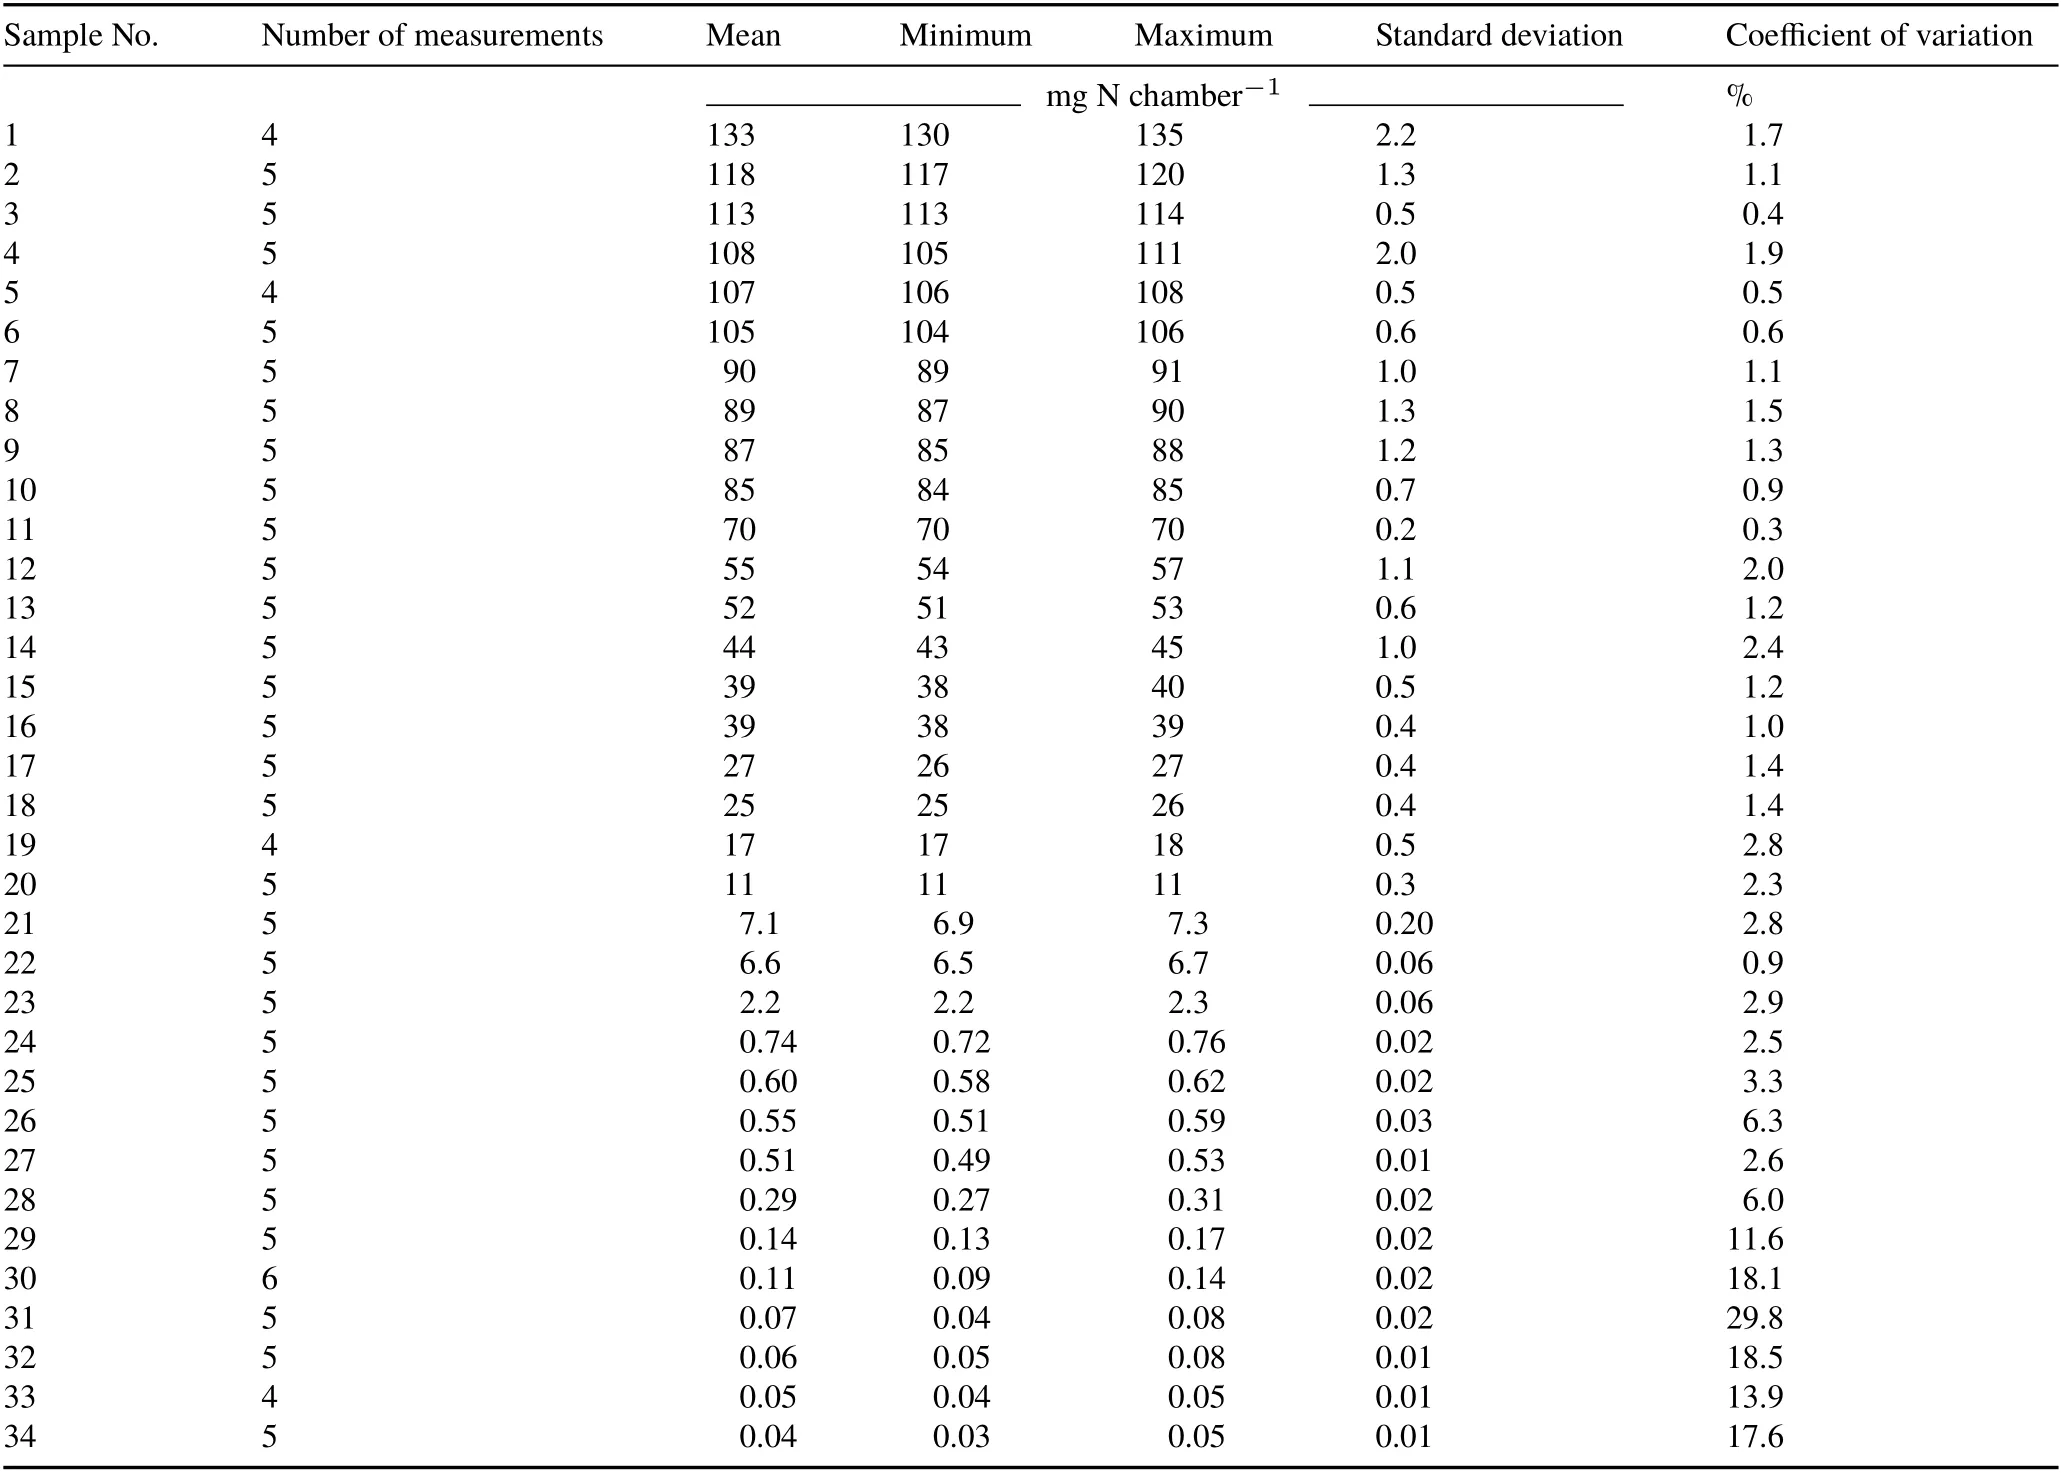
TABLE III Test-retest reliability of the Kjeldahl method for NH3-N determination in randomly selected solutions extracted from the foams used to trap NH3 in the open chambers installed in the field

TABLE IV Required number of chambers per plot as a function of the expected margin of error in the measurement of NH3 volatilization in some urea-fertilized plots,considering α=0.05,degrees of freedom=48,and Student’s t=2.011
Methodological considerations
The main advantages of the open chambers used in the present study are simple construction,low cost,easy handling in field experiments,allowing more replication,and free air circulation through the chamber,thereby minimizing the effect of chamber deployment on NH3exchange at the soil-atmosphere interface.This chamber can be used either in small experimental units,such as pots in greenhouse experiments,or in larger areas,such as the field plots in the present study.The concern regarding the variability observed in the present study for the open chamber would also be applicable to any type of chambers used to measure gaseous emissions from soil in field plot-based experiments.Our results showed the importance of using multiple chambers per plot to increase the precision of NH3emission measurements using open chambers.However,this strategy involves additional costs and time spent in field for the handling of the chambers.Taking into account that the error in laboratory analyses(part ofEm-type error)is usually negligible compared with the field sampling error (Es-type error) (Cantaruttiet al.,2007),a viable method for reducing cost when using multiple chambers is the analysis of N concentration using a composite solution,obtained from traps(foams)of different chambers from a same field plot.It is also important to highlight that the conventional use of multiple plots per treatment(replicates)in field experiments intrinsically improves the precision of NH3-N loss estimates,even when using a single chamber per plot.
The variability in the measurements of NH3volatilization using open chambers compared to other methods (e.g.,micrometeorological systems, closed dynamic chambers)and under contrasting types of soil and climate should be addressed in future research.This step is important to evaluate new techniques for enhancing the urea-N use efficiency in agricultural soils and for mitigating the environmental pollution caused by NH3volatilization.
CONCLUSIONS
Our study showed that using multiple open chambers per plot during the most critical period of NH3volatilization and associated errors is an effective way of reducing the uncertainty in the measurements of total NH3-N losses in field experiments designed to evaluate the efficiency of ureabased fertilizers.Concentrating sampling efforts in the first two weeks after urea application,which is usually the most critical period of N losses and associated errors,is an efficient strategy to lessen uncertainty in the measurements of NH3volatilization.This strategy enhances the power of detection of NH3-N loss abatement in field experiments,thus partially offsetting the uncertainty related to the small area of the chamber.
ACKNOWLEDGEMENTS
This study was supported by the International Atomic Energy Agency(IAEA),Vienna,Austria through a Coordinated Research Project(No.D15016),the“Carlos Chagas Filho”Foundation for Support of Research in the State of Rio de Janeiro(FAPERJ)of Brazil with grants awarded to BJRA,CPJ,RMB,and SU and postdoctoral scholarships to MRM and SS,the Brazilian National Council for Scientific and Technological Development(CNPq)for the Productivity Grant(PQ)awarded to BJRA,CPJ,RMB,and SU and scholarships to LFS,CAS,KEA,and RCS.We thank Altiberto M.Baêta,Carlos Brito Prestes,Eduardo Rodolfo Rodrigues da Silva,and Raysa Alves Vila Nova from Embrapa for their assistance with the field work and the laboratory analyses.
杂志排行
Pedosphere的其它文章
- Yield-scaled nitrous oxide emissions from nitrogen-fertilized croplands in China:A meta-analysis of contrasting mitigation scenarios
- A simple and easy method to measure ammonia volatilization:Accuracy under field conditions
- Nitrification inhibitor nitrapyrin does not affect yield-scaled nitrous oxide emissions in a tropical grassland
- Decreased nitrous oxide emissions associated with functional microbial genes under bio-organic fertilizer application in vegetable fields
- Nutrient cycling and greenhouse gas emissions from soil amended with biochar-manure mixtures
- Nitrapyrin effectiveness in reducing nitrous oxide emissions decreases at low doses of urea in an Andosol
