Yield-scaled nitrous oxide emissions from nitrogen-fertilized croplands in China:A meta-analysis of contrasting mitigation scenarios
2021-04-14GarbaALIYUJiafaLUOHongDIDeyanLIUJunjiYUANZengmingCHENTiehuHEandWeixinDING
Garba ALIYUJiafa LUOHong J.DIDeyan LIU∗Junji YUANZengming CHENTiehu HE and Weixin DING∗
1State Key Laboratory of Soil and Sustainable Agriculture,Institute of Soil Science,Chinese Academy of Sciences,Nanjing 210008(China)
2University of Chinese Academy of Sciences,Beijing 100049(China)
3AgResearch Limited,Ruakura Research Centre,Hamilton 3240(New Zealand)
4Faculty of Agriculture and Life Sciences,Lincoln University,Lincoln 7646(New Zealand)
ABSTRACT Nitrogen(N)losses in cropland resulting from the application of synthetic fertilizers decrease crop productivity and exacerbate environmental pollution.Mitigation measures,such as reduction in N fertilizer application rates,can have unintentional adverse effects on crop yield.We conducted a meta-analysis of soil N2O emissions from agricultural fields across China under contrasting mitigation scenarios as a novel approach to identify the most effective strategy for the mitigation of emissions of N2O derived from N fertilizer use in China.Current standard agricultural practice was used as a baseline scenario(BS),and 12 potential mitigation scenarios(S1—S12)were derived from the available literature and comprised single and combinations of management scenarios that accounted for crop yield.Mitigation scenarios S6(nitrification inhibitor 3,4-dimethylpyrazole phosphate)and S11(20%reduction in N application rate plus nitrification inhibitor dicyandiamide)in maize,rice,and wheat crops led to an average 56.0%reduction in N2O emissions at the national level,whereas scenario S4(nitrification inhibitor dicyandiamide)led to yield optimization,with a 14.0%increase for maize and 8.0%increase for rice as compared to the BS.Implementation of these most effective mitigation scenarios(S4,S6,and S11)might help China,as a signatory to the 2015 United Nations Framework Convention on Climate Change(Paris Agreement),to achieve a 30%reduction in N2O emissions by 2030.
Key Words: crop yield,emission factor,nitrification inhibitor,nitrogen partial factor productivity,N2O emission,yield-scaled emission
INTRODUCTION
The application of synthetic nitrogen(N)fertilizers and animal manure has resulted in agriculture becoming a major source of increased global N2O emissions (Stehfest and Bouwman, 2006; Zaman and Nguyen, 2012; Zhouet al.,2017): 60% of global N2O emissions are derived from agricultural production(Ciaiset al.,2013).According to the United Nations Department of Economic and Social Affairs(2015),the current global population is expected to reach 9.7 billion by 2050 from present 7.3 billion. In order to accommodate the predicted doubling of the food demand by an increasing population(Muelleret al., 2012), China will likely become one of the largest global consumers of N fertilizer(Heffer,2016).Increasing inputs of N fertilizer provide substrates for the production of N2O (Ruser and Schulz, 2015)and accelerate the growth of soil nitrifying microbe communities (Patraet al., 2006; Schausset al.,2009;Akiyamaet al.,2013),which in turn,stimulates the primary drivers of N2O emissions(Senbayramet al.,2009).Improvement of N utilization through enhanced agronomic management practices and new technologies has emerged as a strategy to ensure crop yield optimization and reduce the negative impacts of N fertilizer use(Cassmanet al.,2002;Fanet al.,2004)that have led to regional-and global-scale environmental problems(Juet al.,2004;Chenet al.,2011).
In China,these proposed strategies to increase N fertilizer use efficiency(NUE)and reduce N losses through leaching,volatilization, nitrification, and denitrification include the use of urease and nitrification inhibitors(UIs and NIs,respectively) and the application of slow-release fertilizers,along with novel methods of their application (Xuet al.,2002;Yu and Chen,2010;Dinget al.,2011,2015;Zhanget al.,2012;Yinet al.,2017;Niuet al.,2018).While some of these strategies have little or no adverse impact on crop yields(Oenemaet al.,2009;Abaloset al.,2014;Doughertyet al.,2016),others have been shown to be more effective in the national targets for environmental mitigation of N losses(Sanz-Cobenaet al.,2014).For example,NIs have been shown to improve NUE by reducing N2O emissions and nitrate leaching losses(Dobbie and Smith,2003;Di and Cameron,2007;Zamanet al.,2008;Fangueiroet al.,2009;Ventereaet al.,2011;Sanz-Cobenaet al.,2012;Dinget al.,2015;Heet al.,2018),with a reduction of N2O emissions by 39%—65%in paddy,upland,and grassland soils(Akiyamaet al., 2010; Qiaoet al., 2015; Di and Cameron, 2016;Gilsanzet al.,2016)and with no toxicological side effects to agricultural soils,compared with other strategies(Weiskeet al.,2001;Zerullaet al.,2001;Luoet al.,2010;Di and Cameron,2012;IPCC,2014;Ruser and Schulz,2015).The NIs also yielded greater economic benefits compared to other N management practices(Liuet al.,2016;Xiaet al.,2017).Therefore,NIs play a potential role in strategies designed to reduce N2O production.
Globally,there is an urgent challenge to develop effective N2O mitigation scenarios, including improved NUE, in response to increased food demand,while maintaining and increasing agricultural yields with minimum environmental impact (Ruser and Schulz, 2015). Some N2O mitigation strategies have not been widely implemented, owing to a lack of sustained yield increase and poor economic return on the associated additional costs(Guertal,2009).Linking N2O mitigation to crop yield is key to the evaluation of mitigation scenarios, because farmers will not apply measures that result in a yield penalty(Sanz-Cobenaet al.,2014).
The national carbon footprint in China contributes to higher greenhouse gas emissions compared to other countries such as Canada and Japan(Xiaet al.,2016)owing to differences in synthetic N fertilizer use,and this variability currently restricts the estimation of overall efficacy of N2O emission mitigation strategies in China.Therefore,we proposed and evaluated contrasting N2O mitigation strategies in agricultural fields across China in order to improve the national level of global food security and environmental sustainability (Xiaet al., 2017). The specific objectives of this study were i)to quantify the contribution of major cropping systems to N2O emissions under each proposed scenario,and ii)to assess the effectiveness of the scenarios on crop yield.
DATA COLLECTION AND ANALYSIS
We used two peer-reviewed datasets indexed in the Web of Science and China Knowledge Integrated Database(CNKI),which were derived from field studies in various climatic zones across China.The first comprised 218 data points related to UIs and NIs(Table SI,see Supplementary Material for Table SI),and the second comprised 112 measurements of N2O emission and emission factors(EFs).The datasets were summarized according to crop type,as adopted by Bouwmanet al.(2001),a FAO report,and Shepherdet al.(2015)to create the database(Table SII,see Supplementary Material for Table SII),where fertilizer-induced EFs were not originally reported.We calculated EF as:

whereEN2O,fertilizerandEN2O,controldenote the N2O emissions in the N-fertilized and unfertilized treatments,respectively,and Nappliedis the application rate of N fertilizer.The crop-specific N2O EFs of N applied are shown in Fig.S1(see Supplementary Material for Fig.S1).
Next,we created experimental scenarios:the baseline scenario (BS) represents current N application rates and crop yields in China without any N2O mitigation measures adopted by farmers,and 12 contrasting mitigation scenarios(S1—S12)were based on available literature from cropland in China(Table I).Mitigation scenarios S1 and S2 representthe croplands that received 10%and 20%less N addition,respectively,compared with the BS,and would not result in reduced yield output under improved agronomic practices(Juet al.,2009;Chenet al.,2014;Xiaet al.,2016);whereas proposed scenarios S3 to S12 assumed that use of NIs results in greater net economic benefits as compared to N-based management practices (Liuet al., 2016; Xiaet al., 2017). Specifically, the scenarios were as follows: S3=UI nitrophosphate,N-(n-butyl)thiophosphoric triamide(NBPT);S4=NI dicyandiamide(DCD);S5=NI nitrapyrin;S6 = NI 3,4-dimethylpyrazole phosphate (DMPP); S7 =NBPT +DCD;S8 =NBPT +DMPP;S9 =DCD +UI hydroquinone(HQ);S10=N reduced by 20%+NBPT(S2×S3);S11=N reduced by 20%+DCD(S2×S4);and S12=N reduced by 20%+NBPT+DCD(S2×S7).
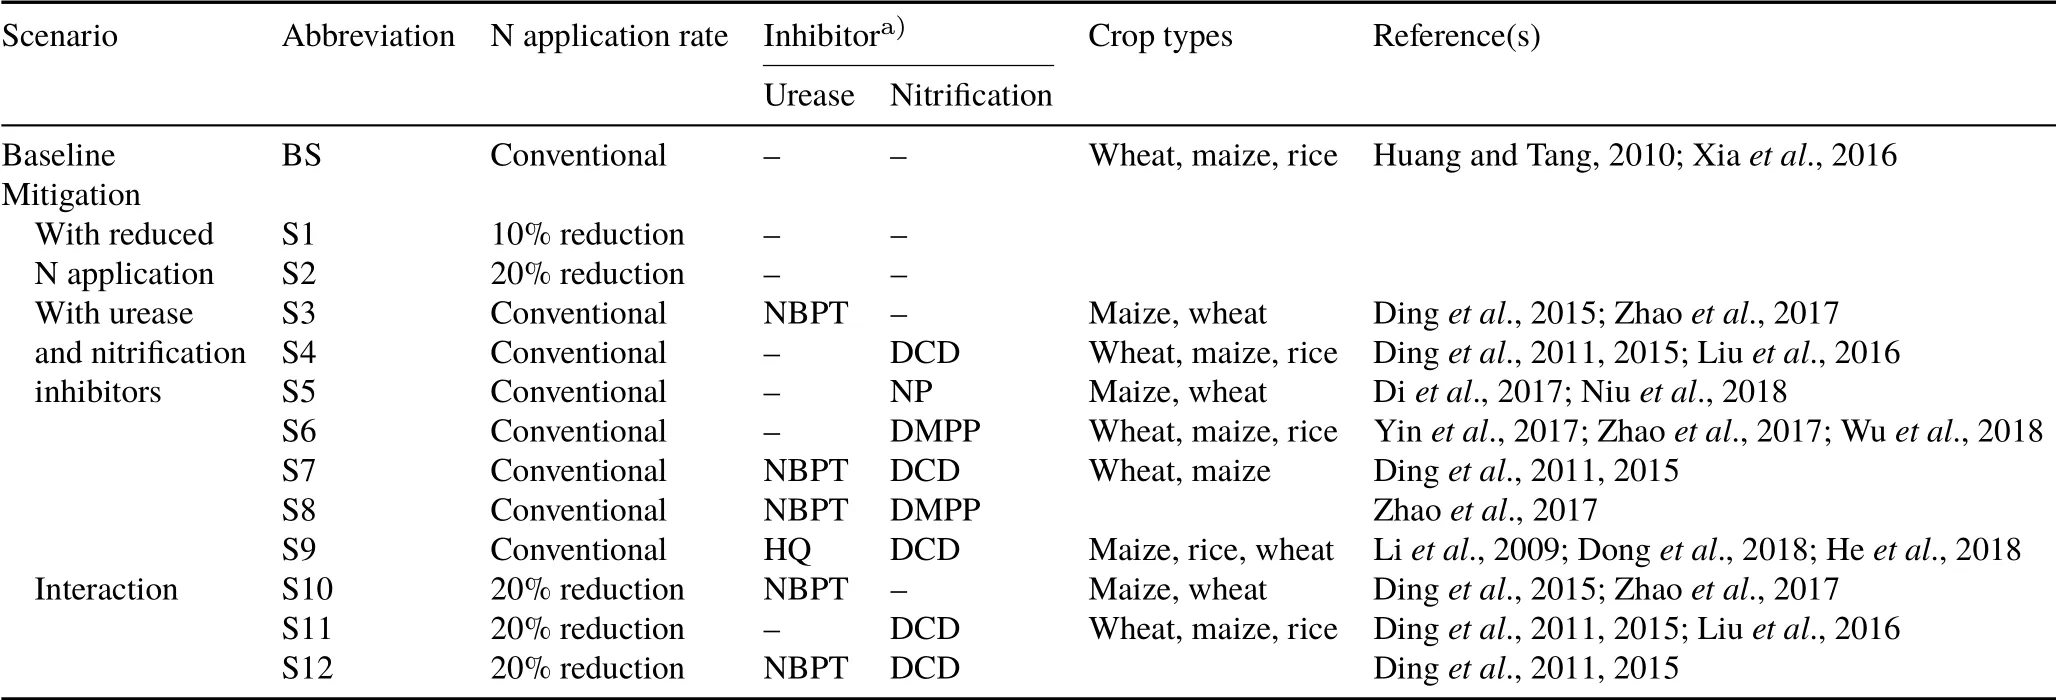
TABLE I Description of baseline and mitigation scenarios for soil N2O emissions
Scenarios S3,S5,S7,S8,and S12 were not evaluated for rice cropping owing to a lack of field data.Data for crop sowing areas were obtained from the China Statistical Year Book (2016) (Table SIII, see Supplementary Material for Table SIII),and N fertilizer application rates(Table SIV,see Supplementary Material for Table SIV)were derived from Huang and Tang (2010). Total synthetic N (TN, kg) was calculated as follows:

where Ninputis the application rate of synthetic N fertilizers for each crop (kg N ha−1) andAis the sowing area per crop type (ha) under cultivation in 2016. Both the crop sowing area and N application rate during the crop season are reported at the provincial and national scales.
Differences among scenarios were tested using oneway analysis of variance,followed by the least significant difference test atP <0.05.Meta-analysis was performed only with field experiment data(at least one growth season);data from laboratory experiments such as incubation or soil column and greenhouse studies were excluded from enhanced-efficiency fertilizers on the field scale.Studies with no replication or no reported number of replications in field were also excluded from the analysis.Using these criteria,218 datasets were included in the analysis after sensitivity analysis(Table SI).Mean N2O emissions,standard deviation,and number of replicates from the treatment and control were used to conduct meta-analysisviaa random effects model using NCCS statistical software(version 12.0).Crop-specific EFs,which were derived from analysis of the database,were used to estimate total N2O emissions from the agricultural cropping systems at the provincial, regional, and national scales,based on the crop sowing area(China Statistical Year Book,2016).
Total N2O emissions(EN2O-N, kg N2O-N ha−1)from croplands were estimated as:

where BNE is the background N2O emission from soil where no N was applied for a specific crop.
Crop yield was estimated using current national averages of N partial factor productivity(PFPN,kg grain kg−1N)in China from NUE,as follows:

whereYis the total grain yield induced by N fertilizers(kg grain ha−1) and the PFPNwas used as a BS grain yield(Table II)(Xiaet al.,2016).Where the PFPNwas notoriginally reported,it was calculated using the methodology described by Ussiri and Lal(2012)and Xiaet al.(2016)to assess yield changes associated with the S3—S12 scenarios compared with the BS:

TABLE II Nitrogen partial factor productivity(PFPN)and emission factor(EF)for different crops under different management scenarios in China

whereYgrainis total grain yield harvest(kg ha−1)andRNis the seasonal or annual N fertilizer application rate(kg N ha−1).The PFPNfactor for each scenario is different and is listed in Table II.
Yield-scaled N2O emissions(g N2O-N kg−1grain)were calculated according to Ventereaet al.(2011):

The potential mitigation of N2O emissions was calculated using the difference in N2O emissions between BS and each of the mitigation scenarios(S1—S12)divided by those for BS,expressed as a percentage:

where PD is the N2O emission percentage decrease(%);X2is the N2O emissions for each of the potential mitigation scenarios;andX1is the N2O emission for the BS.
Note that the yield percentage increase for each crop type was calculated using the difference in PFPNvalues between the BS(where no inhibitor was applied)and the S3—S12 scenarios(where inhibitor was applied)computed from individual studies(Table SV,see Supplementary Material for Table SV).Data were analyzed using SPSS for Windows(version 22.0).
BASELINE SCENARIO
The total amount of annual synthetic N fertilizer used in Chinese maize, rice, and wheat cropping systems was estimated at 17 145 Gg N year−1(Table III), and its use was the greatest in maize(6 796 Gg N year−1),followed by rice(5 505 Gg N year−1)and wheat(4 844 Gg N year−1).Total N inputs were the greatest in Henan and Shandong and the lowest in Xizang(Tibet).Out of the 31 provinces,three(Heilongjiang,Shandong,and Henan)represented 28%of the national cropping area and accounted for 27.5%of total input of synthetic N.
Under the BS, total N2O emissions from maize, rice,and wheat cultivation were estimated at 154.8 Gg N2O-N year−1; emissions from maize were the highest (71.6 Gg N2O-N year−1),followed by wheat(43.8 Gg N2O-N year−1)and rice(39.4 Gg N2O-N year−1)(Table IV,Fig.1).Based on N2O emission strength,the lowest emissions were found in Heilongjiang(0.62 kg N2O-N ha−1)and the highest were in Shanghai and Jiangsu (1.60 and 1.58 kg N2O-N ha−1,respectively).
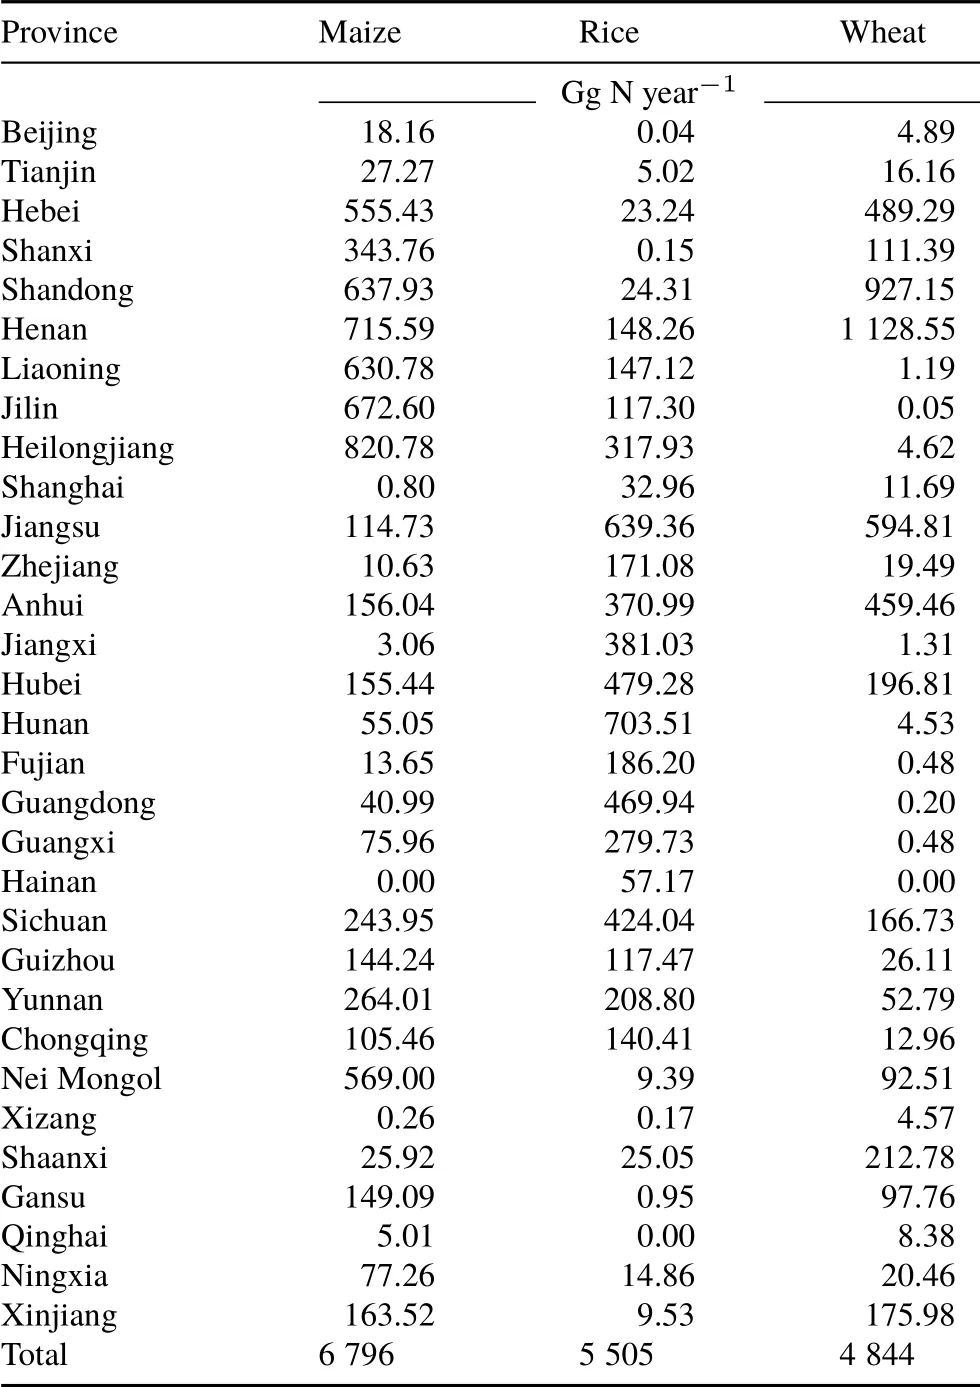
TABLE III Amount of synthetic fertilizer N applied for different crops in different provinces of China
YIELD-SCALED N2O EMISSIONS IN THE MITIGATION SCENARIOS
The greatest mean yield-scaled N2O emissions ranged from 0.25 to 0.52 g N2O-N kg−1grain under scenarios BS to S2(Fig.2).Under BS,yield-scaled N2O emissions from fertilized crops were the highest in wheat (0.48 g N2O-N kg−1grain),followed by maize(0.34 g N2O-N kg−1grain)and rice(0.25 g N2O-N kg−1grain)(Fig.2).
Mean yield-scaled N2O emissions were lower in all the mitigation scenarios than in the BS(Fig.2). Yield-scaled N2O emissions were lower in S4 (0.10, 0.18, and 0.09 g N2O-N kg−1grain for maize,wheat,and rice,respectively)than in the BS and other mitigation scenarios(Fig.2).Yieldscaled N2O emissions were more effectively reduced for all three cropping systems under S6,S4,and S11 compared to the BS or to S1 and S2(Fig.2).Combination scenarios(S11 and S12) reduced the yield-scaled N2O emissions under maize as compared to wheat.Mitigation scenarios S6,S4,and S11 were equally effective in decreasing yield-scaled N2O emissions from maize compared with the BS(Fig.2),whereas mitigation scenarios S4,S6,and S11 were the mosteffective for rice,and S4 and S7 were the most effective for wheat.
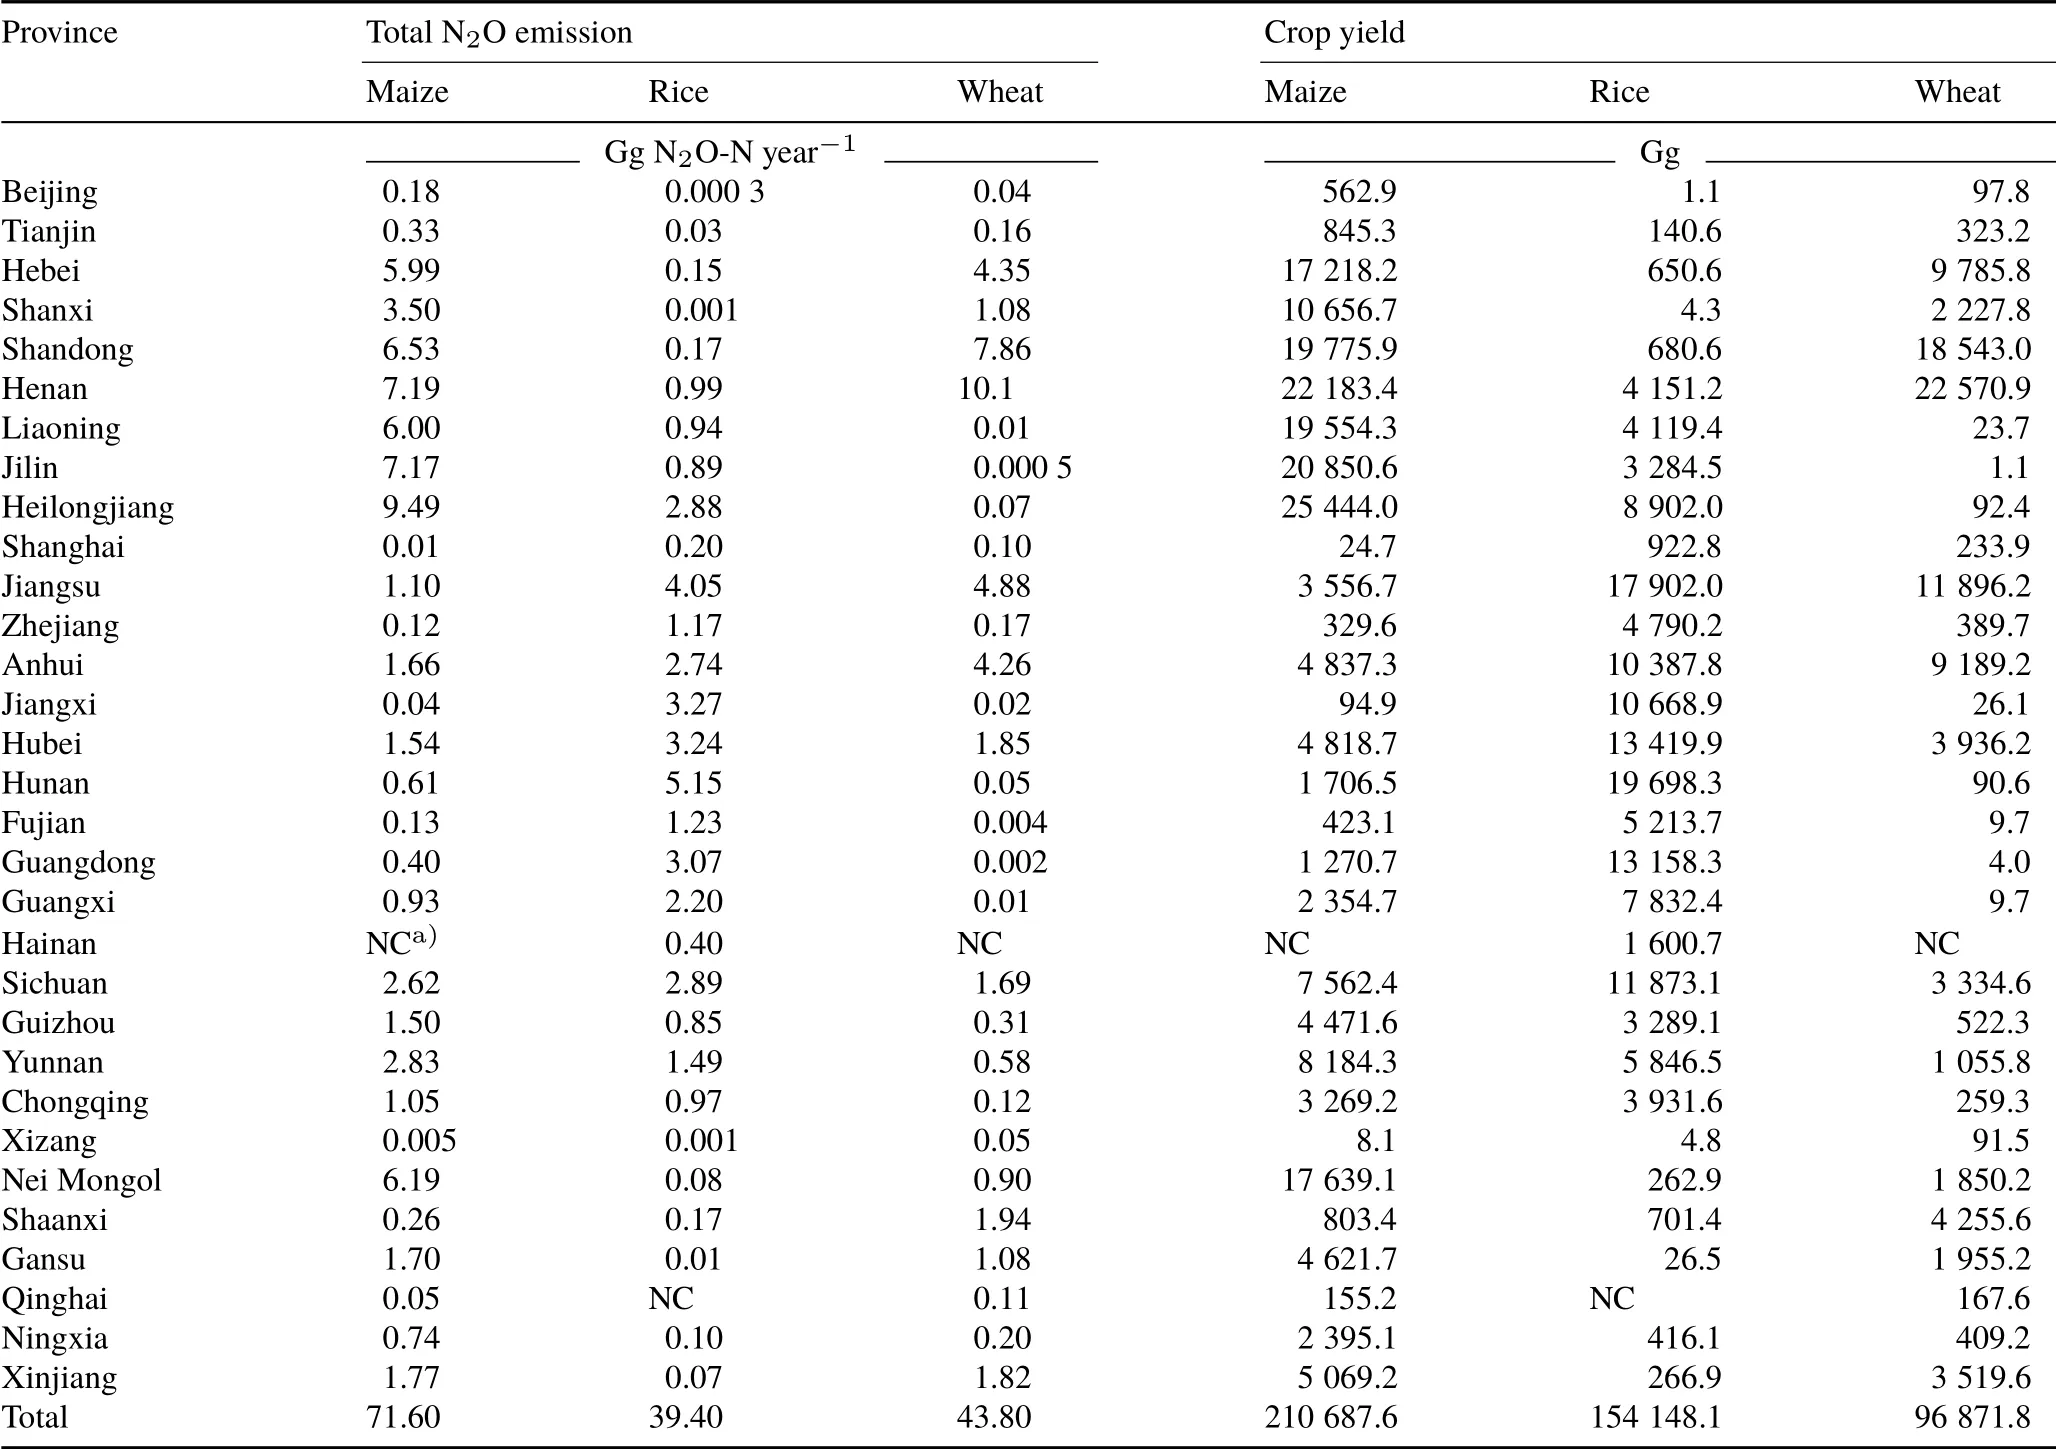
TABLE IV Total N2O emissions and crop yields estimated for different crops in different provinces of China under the baseline scenario
Addition of UIs and NIs(S3—S12)reduced yield-scaled N2O emissions to 0.08—0.26 g N2O-N kg−1grain in the three cropping systems (Fig. 2). The range of estimated values for all mitigation scenarios(S3—S12)was much lower than those of BS and scenarios S1 and S2,where no inhibitor was applied. The estimated yield-scaled N2O emissions were 0.34—0.36,0.25—0.26,and 0.48—0.52 g N2O-N kg−1grain for maize,rice,and wheat,respectively,under BS,S1,and S2,compared with 0.10—0.22,0.08—0.16,and 0.18—0.26 g N2O-N kg−1grain, respectively, under scenarios S3—S12(Fig.2).
EFFECT OF MITIGATION SCENARIOS ON N2O EMISSIONS
In the BS, mean N2O emissions from fertilized crop systems were the highest in maize(1.96 kg N2O-N ha−1),followed by wheat(1.64 kg N2O-N ha−1)and rice(1.41 kg N2O-N ha−1)(Table V).MeanN2O emissions were higher(P <0.05)in the BS than in the mitigation scenarios,and average crop yields were lower(P <0.05)(maize 5 806 kg grain ha−1,rice 5 722 kg grain ha−1,and wheat 3 439 kg grain ha−1)(Table V).
Total N2O emissions were lower (P <0.05) in all mitigation scenarios than in the BS(Table V);national total grain yield for all crops was the lowest (P <0.05) in S2(Table V,Fig.1).National-scale N2O emissions were lower(P <0.05)in S4 than in the BS and the other mitigation scenarios, being 33.6, 19.2, and 18.1 Gg N2O-N year−1for maize,rice,and wheat,respectively,under S4(Fig.1).This represented a reduction of 53.0%,51.3%,and 58.7%compared with the BS for maize,rice,and wheat,respectively(Table V). N2O emissions were more effectively reduced for all three cropping systems in S6 than in S4(Table V),whereas maize grain yield was greater in S4 than in S6.The total N2O emission reduction potential of each mitigation scenario to BS is presented in Fig. 3. A combination of scenarios,S11 for maize and S12 for wheat,reduced the total N2O emissions by 56.6%and 57.3%,respectively.Mitigation scenarios S11, S6, S12, and S4 were equally effective in decreasing N2O emissions from maize compared with the BS (Table V), whereas mitigation scenarios S6, S11, and S4 were equally effective for rice, and S12, S11, S7, S4,and S10 were equally effective for wheat.Overall,maximum mitigation potential was estimated for S11,although its yield was lower than those in S4 and S6,but nevertheless greater than that in the BS.
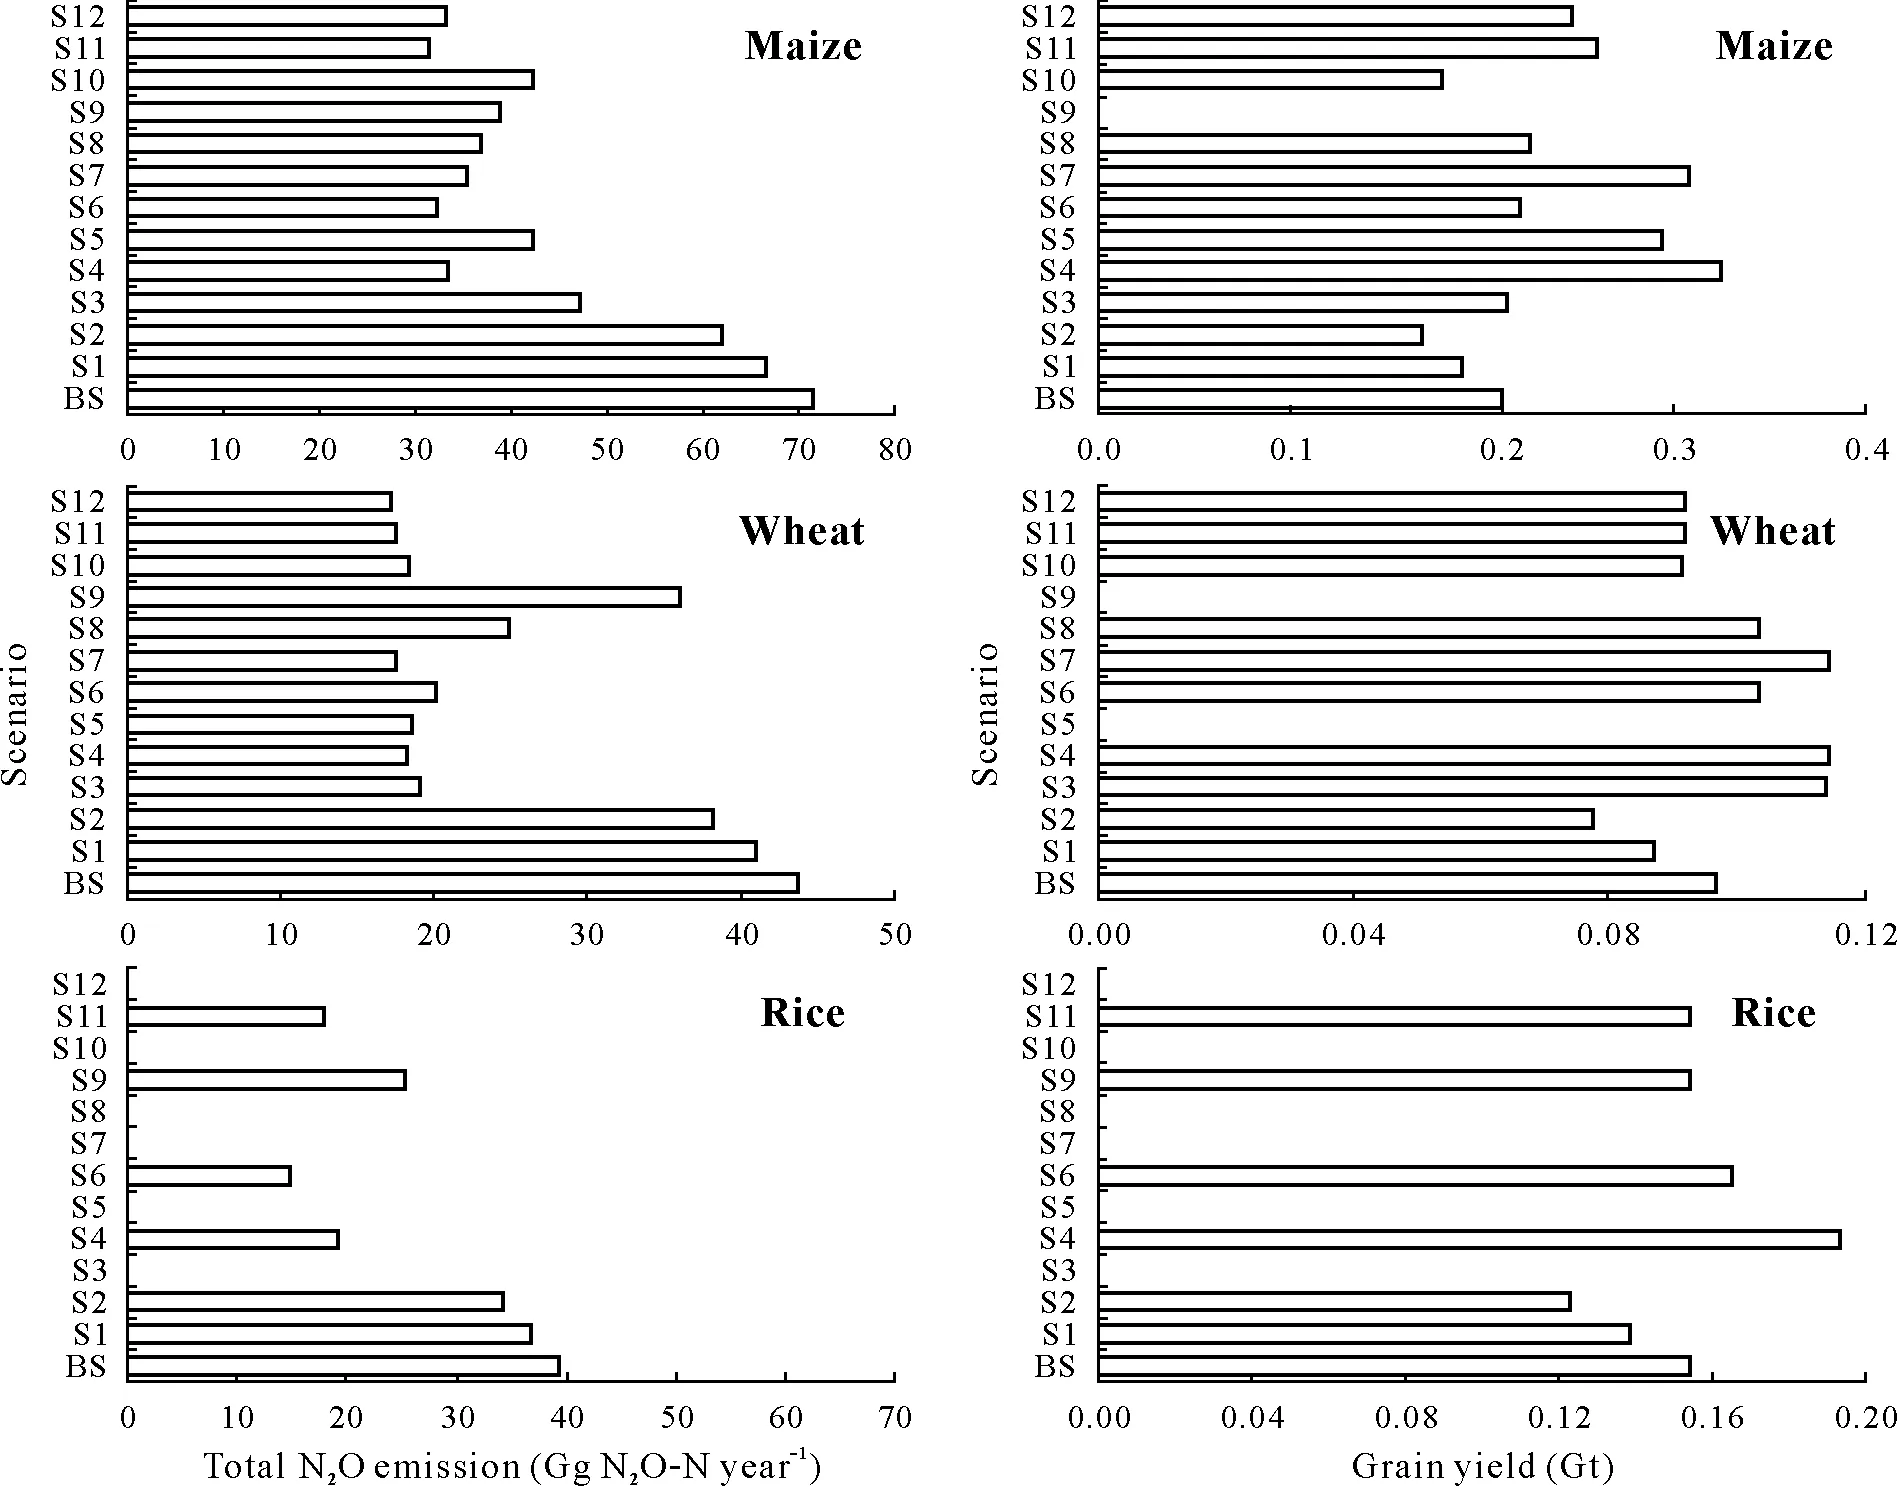
Fig.1 Estimated total N2O emissions and grain yields for different crops in China under the baseline scenario(BS)and 12 potential mitigation scenarios(S1—S12).See Table I for the detailed description of BS and S1—S12.
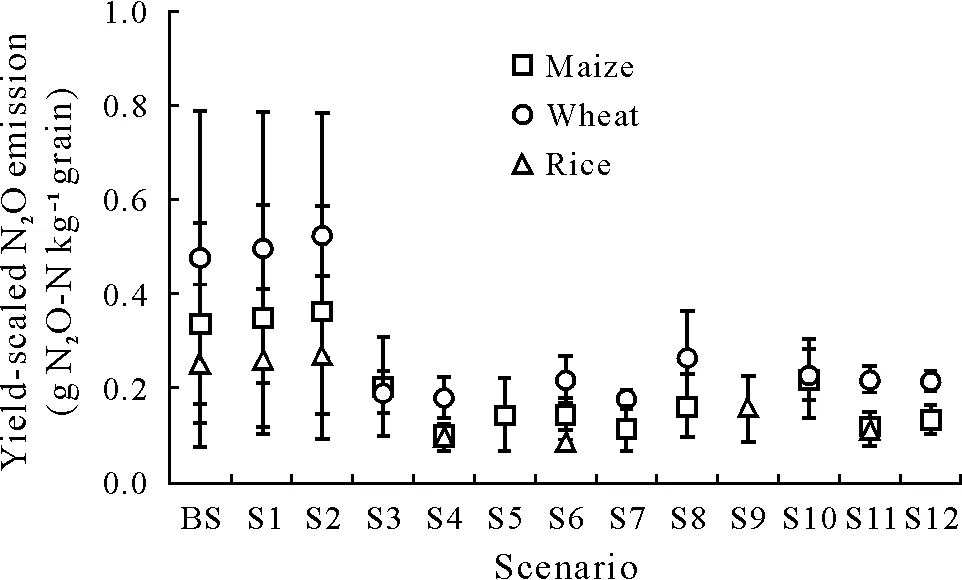
Fig.2 Effects of baseline scenario(BS)and 12 potential mitigation scenarios(S1—S12)on yield-scaled N2O emissions for different crops in China.Vertical bars indicate standard errors of the means(n=30).See Table I for the detailed description of BS and S1—S12.
DISCUSSION
We estimated current annual total N2O emissions (N fertilizer-induced plus soil background emissions) from maize, rice, and wheat croplands in China to be 154.8 Gg N2O-N,which was higher than those under our proposed mitigation scenarios(S1—S12). The lowest N2O emission strength was in Heilongjiang(0.62 kg N2O-N ha−1),probably as a result of low annual temperature (1.7◦C) and precipitation (555 mm year−1) coupled with low N input rates that averaged 102 kg N ha−1(Table SII)(Sunet al.,2016). Higher N2O emission strength were estimated for Shanghai and Jiangsu owing to excessive fertilizer use that averaged 276 and 269 kg N ha−1,respectively,and favorable soil moisture content of>60%water-filled pore space(WFPS)(Table SIV)(Heet al.,2007).
As expected,the yield-scaled N2O emissions were higher in wheat than in rice.This result is best explained by the generally lower EF in paddy fields than in maize and wheat fields(Fig.S1)(Gaoet al.,2011;Zhouet al.,2014;Chenetal.,2015;Shepherdet al.,2015).In paddy fields,flooding interspersed with midterm drainage and dry-wet alteration(flooding-midseason drainage-reflooding-final drainage)are common practices that can create a favorable environment for short-term N2O production and pulse emission(Bouwmanet al.,2002;Zouet al.,2005).Nitrification is generally favored under well-aerated conditions and is a typical pathway for N2O production under maize and wheat upland fields(Barnardet al.,2005).
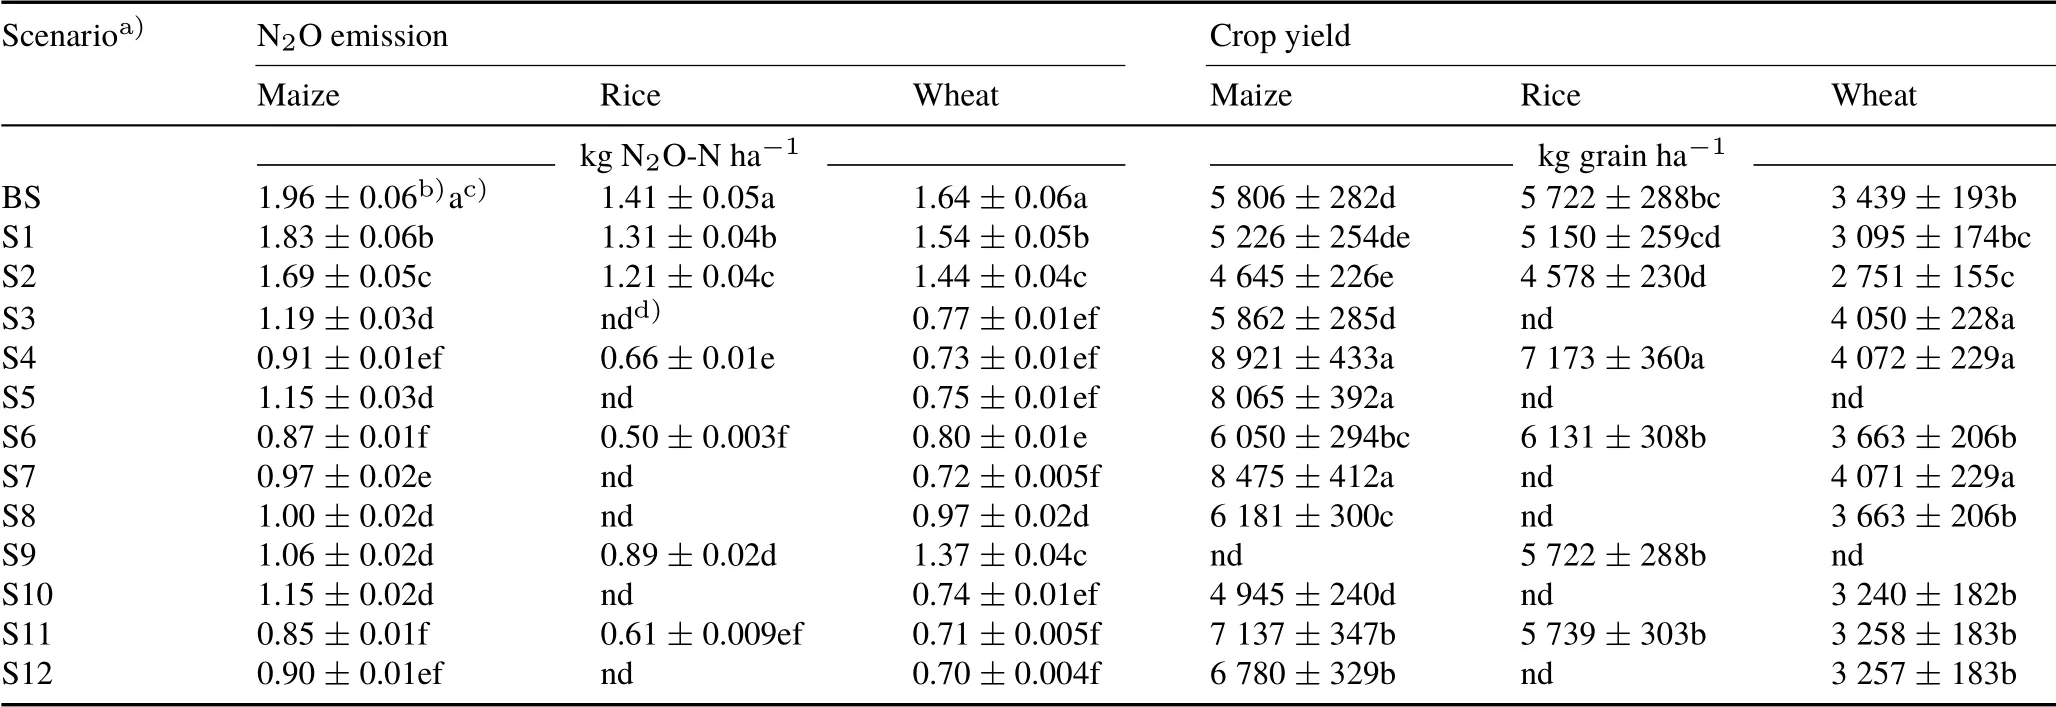
TABLE V Mean N2O emissions and crop yields for different crops under the baseline scenario(BS)and 12 potential mitigation scenarios(S1—S12)
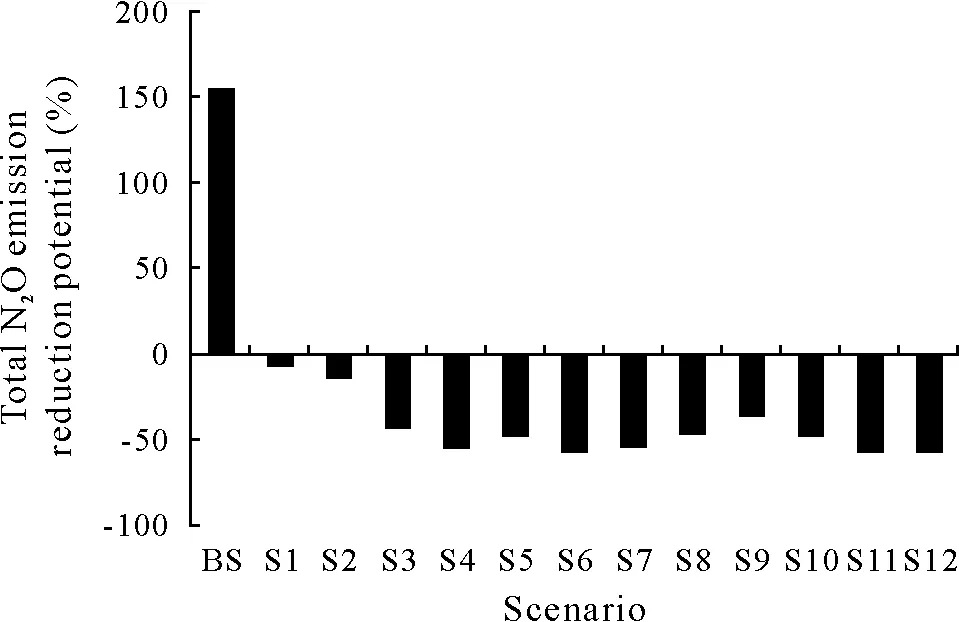
Fig.3 Total N2O emission reduction potentials of the baseline scenario(BS)and 12 potential mitigation scenarios(S1—S12).See Table I for the detailed description of BS and S1—S12.
Scenarios S1 and S2,which represented 10%and 20%reductions in N fertilizer input,respectively,resulted in lower yield-scaled N2O emissions as compared to the BS,probably owing to lower levels of N fertilization and increased NUE(Sanz-Cobenaet al.,2014).However,crop yields were significantly lower in S2 than in the BS,indicating that without the addition of UIs or NIs,the 20%reduction in the conventional fertilizer N application rate resulted in insufficient N for crop development.Scenario S2 might compete with food security to accommodate the predicted doubling of food demand by an increasing population(Muelleret al.,2012;Van Grinsvenet al.,2013).
We estimated a>35.0%reduction in yield-scaled N2O emissions under mitigation scenarios S3—S12 as compared with the BS,which was similar to previously reported reduction potentials of 40.1%—42.6%(Sanz-Cobenaet al.,2012;Halvorson and Del Grosso,2013;Monaghanet al.,2013;Zamanet al.,2013).Scenario S4(DCD)reduced average N2O emissions by 54.0%,which was close to the 60%—76%N2O emission reductions reported by Di and Cameron(2003).Ruser and Schulz(2015)observed that the N2O reduction potential of DCD and DMPP was 30%—50%, which was attributed to the strong inhibition effects of DCD and DMPP on the ammonia-oxidizing bacteria(AOB)and ammoniaoxidizing archaea (AOA) responsible for the oxidation of NH+4to NO−3in soils(Table VI)(Di and Cameron,2011;Akiyamaet al., 2013; Shenet al., 2013). The addition of DMPP to soils might increase abundance of the bacteria Firmicutes and Bacteroides,which lower N2O emissions(Donget al.,2013;Joneset al.,2014);however,Juet al.(2011)did not observe inhibition effects of DMPP on N2O emissions during maize cultivation in the North China Plain.Niuet al.(2018)suggested the possibility that low soil moisture(<45%WFPS)masks the N2O emission reduction potential of inhibitors by reducing substrate NO−3for denitrification.
The reduction potentials of N2O emissions under scenarios S4 (DCD) and S6 (DMPP) were similar in maize and wheat,but differed in rice,where DMPP in S6 elicited greater inhibition of N2O emissions.Previous studies have similarly shown that DMPP reduces N2O emissions moreefficiently than DCD(Weiskeet al.,2001;Fangueiroet al.,2009; Pereiraet al., 2010) in maize and wheat. Zhaoet al.(2017)recorded N2O emission reductions of up to 55%and 47% by DMPP and DCD, respectively, as a result of the lower solubility,longer half-life,and slower leaching of DMPP as compared to DCD(Zerullaet al.,2001;Ruser and Schulz, 2015). Similarly, DMPP has been shown to have a greater inhibition effect on N2O emissions as compared to DCD in upland fields(Gilsanzet al.,2016;Yanget al.,2016).In contrast to our study,a smaller meta-analysis by Akiyamaet al.(2010)(12 field measurements)showed that DCD was more effective than DMPP at reducing N2O emissions;however,it is likely that our analysis of up to 35 field measurements(Fig.4)was more robust and representative.

TABLE VI Potential effectsa) of urease and nitrification inhibitors on abundance of ammonia-oxidizing bacteria(AOB)and ammonia-oxidizing archaea(AOA),derived from published literature
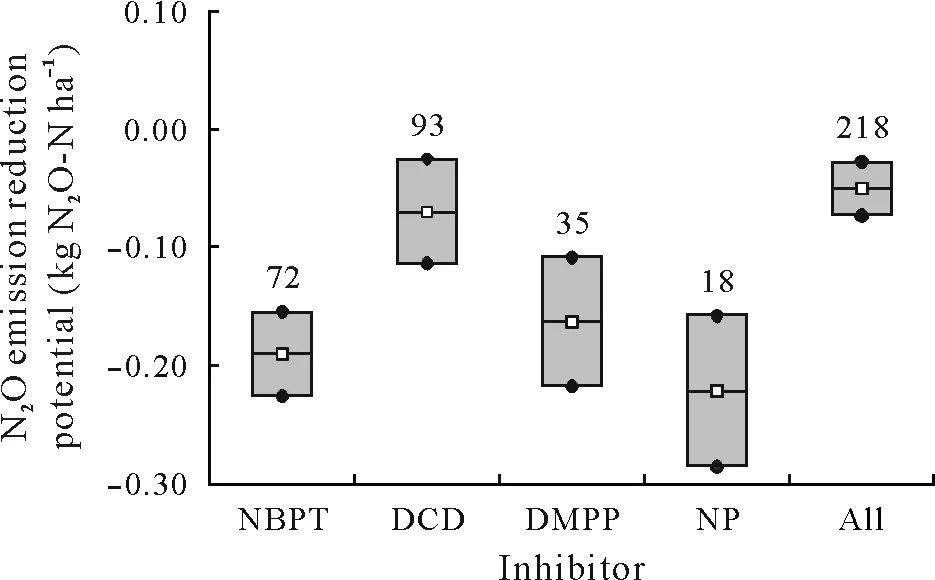
Fig.4 Reduction potentials of urease and nitrification inhibitors on N2O emissions.Dot and box denote the range and mean,respectively;values above boxes are the number of measurements from each study.NBPT:nitrophosphate,N-(n-butyl)thiophosphoric triamide;DCD:dicyandiamide;DMPP:3,4-dimethylpyrazole phosphate;NP:nitrapyrin.
The reduced N2O emissions estimated for S5(nitrapyrin)were also lower than for S6(DMPP)under maize production,which might be a result of a number of factors. First, nitrapyrin shows low or weak inhibition of AOB (Vannelli and Hooper, 1992; Shenet al., 2013). Second, high summer temperatures might have accelerated the decomposition and reduced the efficacy of nitrapyrin (Ruser and Schulz,2015).Third,direct adsorption of nitrapyrin by soil organic matter might have reduced its inhibition effects(Sahrawatet al.,1987;Powell and Prosser,1991;Wolt,2000).Fourth,inhibitory effects of nitrapyrin on N2O emissions disappear when soil moisture<45%WFPS(Niuet al.,2018),but at soil moisture of 40%WFPS,DMPP more efficiently reduces oxidation of NH+4to NO−3than at 60%—80%WFPS(Xueet al.,2012).Fifth,inhibition of N2O emissions by nitrapyrin is more efficient in paddy soils than in cultivated black soils,owing to the correlation with AOB abundance in paddy and alluvial soils and the lack of effect of nitrapyrin on AOA community structure in both soils(Cuiet al.,2013).Sixth,the tendency for nitrapyrin to be more volatile than DCD or DMPP might diminish its effect on nitrification in organic soil(Sahrawatet al.,1987;Gilsanzet al.,2016)owing to hydrolysis and adsorption(Bremneret al.,1987;Reginaet al.,1998).
Unexpectedly,we found that a combination of UIs and NIs(S7:NBPT+DCD,S8:NBPT+DMPP,and S9:HQ+DCD)had a moderate effect on yield-scaled N2O emission reduction compared with the addition of inhibitors alone.Similarly, Abaloset al. (2014) reported that application of NBPT + DCD resulted in less-effective reductions in N2O emissions compared to DCD alone,likely because the UI NBPT only reduces the initial soil NH+4concentration,decomposes more rapidly at soil temperatures above 20◦C(Soareset al.,2012;Singhet al.,2013;Hagenkamp-Korthet al.,2015),and has little effect on N2O emissions in acid soil (Fanet al., 2018). The UIs are known to reduce the effectiveness of NIs on urea hydrolysis(Luoet al., 2010)and increase urea or ammonium longevity in soil,whereas their degradation gradually increases levels of NO−3,which leads to reduced effectiveness of NIs(Menneeret al.,2008;Dinget al.,2015).
We estimated relatively high crop yields under scenarios S4,S11,and S12,where grain yield increase and N2O emission reduction were optimized compared with the BS.There were yield optimization values of 14.0%for maize,8.0%for rice,and 1.6%for wheat in scenario S4.These values were lower than the range of 40%—60%previously reported at the global scale (Zhanget al., 2008; Fanet al., 2012).Overall,the results for scenarios S4,S6,and S11 indicate that they optimized mitigation of N2O emissions;an average reduction in N2O emissions of 56.0% might be achieved under national-scale implementation of scenarios S6 or S11,by reducing N losses through NO−3supply for denitrification(Yanget al.,2016).
It should be noted that our evaluation of the effects of potential mitigation scenarios on N2O emissions in croplands is subject to a number of uncertainties.First,uncertainties can arise from using single default PFPNvalue that underestimate or overestimate total N yield(Xiaet al.,2016).Second is the assumption that fertilizer type,fertilization strategy,and soil type were constant in each mitigation scenario(Sanz-Cobenaet al., 2014; Qiaoet al., 2015). Third, lack of data in our analysis from a diversity of climatic conditions might have masked the effects of weather variables (temperature and precipitation)and soil properties that are known to influence the efficacy of NIs(Irigoyenet al.,2003;Di and Cameron,2004;Menéndezet al.,2012;Guardiaet al.,2018).
CONCLUSIONS
Our meta-analysis showed heterogeneous differences in fertilizer-induced N2O EFs, N2O emission mitigation scenarios, and N fertilization in croplands across China.Reduction of N fertilizer application rate by 20%,without other management practices such as use of inhibitors,was shown to reduce crop yields.Effective scenarios(S6:DMPP;S4:DCD;and S11:20%reduction in N fertilizer application rate plus DCD)were estimated to reduce yield-scaled N2O emissions to 0.08—0.22 g N2O-N kg−1grain from 0.25—0.48 g N2O-N kg−1grain under the BS in the maize,rice,and wheat cropping systems.Overall,these advanced fertilizer management strategies provide an opportunity to meet N2O reduction targets and reduce N2O emissions by>35.0%in China compared with continued implementation of the current baseline strategy.
ACKNOWLEDGEMENTS
We are grateful to two anonymous reviewers and editors for their detailed and constructive comments on our manuscript,and also to the authors for their contributions of data used in this review. This work was supported by the National Natural Science Foundation of China (No.31561143011)and the IAEA-Coordinated Research Projects(D1.5016, RAS5083). The first author Garba ALIYU is grateful as a recipient of the Ph.D.CAS-TWAS Scholarship.
SUPPLEMENTARY MATERIAL
Supplementary material for this article can be found in the online version.
杂志排行
Pedosphere的其它文章
- Optimizing the use of open chambers to measure ammonia volatilization in field plots amended with urea
- A simple and easy method to measure ammonia volatilization:Accuracy under field conditions
- Nitrification inhibitor nitrapyrin does not affect yield-scaled nitrous oxide emissions in a tropical grassland
- Decreased nitrous oxide emissions associated with functional microbial genes under bio-organic fertilizer application in vegetable fields
- Nutrient cycling and greenhouse gas emissions from soil amended with biochar-manure mixtures
- Nitrapyrin effectiveness in reducing nitrous oxide emissions decreases at low doses of urea in an Andosol
