Western North Pacific Tropical Cyclone Database Created by the China Meteorological Administration
2021-04-07XiaoqinLUHuiYUMingYINGBingkeZHAOShuaiZHANGLiminLINLinaBAIandRijinWAN
Xiaoqin LU,Hui YU,Ming YING,Bingke ZHAO*,Shuai ZHANG,Limin LIN,Lina BAI,and Rijin WAN
1Shanghai Typhoon Institute, China Meteorological Administration, Shanghai 200030, China
2Key Laboratory of Numerical Modeling for Tropical Cyclone/China Meteorological Administration, Shanghai 200030, China
ABSTRACT This paper describes the access to,and the content,characteristics,and potential applications of the tropical cyclone(TC) database that is maintained and actively developed by the China Meteorological Administration,with the aim of facilitating its use in scientific research and operational services.This database records data relating to all TCs that have passed through the western North Pacific (WNP) and South China Sea (SCS) since 1949.TC data collection has expanded over recent decades via continuous TC monitoring using remote sensing and specialized field detection techniques,allowing collation of a multi-source TC database for the WNP and SCS that covers a long period,with wide coverage and many observational elements.This database now comprises a wide variety of information related to TCs,such as historical or real-time locations (i.e.,best track and landfall),intensity,dynamic and thermal structures,wind strengths,precipitation amounts,and frequency.This database will support ongoing research into the processes and patterns associated with TC climatic activity and TC forecasting.
Key words:tropical cyclone,multi-source database,western North Pacific
1.Introduction
Tropical cyclones (TCs) are destructive weather systems that can generate severe natural disasters (Chen and Ding,1979;Yu and Chen,2019).TCs rank first among the 10 most dangerous global forms of natural disaster and are a longstanding focus for meteorologists and government departments across the world (Chen and Ding,1979;Chen et al.,2019).There has been a long period of continuous improvement in observation instruments and the associated study of TC dynamics.This has been supported by the ongoing development of weather and climatological prediction methods based on sophisticated dynamical statistical and numerical methods.These approaches now form national,and even global,TC monitoring and prediction defense systems,which play an important role in reducing the losses associated with TC activity.However,the improvement of TC prediction accuracy depends not only on the understanding of TC dynamics but also on the accuracy of TC location and intensity estimation,which is the basis of operational TC prediction and research.
Consequently,in 1972,the China Meteorological Administration (CMA) established a special group to compile annual TC best-track data for the western North Pacific(WNP) and South China Sea (SCS),together with information regarding the impacts of wind and precipitation on China,landfall locations,extratropical transformations,and other observational data.At the same time,through a large cooperating group (organized by the CMA and Shanghai Meteorological Bureau between 1969 and 1971,and aided by multiple related organizations),TC data from 1949 to 1971 were compiled.Since 1972,the Shanghai Typhoon Institute (STI) of the CMA has been responsible for compiling the annual TC data.These datasets subsequently formed the basis for the development of a multi-source CMA TC database for the WNP including the SCS (hereafter WNP).This database not only promotes the development of TC research and prediction in China,but also plays an important role in the international exchange of TC research.For example,TC best-track data compiled by the CMA have been included in the World Meteorological Organization (WMO) official global TC database (International Best Track Archive for Climate Stewardship,or IBTrACS) since 2009 and were also included in the International Data Exchange and Comparison Program organized by UNESCAP (the United Nations Economic and Social Commission for Asia and the Pacific)and the WMO Typhoon Committee (Knapp et al.,2010,2018;Ying et al.,2014).
In addition,with the continuous improvement of meteorological observation networks and the rapid development of detection technology,the availability of TC detection data is also increasing at a very high rate.Satellite and radar have allowed the operation of continuous remote sensing monitoring and fine 3D-structure observations of TCs across a wide area.Since 2000,many TC field experiments and TC observations have been carried out,and have increased the scope of observational data available from TCs and enriched the TC database (Zhao et al.,2009;Fang et al.,2013a,2013b,2015;Zhang et al.,2018,2019).These observational data and spatial information are becoming increasingly abundant,with TC-related observational data,test data,and forecasts continuing to be accumulated.
This abundance of data sources allows us to analyze patterns of TC climatic activity to reveal spatial and temporal distribution characteristics and to forecast TC tracks,intensities,and impacts.Below,we introduce the CMA’s multisource TC database for the WNP and summarize its applications and prospects.
2.A multi-source TC database for the WNP
2.1.Overview
TC best-track,wind and precipitation,landfall,impact,and other relevant data from across the WNP are compiled every year by the CMA.To date,eight datasets have been compiled:the TC best-track dataset (1949—present);TC wind and precipitation dataset (1949—present);TC forecast dataset (1999—present);TC forecast evaluation dataset(1999—present);TC field experiments observational dataset(2007—present,only containing some TC cases,discontinuous);TC remote sensing dataset (discontinuous);global atmospheric conventional observations dataset (discontinuous);and global atmospheric reanalysis dataset (1949—present).These datasets cover the weather and climate,real-time observations,numerical model predictions,and prediction evaluations,and constitute a unique multi-source TC database for the WNP.
2.2.Data processing methods
The remote sensing dataset,global conventional atmospheric observational dataset,TC forecast dataset,and global atmospheric reanalysis dataset are collected and collated by the operational data transmission network of the CMA or are shared internet resources.The remaining four datasets are collected in real time (TC field experiment observational dataset) or compiled after analysis and synthesis(TC best track,TC wind and precipitation,and TC forecast evaluation dataset) by the STI in collaboration with the Typhoon and Marine Meteorological Expert Working Group of the CMA.All of these datasets are unique and authoritative.In the following,the TC best track,TC wind and precipitation,and TC field experiment observational dataset are introduced in detail.The TC forecast evaluation dataset is covered in another paper.
2.2.1.TC best track
The TC best-track dataset incorporates six-hourly estimates of a TC’s location (TC center longitude and latitude),intensity (maximum sustained wind and minimum sea level pressure),and track trend,as well as the time of the extratropical transition,and the position and intensity of landfall in China.In addition,since 2017,the temporal resolution within 24 hours of making landfall in China has been increased to three hours.The best-track analysis flow chart is shown in Fig.1.
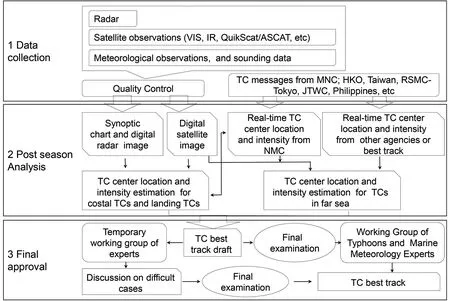
Fig.1.CMA best-track analysis flow chart.
When a TC is far out at sea,estimation of its intensity depends mainly on satellite observations and is done so using the method of Dvorak (1984) and an objective estimation approach based on convective core extraction (Lu et al.,2013a,2013b,2014).Determining its position depends mainly on weather maps and satellite cloud pattern recognition (Dvorak,1975,1984;Lu et al.,2005;Velden et al.,2012).When a TC is offshore or making landfall,high-density ground observations and ground-based radar can be used to locate and estimate its intensity.The TC surface vortex center can be clearly distinguished,and its maximum wind speed can be measured.Finally,all observations and analysis from the various methods are integrated subjectively to obtain the final best-track position and intensity.
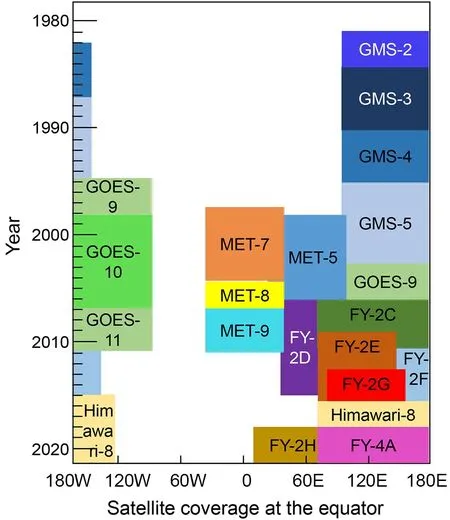
Fig.2.Time series of geostationary satellites and their coverage at the equator (limited to a view zenith angle of about 60° for illustrative purposes).
During the evolution of the CMA TC best-track analysis,there have been many changes in the data used.Geostationary satellite and radar data have been used for TC center location and intensity estimation analysis since the 1980s (Ying et al.,2014).The satellites used are shown in Fig.2,and the Fengyun geostationary satellite series (i.e.,the Chinese FY series,of which FY-2 and FY-4 are the main focus here) have been the major source of TC data since 2005.These satellites give complete coverage of the WNP.The Geostationary Meteorological Satellite series from Japan and the Geostationary Operational Environmental Satellite series from the United States were the main satellites used before 2005.The Meteorological Satellite series from Europe were used for supplementary information for the period between 2000 and 2010.The HIMAWARI-8 (from Japan) geostationary satellite has also been used frequently since 2015,in combination with the FY series,on account of its high spatial and spectral resolutions.Also,the coastal radar density has been increased from zero radars over the whole mainland to one singlepoint radar station approximately every 150 to 200 km across central and eastern China [following the special planning applied to meteorological radar development (CMA,2017)],which makes it possible to capture every TC that makes landfall or approaches the shore in real time.Further,a series of microwave observations have been applied to TC best-track analysis,including the Advanced Microwave Sounding Units (2006—2018),Quik Scatterometer data(2003—2009),Advanced Scatterometer Data (2007—present),and the Special Sensor Microwave Imager and the Special Sensor Microwave Imager Sounder (2009—present).In summary,with the application of more detailed satellite and radar observations,the accuracy of TC best-track data will certainly be improved.
2.2.2.Wind and precipitation generated by TCs
The CMA TC wind and precipitation dataset is the only dataset in the world that preserves a long time series of ground observations,identified and integrated artificially by professionals.This work is accomplished using a combination of satellite observations,weather maps,and ground observations.Two rules are applied to distinguish between TCaffected areas and areas not affected by TCs.Firstly,the wind—rain area occurring within the TC spiral cloud belt is clearly identified as the TC-affected region.Secondly,the wind—rain area caused by TCs and other systems (e.g.,cold fronts,southwest eddies) identified from the synoptic charts is also defined as the TC-affected area.Finally,the wind and rain observations observed in the TC-affected area are collected and compiled as the complete TC wind and precipitation dataset.The dataset contains total precipitation (mm),daily precipitation (mm),maximum hourly rainfall (mm),maximum sustained wind speed (m s),maximum gust(m s),and beginning and ending times affected by gales(Ying et al.,2014).It should be noted that the spatial scope of this dataset only covers the Chinese mainland.
Since the founding of China in 1949,the construction of a meteorological observation network has been vigorously pursued.The increase in the number of conventional ground-based observation stations on the Chinese mainland between 1949 and 2011 is shown in Fig.3.The number of surface meteorological stations increased from only 108 (in 1949) to 2405 (in 2011),and the amount of data recorded has increased and the quality of observations has also been improved.In view of the development of this observation network,the question of how to best use the observational data scientifically and effectively,whilst avoiding the possible impact on the climatic statistics of the spatial sampling change caused by the increase in station density,is a prime concern.This is one of the fundamental elements that scientists must consider when carrying out research.Until 2019,there were 2429 ground-based observation stations contributing to the wind and precipitation dataset (CMA,2019),including national basic weather stations,national reference climatological stations,and national general weather stations,covering all provinces,autonomous regions,and municipalities except Xizang,Xinjiang,and Qinghai.Therefore,a fixed observation station network,composed of stations included in the Global Transmission System,was selected for this shared dataset.This shared dataset has temporal consistency and spatial homogeneity (Fig.4).
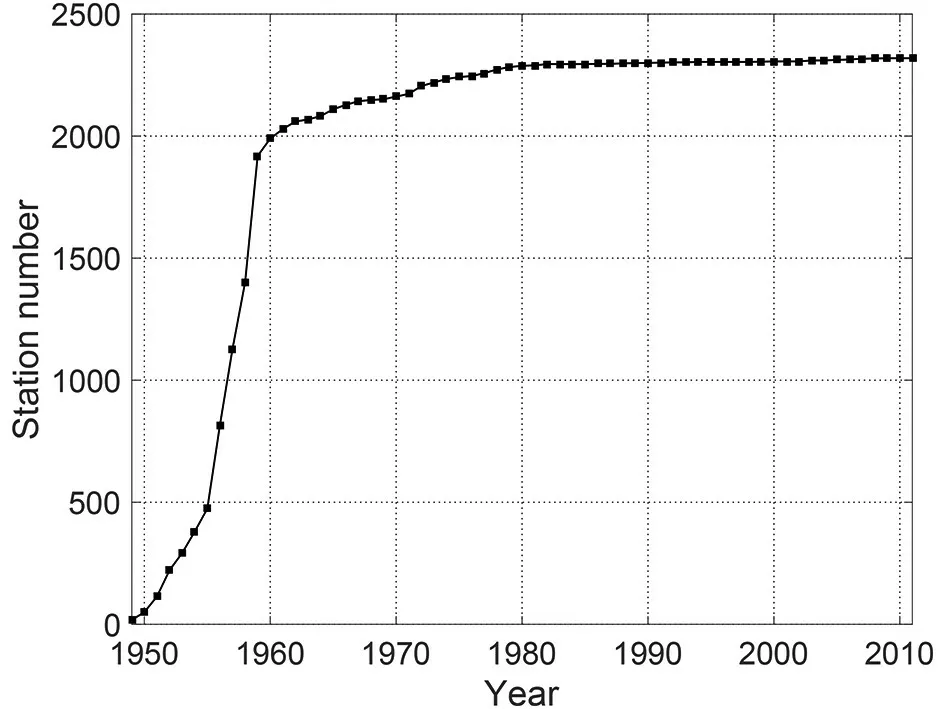
Fig.3.Evolution of the quantity of conventional ground-based observations in mainland China between 1949 and 2011.
2.2.3.TC field experiment observational dataset
Since 2007,the STI has conducted experimental field observations on TCs making landfall in,or affecting,China using mobile observation vehicles,gradient wind towers,and fixed observation bases.By the end of December 2019,30 TCs had been captured by cooperation with other organizations under the National Basic Research Program of China as well as other support from other projects.They were detected using instruments such as wind-profiling radar,laser raindrop spectrometers,microwave radiometers,ultrasonic wind thermometers,automatic weather stations,wind towers,and multi-band radar.However,as some data are still being processed,and some data remain confidential at present,only those TCs targeted between 2014 and 2016(Table 1) were listed in this dataset.The fields captured included the year,TC name,observation instruments,and observational positions.The remainder of the data will be shared step by step in the future.
2.3.Sample description of the dataset
2.3.1.Sample description of the TC best track
The TC best-track dataset is composed of 71 files.The format of the file names is“CHyyyyBST.txt”,where CH represents Chinese,yyyy represents the year,and BST represents best track.There is a header line for every TC in each best track file.This header line contains nine items;i.e.,the header line indicator (“66666”indicates best-track data),international ID,number of data lines for the current TC,TC serial number,Chinese ID,flag of the last data line,temporal resolution of the TC track,TC name,and the dataset creation time (UTC,yyyymmddHH).The TC serial number indicates the sequence number (expressed as YYYYNN,where YYYY indicates the year and NN indicates the sequence number),given by the STI,and includes all TCs above tropical depression level.The Chinese ID refers to the sequence number (expressed as YYNN,where YY indicates the last two digits of the year and NN indicates the sequence number) given by the National Meteorological Centre,and includes only TCs above tropical storm level.
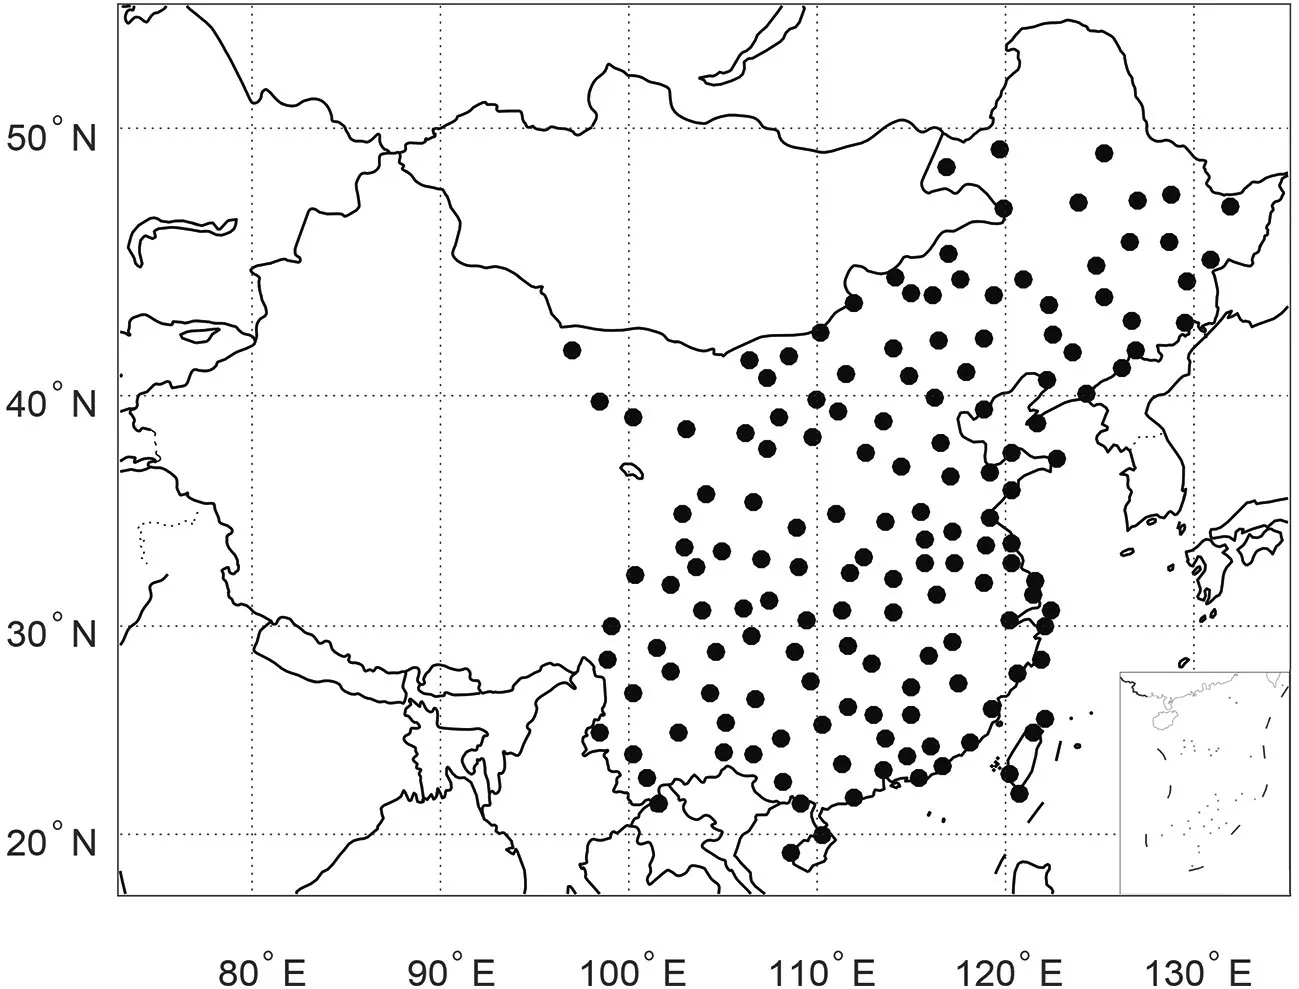
Fig.4.Spatial distribution of stations for the shared dataset.
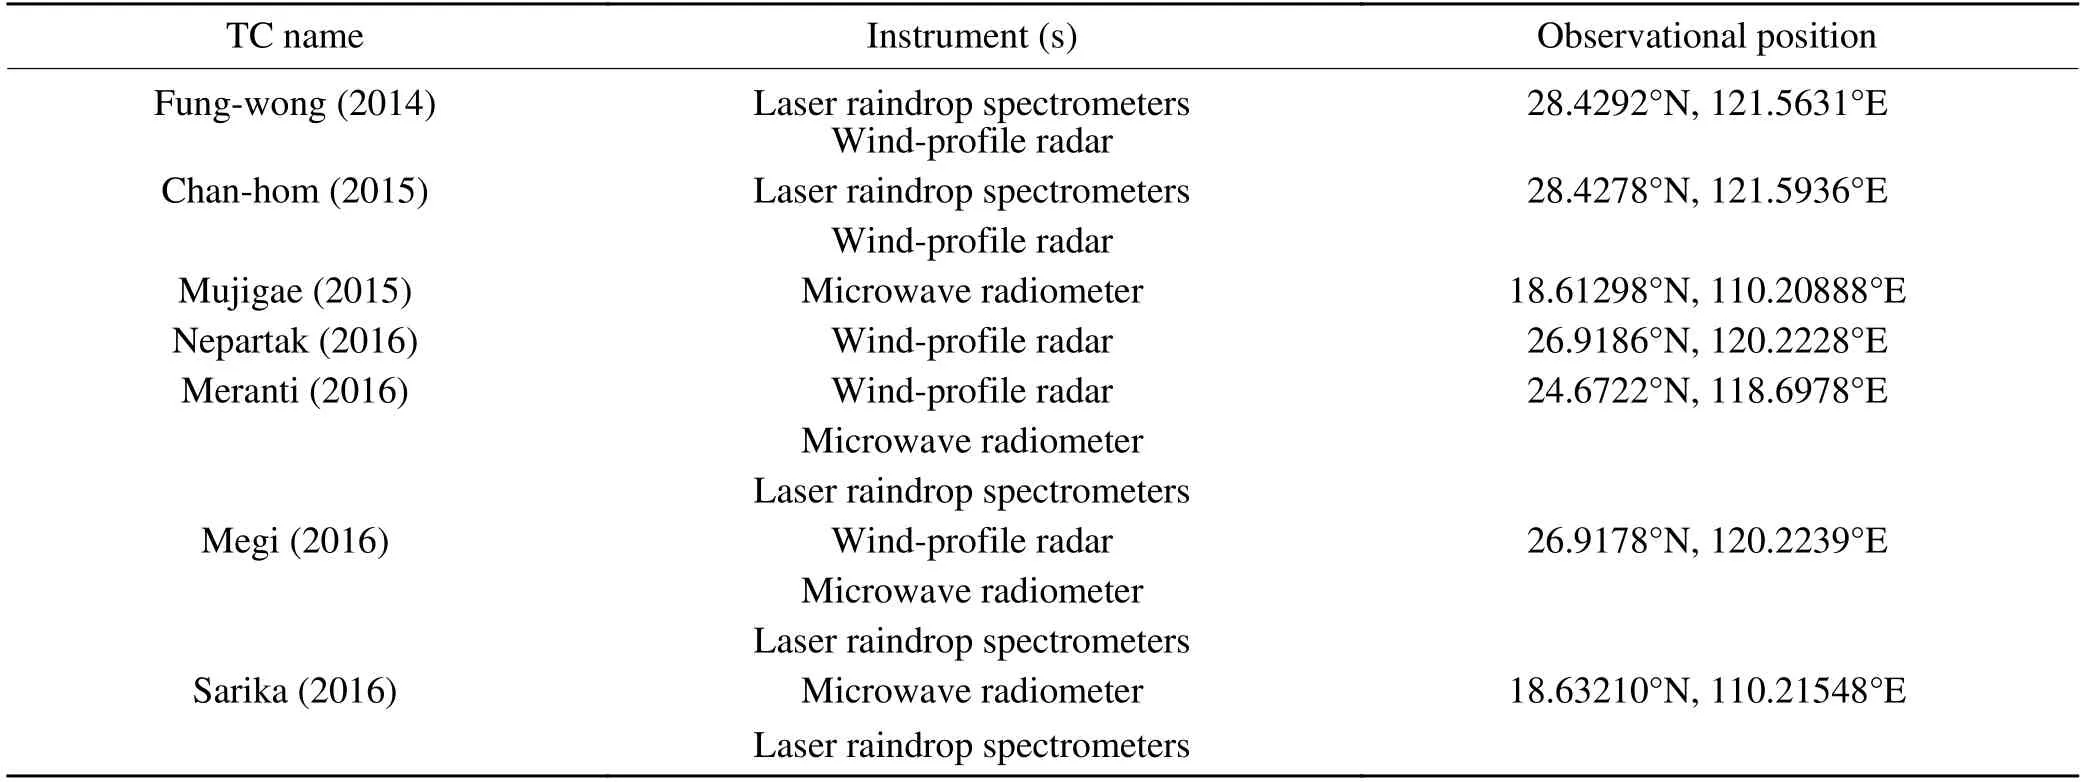
Table 1.TCs targeted by field experiments between 2014 and 2016.
In Table 2,TC Pabuk (2019) is used as an example to show how the data are organized.The first row shows that Pabuk was generated at 0600 UTC 31 December 2018,centered at (8.1°N,112.4°E),with a minimum sea level pressure of 1004 hPa and a maximum sustained wind speed of 13 m s.The TC intensity category is classified into six levels [i.e.,tropical depression (TD),tropical storm (TS),severe tropical storm (STS),typhoon (TY),severe typhoon(STY),and super typhoon (SuperTY)]according to the Chinese National Standard for Grade of Tropical Cyclones(Ying et al.,2014).
2.3.2.Sample description of the TC wind and precipitation
The TC wind and precipitation dataset comprises six files named“1949−2018_W8Date.csv”,“1949−2018_Wind.csv”,“1949−2018_Gust.csv”,“1949−2018_DailyPrecipitation.csv”,“1949−2018_TotalPrecipitation.csv”,and“1951−2018_MaxHourlyPrecipitation.csv”.All row information corresponds to the attributes listed in the description of the first row.Tables 3 and 4 contain part of the TC daily precipitation and maximum hourly precipitation data for TC Son-Tinh (2018),to show the organization of the TC daily and maximum hourly precipitation datasets.
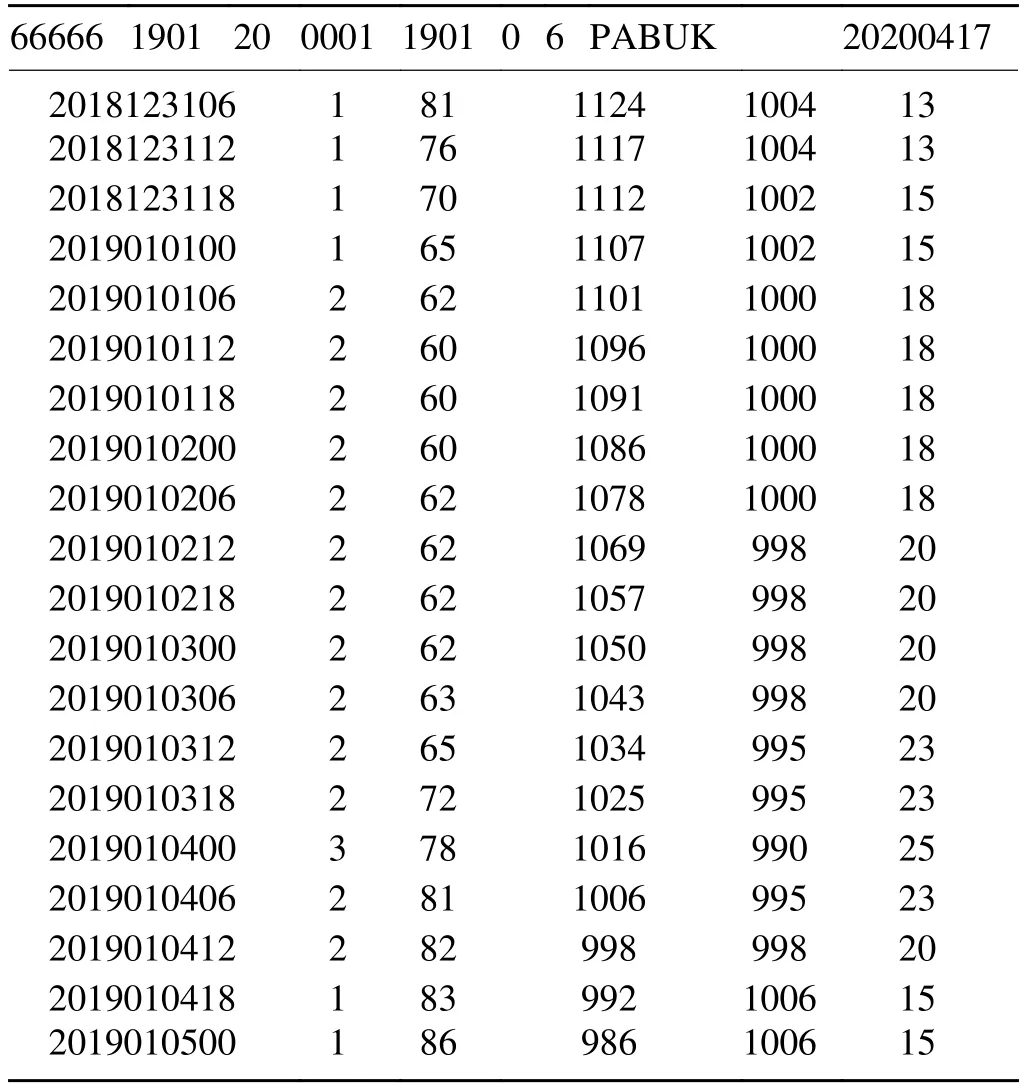
Table 2.Best track data for TC Pabuk (2019).TC Pabuk (2019)is used as an example to show how the data are organized.
2.3.3.Sample description of the TC field experiment observations
The TC field experiment observations dataset comprises three types of data,which are described as follows:
(1) The first data type is the wind profile radar observations.There are three levels of data stored in a folder named by date.Half-hourly observations are stored in the subfolder“HOBS”,hourly observations are stored in the subfolder“OOBS”,and ten-minute observations are stored in the sub-folder“ROBS”.The format of the file names in each sub-folder is“Z_RADR_I _IIiii_yyyyMMddhhmmss_O_WPRD_RadarType_DataLevel.TXT ”.Here,“Radar-Type”is“LC”,representing the boundary wind profile radar,and“DataLevel”contains the HOBS,OOBS,or ROBS information.Detailed information can be found in the specific description file from http://tcdata.typhoon.org.cn/en/ywgc_zl.html named“General data format of wind profiler radar of China Meteorological Administration.doc”.
Wind profile radar observations from 0100:00 UTC 15 September 2016 for TC Meranti are used as an example ofthe organization of this dataset in Table 5.
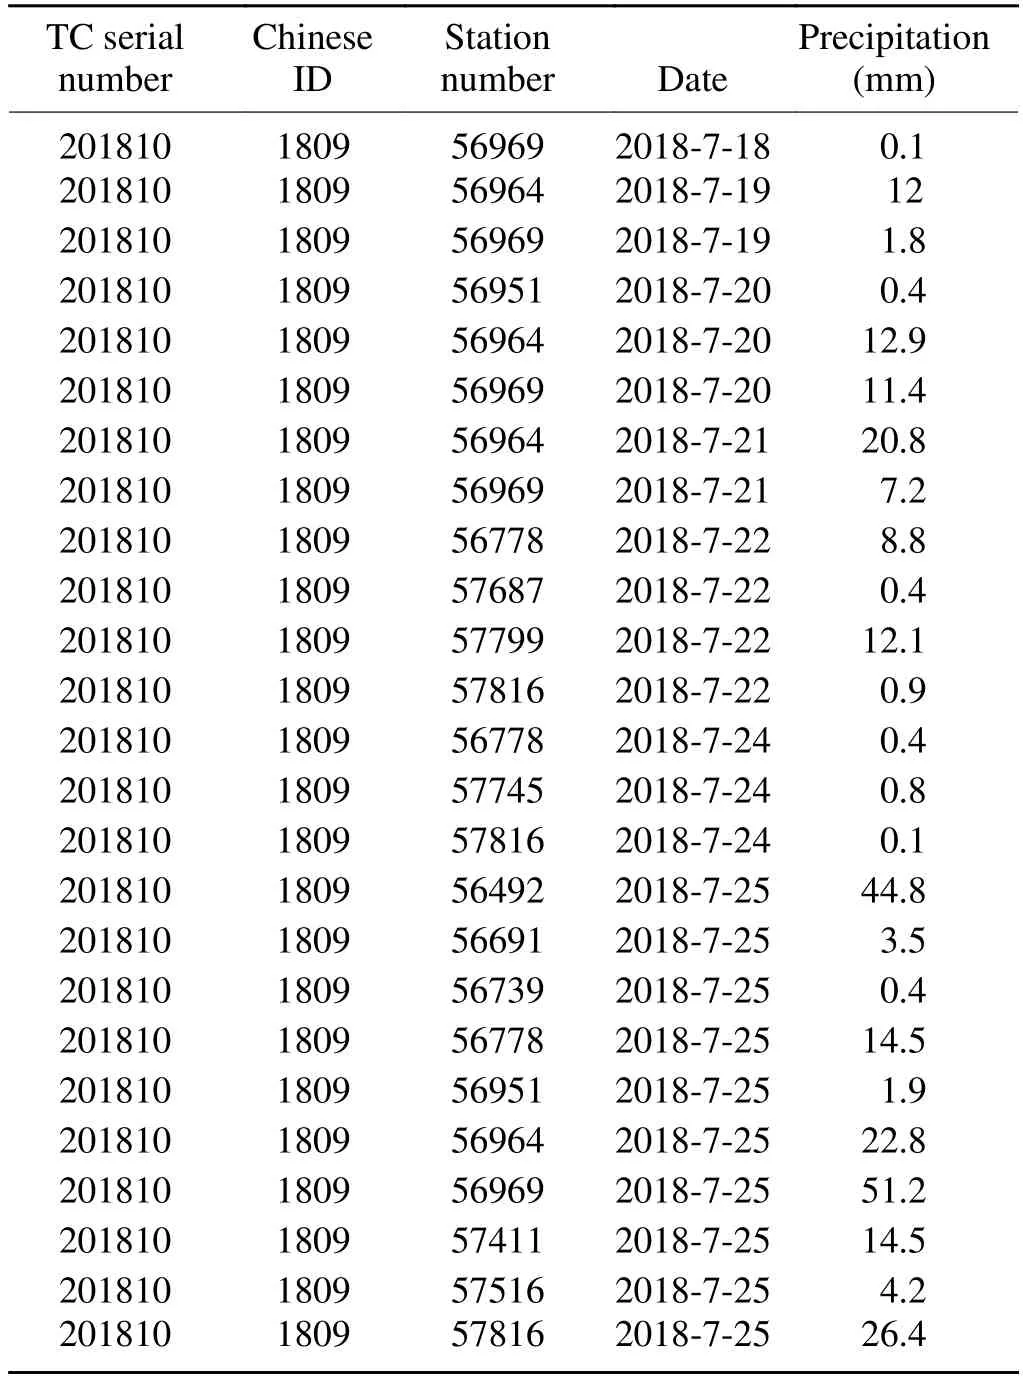
Table 3.Partial daily precipitation data for TC Son-Tinh (2018).
There are three parts to Table 5.The first part,at the top,contains some comments and covers four rows.Row one shows the key word of the wind profile radar and the file version.Row two shows the station number,station position (central longitude and latitude;units:degrees),station altitude (units:m),and radar type.Row three shows the observation time (yyyymmddHHMMSS,LST,Beijing Time,LST=UTC+8).Row four shows the data level.The second part contains the observational data and comprises six columns—namely,the sampling height (units:m),horizontal wind direction (units:degrees),horizontal wind speed (units:m s),vertical wind speed (units:m s),horizontal credibility (%),and vertical credibility (%),from left to right.The symbol“////”indicates missing data.The third part is the end flag,represented by“NNNN”.
A preliminary example of the wind profile radar observations for TC Meranti between 14 and 15 September 2016 is shown in Fig.5.During the observational period,TC Meranti was about 50—100 km south of the wind profile radar.With TC Meranti approaching,the wind direction shifted from northeast and east to south,demonstrating an apparent wind direction change when the TC passed.In addition,when TC Meranti was closest to the wind profile radar,the wind speed increased to the maximum value (at about 0055 15 September) from the lower to upper level.This type ofdata can provide detailed vertical wind structure information,enabling research on the evolution of the dynamic structure of TCs.
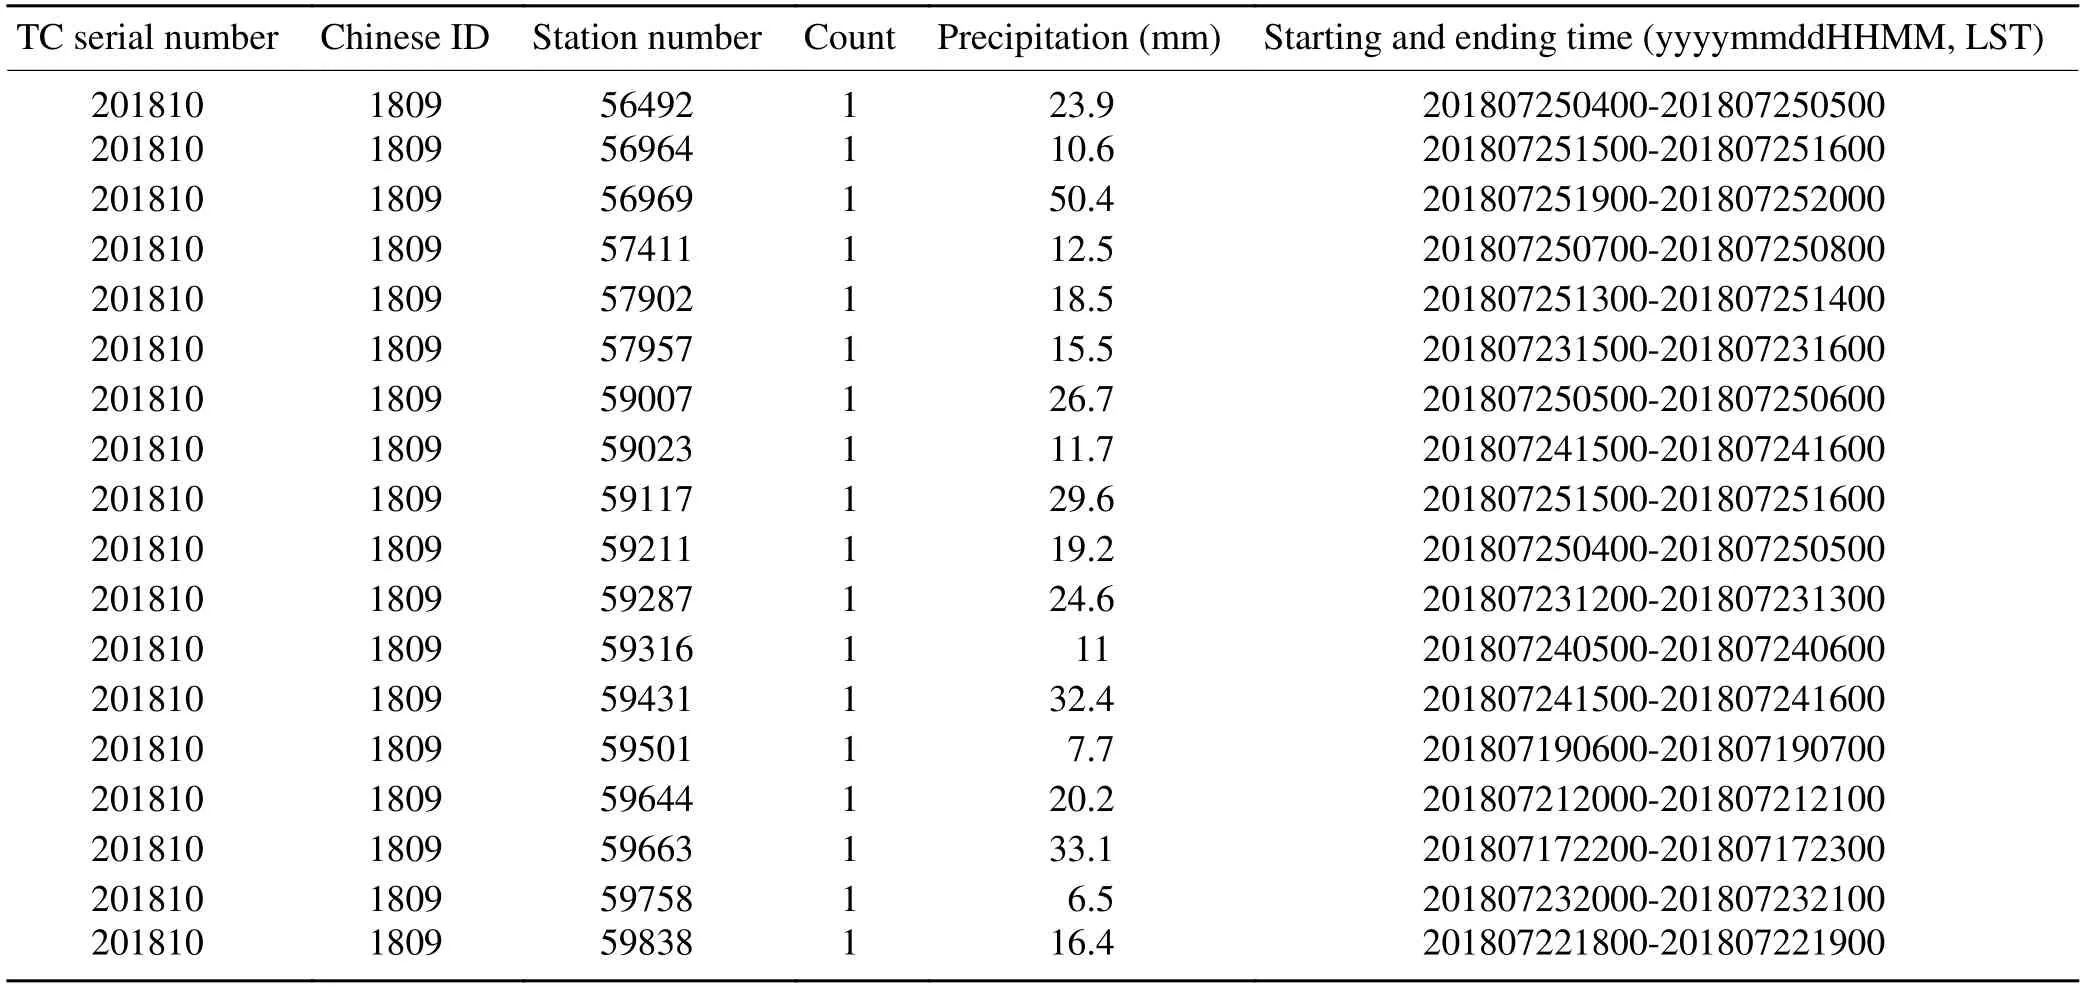
Table 4.Partial maximum hourly precipitation for TC Son-Tinh (2018).
(2) The second data type is microwave radiometer observations.The format of the files name is“yyyy-MM-dd_hhmm-ss_DataLevel.csv”.There are three data levels for the microwave radiometer observations:lv0 (level 0 file),lv1(level 1 file),and lv2 (level 2 file).Level0 files contain raw,unprocessed data in engineering units.Level1 files contain real-time brightness temperatures for each channel specified in the configuration file.Level2 files contain records of real-time retrievals of temperature (K),water vapor(g m),relative humidity (%),and liquid water (g m) profiles.Each file contains the record headers and the real-time observation data profile.The observation data from the microwave radiometer at 1322:27 14 September 2016 are given below as an example:
“6,09/14/16 13:23:37,401,Zenith26,298.126,299.063,298.770,…
7,09/14/16 13:23:38,402,Zenith26,22.665,21.926,21.706,21.538,…
8,09/14/16 13:23:38,403,Zenith26,0.152,0.298,0.471,0.560,…
9,09/14/16 13:23:39,404,Zenith26,96.830,88.808,89.927,…”
Here,field 1 is the record number,field 2 contains the date and time (LST),field 3 contains the record type,record 4 is the sort index,and the remainder are 58 variable values at 58 heights,all separated by commas.More detailed information can be found in the specific description file from http://tcdata.typhoon.org.cn/en/ywgc_zl.html named“MP-3000A Users Manual_OutputFile_Doc.pdf”.
(3) The third data type is the laser raindrop spectrometer observations.The format for these files name is“NNNN_parsivel2.txt”,and there is one file for each TC.Here,NNNN represents the Chinese ID of the TC and“parsivel2”represents the model number of the laser raindrop spectrometer.
The observations are stored line by line using the following format:

where yyyy is the year,mm is the month,dd is the day,hh is the hour,mm is the minutes,and ss is the seconds (LST).The sampling interval is 10 seconds.The precipitation particle spectrum data run between <SPECTRUM>and</SPECTRUM>delimited by a semicolon,and include 32 × 32=1024 channels of data altogether.These data record the number of particles in the first diameter channel of the first velocity channel,the number of particles in the second diameter channel of the first velocity channel,…,the number of particles in the 32nd diameter channel of the first velocity channel,the number of particles in the first diameter channel of the second velocity channel,…,the number of particles in the 32nd diameter channel of the second velocity channel,…,and the number of particles in the 32nd diameter channel of the 32nd velocity channel.Detailed information can be found in the specific description file from http://tcdata.typhoon.org.cn/en/ywgc_zl.html called“Laser raindrop spectrometers observations-read me.txt”.
2.4.Quality of the datasets
For the TC best-track,wind,and precipitation datasets,data quality control was conducted throughout the analysis flow chart (see Fig.1).Firstly,the analyzed dataset draftswere submitted to the Working Group of Typhoons and Marine Meteorology Experts for checking in near-real-time (TC best track) or after the season (TC wind and precipitation).This working group comprises experienced forecasters and researchers from meteorological departments all over the country,and is organized by the CMA.Moreover,a temporary working group of experts is formed at the end of each year to carry out detailed analysis of any difficult cases.Finally,all drafts are provided to the Working Group of Typhoons and Marine Meteorology Experts for final examination at the beginning of the following year.After that,the datasets can be published.
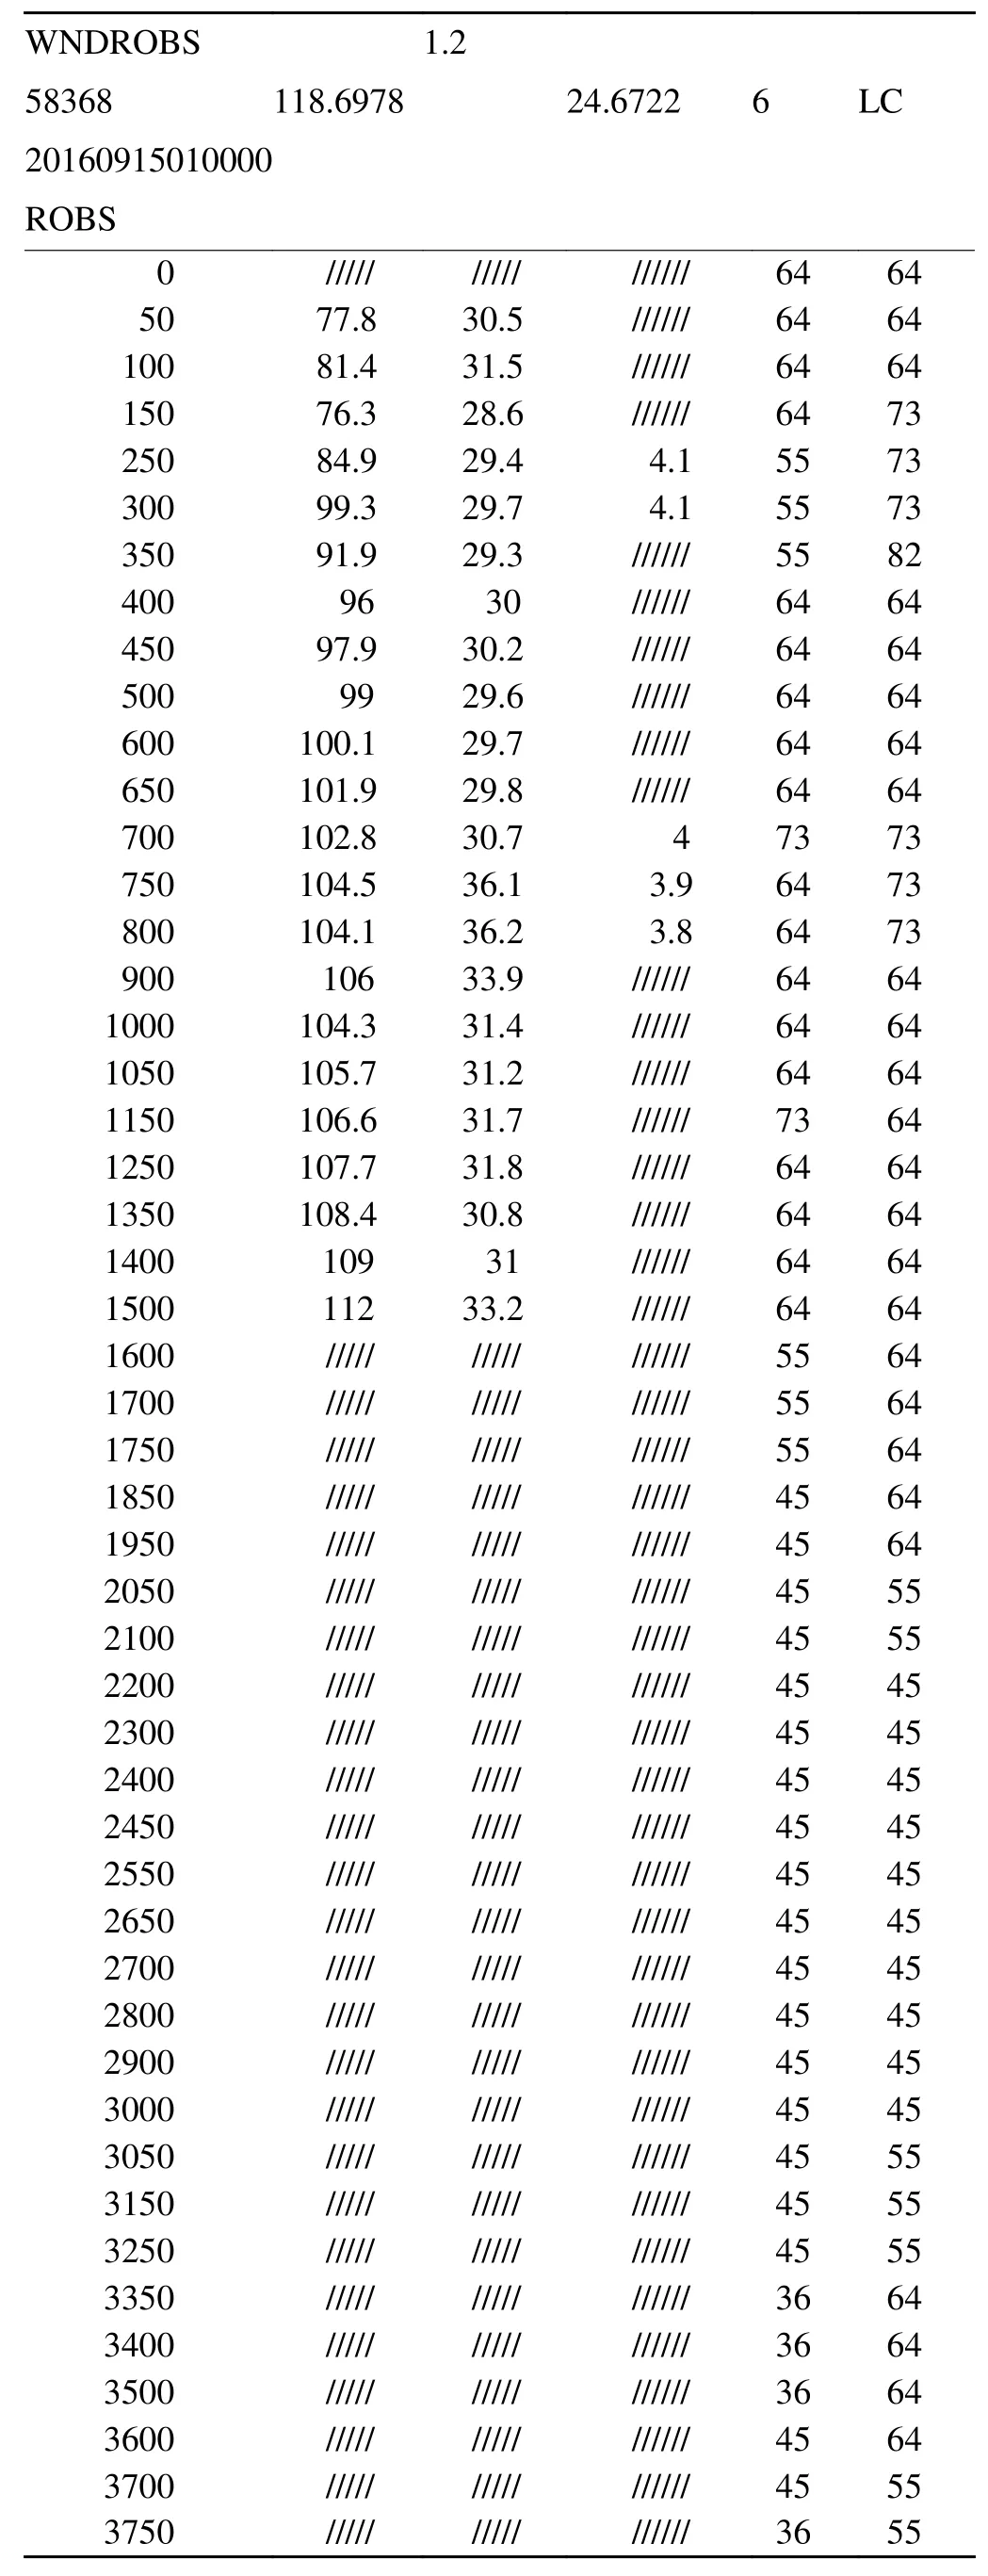
Table 5.Wind profile radar observations at 0100:00 LST 15 September 2016 for TC Meranti.
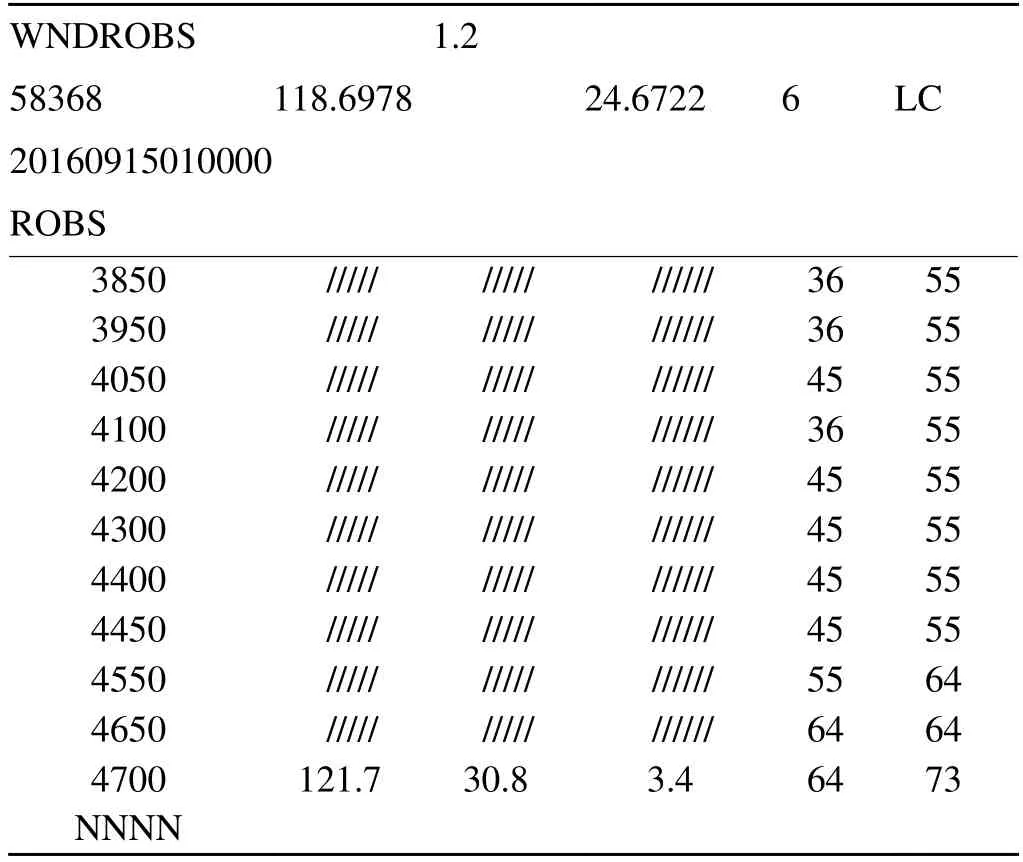
Table 5.(Continued.)
For the TC field experiment observational datasets,we used the raw data after basic quality control had been applied by the instrumental software.TC field data quality control methods vary with the research aims,and many remain under study.
2.5.Storage and access
The multi-source TC data described above are stored at the STI as two-dimensional tables,text files or binary files,and managed using an SQL Server 2012 Standard version.Although some data remain confidential at present,the whole database can be queried and shared in various ways.The data can be accessed through publications (e.g.,the Annual Tropical Cyclone Yearbook [the latest being theYearbook of Tropical Cyclones for 2017 (STI/CMA,2019)]and the Tropical Cyclone Climatic Atlas [the latest being the Climatological Atlas of Tropical Cyclones over the Western North Pacific (1981−2010) (CMA,2017)],
via the operational intranet platforms of the CMA,such as the Shanghai Typhoon Warning Centre,the Typhoon Science Data Sharing Platform,and the Tropical Cyclone Retrieval System over the WNP,as well as on the internet,such as the TC data Centre of the CMA (http://tcdata.typhoon.org.cn/en/index.html).Users can access or obtain the above datasets online or offline.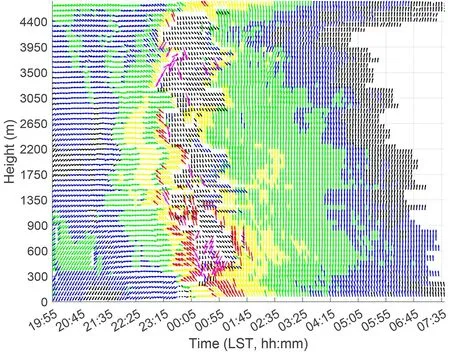
Fig.5.Wind profile radar observations for TC Meranti between 14 and 15 September 2016.
2.6.Applications of the TC multi-source database
The multi-source TC database covers a long period(1949—present),has wide coverage (from mainland China,to offshore in the WNP,and globally),and multiple observation elements (from ground to high altitude,from conventional atmospheric elements such as wind,temperature,and humidity to raindrop spectra,supersonic wind temperature,and other particular observational elements),and includes TC-related historical or real-time location,intensity,dynamic and thermal structures,wind speed,precipitation,frequency,atmospheric environment,and underlying surface conditions.Consequently,it has important practical value for TC operational forecasting and scientific research.Using the above multi-source databases,TC forecasters and scientific researchers have also carried out in-depth data mining projects,such as the yearly“Tropical Cyclone Yearbook in the WNP”,summarizing and compiling the“Tropical Cyclone Climatic Atlas”,and building a“Tropical Cyclone Retrieval System over the Western North Pacific (Tropical Cyclone Retrieval System
)”.In particular,thisTropical Cyclone Retrieval System
is an integrated platform for TC querying and analysis,supported by computer and data analysis technologies.It can superpose and display satellite images,grid data,ground observations,and other information on a unified platform.The most important feature of this system is that users can define the retrieval criteria that they wish to use to query the real-time TC predictions,besttrack data,and historical TC data from the multi-source TC database.TheTropical Cyclone Retrieval System
has been one of the important reference tools for researchers and forecasters.The multi-source TC database thus plays an important role in revealing TC climatic rules in the WNP,determining those influencing factors of most physical significance,and finally establishing operational forecasting schemes.In addition,the database can provide not only basic scientific support for TC researchers,operational personnel,and governments to conduct TC research,forecasts,and disaster prevention and mitigation,but also important scientific information for other relevant professionals,including industry,agriculture,fisheries,transportation,aviation,navigation,and national defense.
3.Summary and prospects
The CMA TC database is the only multi-source,multitimescale,multi-spatial-scale comprehensive TC database that covers the WNP.It integrates the best track,landfall information,and wind and precipitation generated by TCs,as well as data from environmental fields.This database can provide basic scientific support for researchers,forecasters,and government departments performing TC research,forecasts,and disaster reduction planning.Furthermore,it can also support industry,agriculture,fisheries,transportation,aviation,navigation,national defense,and other relevant professionals.
Acknowledgements
.This work has been supported by the Key Projects of the National Key R&D Program (Grant No.2018YFC1506300),and the Key Program for International S&T Cooperation Projects of China (Grant No.2017YFE0107700).The authors thank J.X.FENG,Y.X.ZHAO,Z.Z.YANG,and W.ZHANG for their hard work in compiling historical TC best data.At the same time,we also gratefully acknowledge the organizations and individuals who have made great efforts in TC field observation experiments.Open Access
This article is distributed under the terms of the Creative Commons Attribution 4.0 International License (http://creativecommons.org/licenses/by/4.0/),which permits unrestricted use,distribution,and reproduction in any medium,provided you give appropriate credit to the original author(s) and the source,provide a link to the Creative Commons license,and indicate if changes were made.杂志排行
Advances in Atmospheric Sciences的其它文章
- Electronic Supplementary Material to:Monthly Variations of Atmospheric Circulations Associated with Haze Pollution in the Yangtze River Delta and North China*
- Upper Ocean Temperatures Hit Record High in 2020
- Comprehensive Marine Observing Experiment Based on High-Altitude Large Unmanned Aerial Vehicle (South China Sea Experiment 2020 of the“Petrel Project”)
- IAP’s Solar-Powered Unmanned Surface Vehicle Actively Passes through the Center of typhoon Sinlaku (2020)
- Distinctive MJO Activity during the Boreal Winter of the 2015/16 Super El Niño in Comparison with Other Super El Niño Events
- Monthly Variations of Atmospheric Circulations Associated with Haze Pollution in the Yangtze River Delta and North China
