Electronic Supplementary Material to:Monthly Variations of Atmospheric Circulations Associated with Haze Pollution in the Yangtze River Delta and North China*
2021-04-07XinyuZHANGZhicongYINHuijunWANGandMingkengDUAN
Xinyu ZHANG,Zhicong YIN,2,3,Huijun WANG,2,3,and Mingkeng DUAN
1Key Laboratory of Meteorological Disaster, Ministry of Education/Joint International Research Laboratory of Climate and Environment Change/Collaborative Innovation Center on Forecast and Evaluation of Meteorological Disasters,Nanjing University of Information Science &Technology, Nanjing 210044, China
2Southern Marine Science and Engineering Guangdong Laboratory (Zhuhai), Zhuhai 519080, China
3Nansen-Zhu International Research Centre, Institute of Atmospheric Physics,Chinese Academy of Sciences, Beijing 100029, China

Table S1.Definitions of the East Asian early winter (December and January) monsoon indices.Note:ALI,MW850I,and EADTI have already been multiplied by −1,in order to ensure the consistency of high indices and high strength.

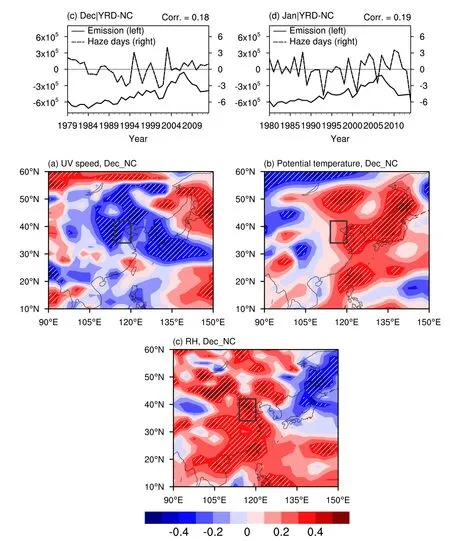
Fig.S1.(a) The emissions inventory (total black carbon,ammonia,organic carbon,sulfur dioxide,PM10,and PM2.5;unit:g;left) and HDs (unit:d;right) difference between January during 1980–2014 and December during 1979–2013 over the YRD.(b) As in (a) but for NC.(c) The December emissions inventory (total black carbon,ammonia,organic carbon,sulfur dioxide,PM10,and PM2.5;unit:g;left) and HDs (unit:d;right) difference between the YRD and NC during 1979–2013.(d) As in (c) but for January variables during 1980–2014.Numbers in the upper right are the CCs between two lines.The linear trends of all data were removed.

Fig.S2.The CCs between December HDs in NC and December (a) UV speed,(b) potential temperature and (c) RH from 1981 to 2017.White slanted lines indicate that the CCs represented by the shading exceed the 95% confidence level.The gray box indicates the location of NC.The linear trends of all data were removed.

Fig.S3.The CCs between January HDs in NC and the January (a) PBLH,(b) potential temperature and (c) RH from 1982 to 2018.White slanted lines indicate that the CCs represented by the shading exceed the 95% confidence level.The gray box indicates the location of NC.The linear trends of all data were removed.
杂志排行
Advances in Atmospheric Sciences的其它文章
- Upper Ocean Temperatures Hit Record High in 2020
- Comprehensive Marine Observing Experiment Based on High-Altitude Large Unmanned Aerial Vehicle (South China Sea Experiment 2020 of the“Petrel Project”)
- IAP’s Solar-Powered Unmanned Surface Vehicle Actively Passes through the Center of typhoon Sinlaku (2020)
- Distinctive MJO Activity during the Boreal Winter of the 2015/16 Super El Niño in Comparison with Other Super El Niño Events
- Monthly Variations of Atmospheric Circulations Associated with Haze Pollution in the Yangtze River Delta and North China
- Which Features of the SST Forcing Error Most Likely Disturb the Simulated Intensity of Tropical Cyclones?
