Over Confident, Tianqi Lithium Is Heavily In Debt Selling Equity, Tianqi Lithium Seizes Space Via Deadline Extension
2021-03-11
Over Confident, Tianqi Lithium Is Heavily In Debt Selling Equity, Tianqi Lithium Seizes Space Via Deadline Extension
Established in 2004, Tianqi Lithium is among top 5 suppliers of lithium ore in the world, mainly engaged in lithium ore and R&D, production and sales of lithium products including lithium chemical products and lithium carbonate. At present, Tianqi Group is the biggest shareholder of this company at the shareholding ratio of 30.66%; Zhangjing, the wife of Jiang Weiping, Chair of Tianqi Lithium, is the second biggest shareholder at the shareholding ratio of 5.19%.
I. Acquiring SQM equity at a super-high price led to bitter outcome
The awkward situation facing Tianqi Lithium comes from an acquisition case at a super-high price in 2018. At that time, Tianqi Lithium, a company with net assets of RMB 12 billion, bought 23.77% equity of SQM (from Nutrien, a Canadian fertilizer company), a lithium ore giant of Chili, at the price of USD 4.066 billion (RMB 25.92 billion), thus becoming the second biggest shareholder of SQM. That is to say, Tianqi Lithium owns 25.86% equity of SQM, including 2.1% equity previously owned.
In order to finish the aforesaid transaction, Tianqi Lithium and the banking consortium led by China Citic Bank entered into an agreement specifying the increase of M&A loan by USD 3.5 billion. This number includes domestic loan of USD 2.5 billion, i.e. 1) type A loan of USD 1.3 billion, with the term of one year. When expiring, deadline can be extended one more year, backdated to November, 29, 2018; type B loan of USD 1.2 billion, with the term of three years. When expiring, deadline can be extended one more year, and when the extended deadline expires, it can be once again extended one more year, backdated to November, 29, 2018. In addition, there is also an oversea loan of USD 1 billion, with the term of one year. When expiring, deadline can be extended one more year, also backdated to November, 29, 2018.
At present, type A loan (USD 1.3 billion) of domestic loan and the balance of oversea loan (USD 584 million), totaling USD 1.884 billion, expired on November, 29, which has been approved by banking consortium to extend to December, 28.
II. Skillfully conducting equity transaction to strive for more space via deadline extension
Previously, a lot of industrial practitioners guessed that Tianqi Lithium was likely to sell part of assets or equity to domestic companies or Albemarle Corporation of USA. However, Tianqi Lithium finally decided to cooperate with IGO, an Australian company. FIRB of Australia (Foreign Investment Review Board) prefers to make approval on such transaction considering the tensed relationship between China and Australia. According to public document, established in 2000, IGO is a mining and exploring company listed in Australia Stock Exchange that is mainly engaged in developing clean energy metals such as nickel, copper and cobalt while also involved in battery industrial chain to promote the development of green renewable energy, stored energy and electric vehicle. In fiscal year of 2020, the company made operating income of RMB 4.332 billion and net profit of RMB 750 million.
Besides, Tianqi Lithium chose to sell some equity of TLEA instead of Talison, which can avoid preemptive right owned by another big shareholder of Talison, Albemarle Corporation of USA. This helped Tianqi Lithium to effectively reduce its asset-liability ratio while still possessing the control of core assets. In this way, Tianqi Lithium optimized its capital structure and strengthened its overall capital ability and competitiveness. TLEA was an oversea wholly-owned subsidiary established by Tianqi Lithium in 2014 so as to complete Windfield equity purchasing transaction. Tianqi Lithium indirectly owns 51% equity of Australia Talison Lithium in the name of TLEA, and Australia Talison Lithium owns Greenbushes ore in west Australia that is the spodumene ore with the biggest reserves and best quality in progress in the world. Its capacity of technical-grade lithium concentrate is 150000 tons/year and its capacity of chemical-grade lithium concentrate is 1200 thousand tons/year.
As a result, after this capital increasing, Tianqi Lithium still possesses controlling right of TLEA and TLEA still exists in the company’s consolidated statements. Beside paying for related expense incurred by this transaction, all capital from this capital increase will be used to repay M&A loan from banking consortium, i.e. USD 1.2 billion and according interest; the rest will be reserved in TLEA as supplemental capital for the operation and debugging of Kwinana lithium hydroxide plant owned by TLEA’s subsidiary, Tianqi Lithium Kwinana Pty Ltd. (TLK).
Tianqi Lithium also made clear in its announcement that lithium concentrate bought by TLK from Talison should meet TLK’s demand in priority. After that, the rest will be meeting the demands of domestic plants and OEM of Tianqi Lithium. IGO does not have the priority in buying lithium concentrate, so IGO is just a strategic investor.
The following step for Tianqi Lithium is to revise banking consortium loan agreement, i.e. to extend the deadline of the debt of USD 1.884 billion (expiring in the end of December, 2020) to November, 26, 2021. Under the premise of TLEA finishing introducing strategic investor by equity capital increasing, and repaying the aforesaid banking consortium loan with no less than USD 1.2 billion via this transaction, the deadline can be extended to November, 25, 2022 automatically; to extend the deadline of original type B loan (USD 1.2 billion) of M&A loan to November, 29, 2023. Under certain premise and upon the approval of banking consortium, its deadline can be extended to November, 29, 2024.
As a consequence, thanks to deadline extension, Tianqi Lithium is greatly alleviated from its huge debt pressure and can have a break. Lithium price is gradually going up. As the company is making progress in performance, it is likely to tide over this debt crisis.
III. The inspiration drawn from this event
In the short term, Tianqi Lithium has not fully got rid of operation risks but just got alleviated for the time being. What we learned from Tianqi’s lesson is that we should always follow the principle of “steadiness” to complete merging and acquiring. Merging and acquiring needs more evaluation on our own assets and our own abilities. We should avoid the gambler psychology and need to be cautious about leveraged buyout.
Unit: metric ton
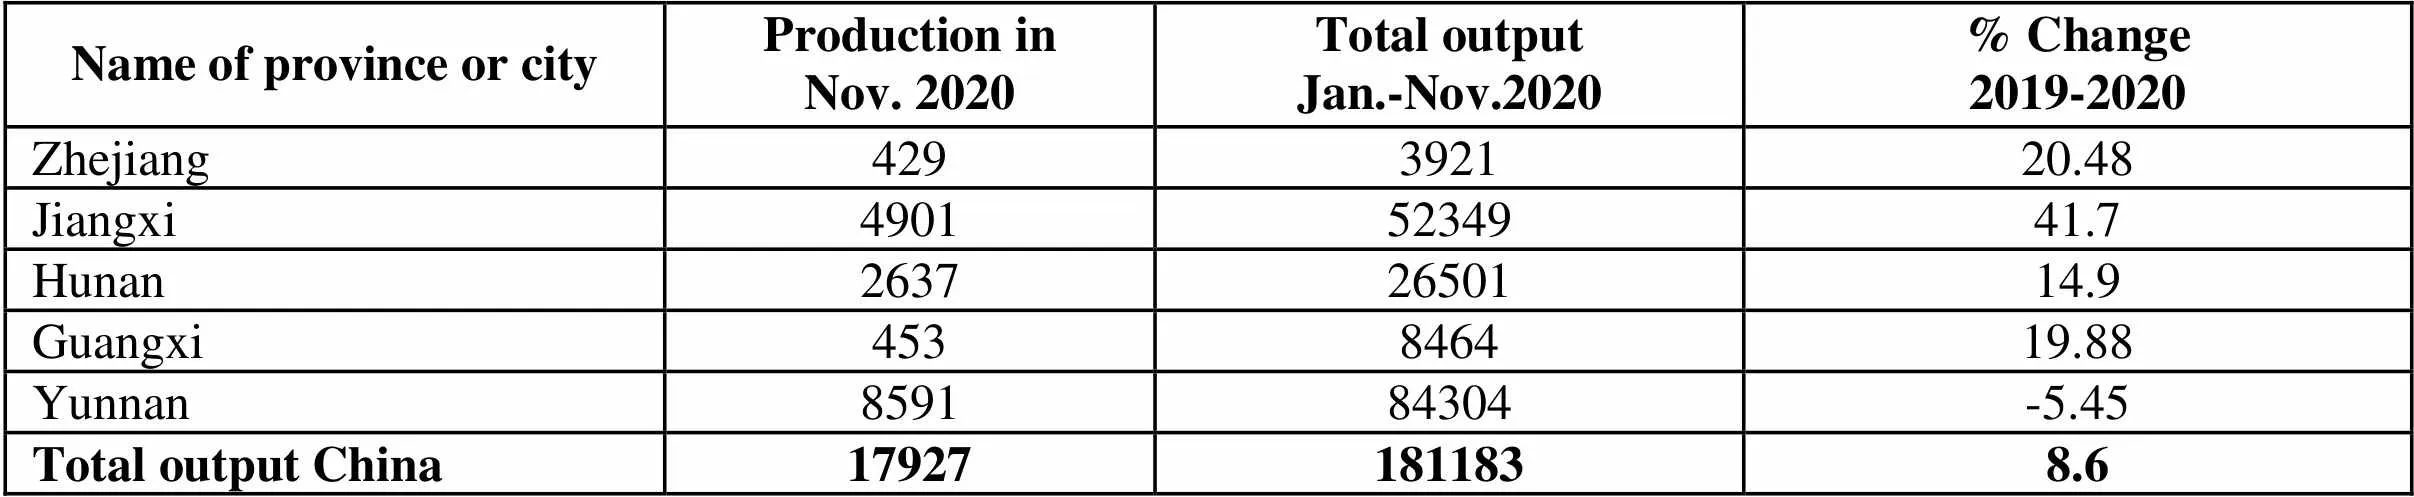
Name of province or cityProduction inNov. 2020Total outputJan.-Nov.2020% Change2019-2020 Zhejiang429392120.48 Jiangxi49015234941.7 Hunan26372650114.9 Guangxi453846419.88 Yunnan859184304-5.45 Total output China179271811838.6
Unit: metric ton
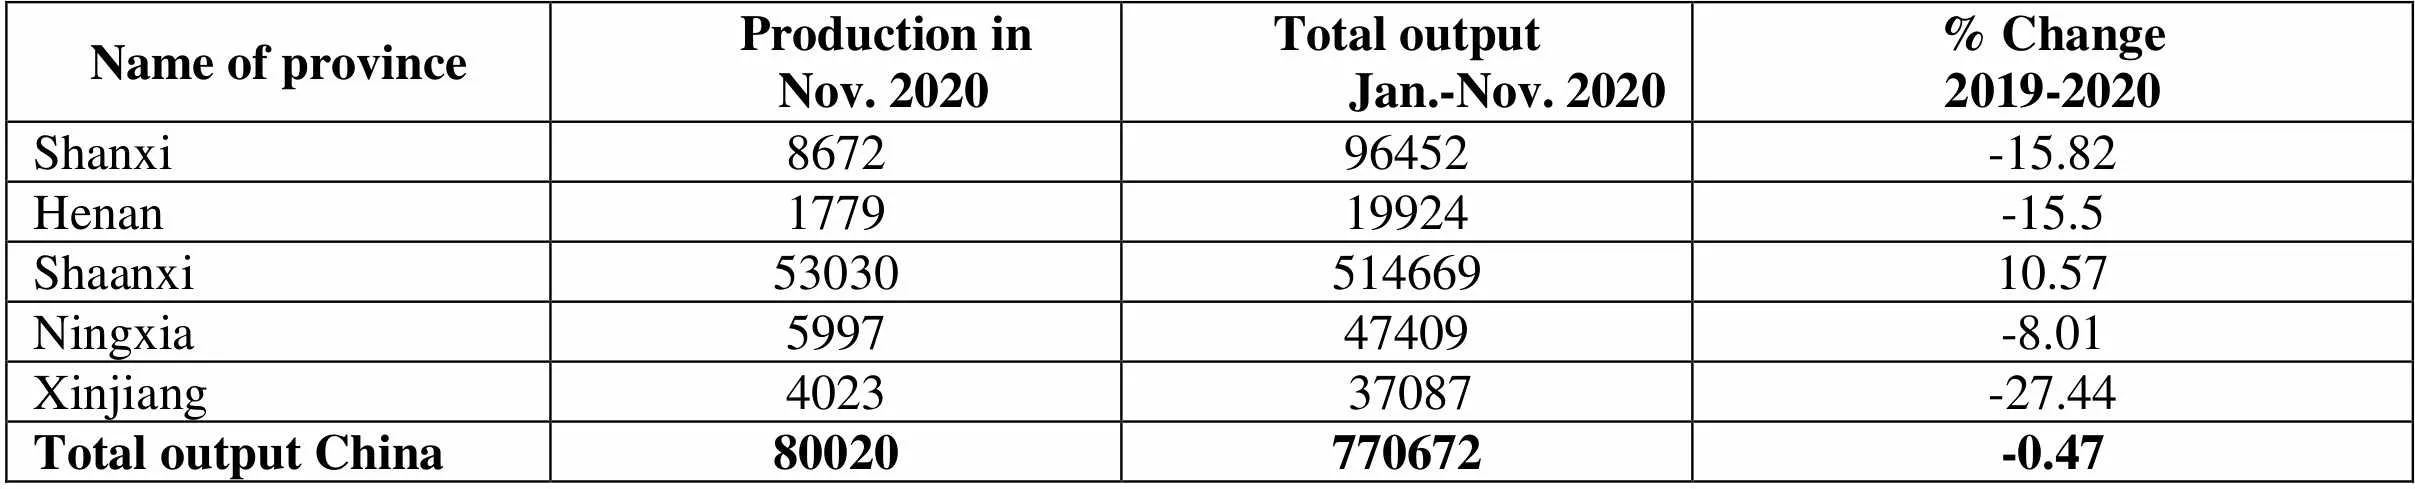
Name of province Production inNov. 2020Total output Jan.-Nov. 2020% Change2019-2020 Shanxi867296452-15.82 Henan177919924-15.5 Shaanxi5303051466910.57 Ningxia599747409-8.01 Xinjiang402337087-27.44 Total output China80020770672-0.47
Unit: metric ton
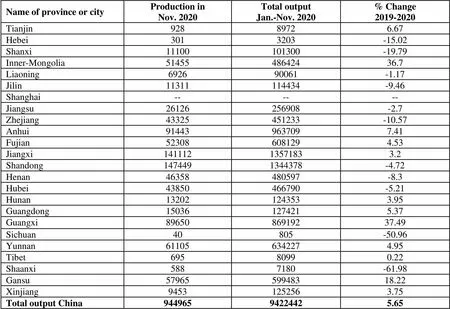
Name of province or cityProduction inNov. 2020Total outputJan.-Nov. 2020% Change2019-2020 Tianjin92889726.67 Hebei3013203-15.02 Shanxi11100101300-19.79 Inner-Mongolia5145548642436.7 Liaoning692690061-1.17 Jilin11311114434-9.46 Shanghai------ Jiangsu26126256908-2.7 Zhejiang43325451233-10.57 Anhui914439637097.41 Fujian523086081294.53 Jiangxi14111213571833.2 Shandong1474491344378-4.72 Henan46358480597-8.3 Hubei43850466790-5.21 Hunan132021243533.95 Guangdong150361274215.37 Guangxi8965086919237.49 Sichuan40805-50.96 Yunnan611056342274.95 Tibet69580990.22 Shaanxi5887180-61.98 Gansu5796559948318.22 Xinjiang94531252563.75 Total output China94496594224425.65
Unit: metric ton
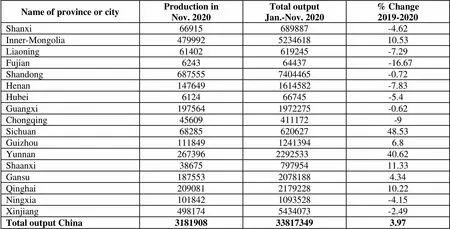
Name of province or cityProduction inNov. 2020Total outputJan.-Nov. 2020% Change2019-2020 Shanxi66915689887-4.62 Inner-Mongolia479992523461810.53 Liaoning61402619245-7.29 Fujian624364437-16.67 Shandong6875557404465-0.72 Henan1476491614582-7.83 Hubei612466745-5.4 Guangxi1975641972275-0.62 Chongqing45609411172-9 Sichuan6828562062748.53 Guizhou11184912413946.8 Yunnan267396229253340.62 Shaanxi3867579795411.33 Gansu18755320781884.34 Qinghai209081217922810.22 Ningxia1018421093528-4.15 Xinjiang4981745434073-2.49 Total output China3181908338173493.97
Unit: metric ton
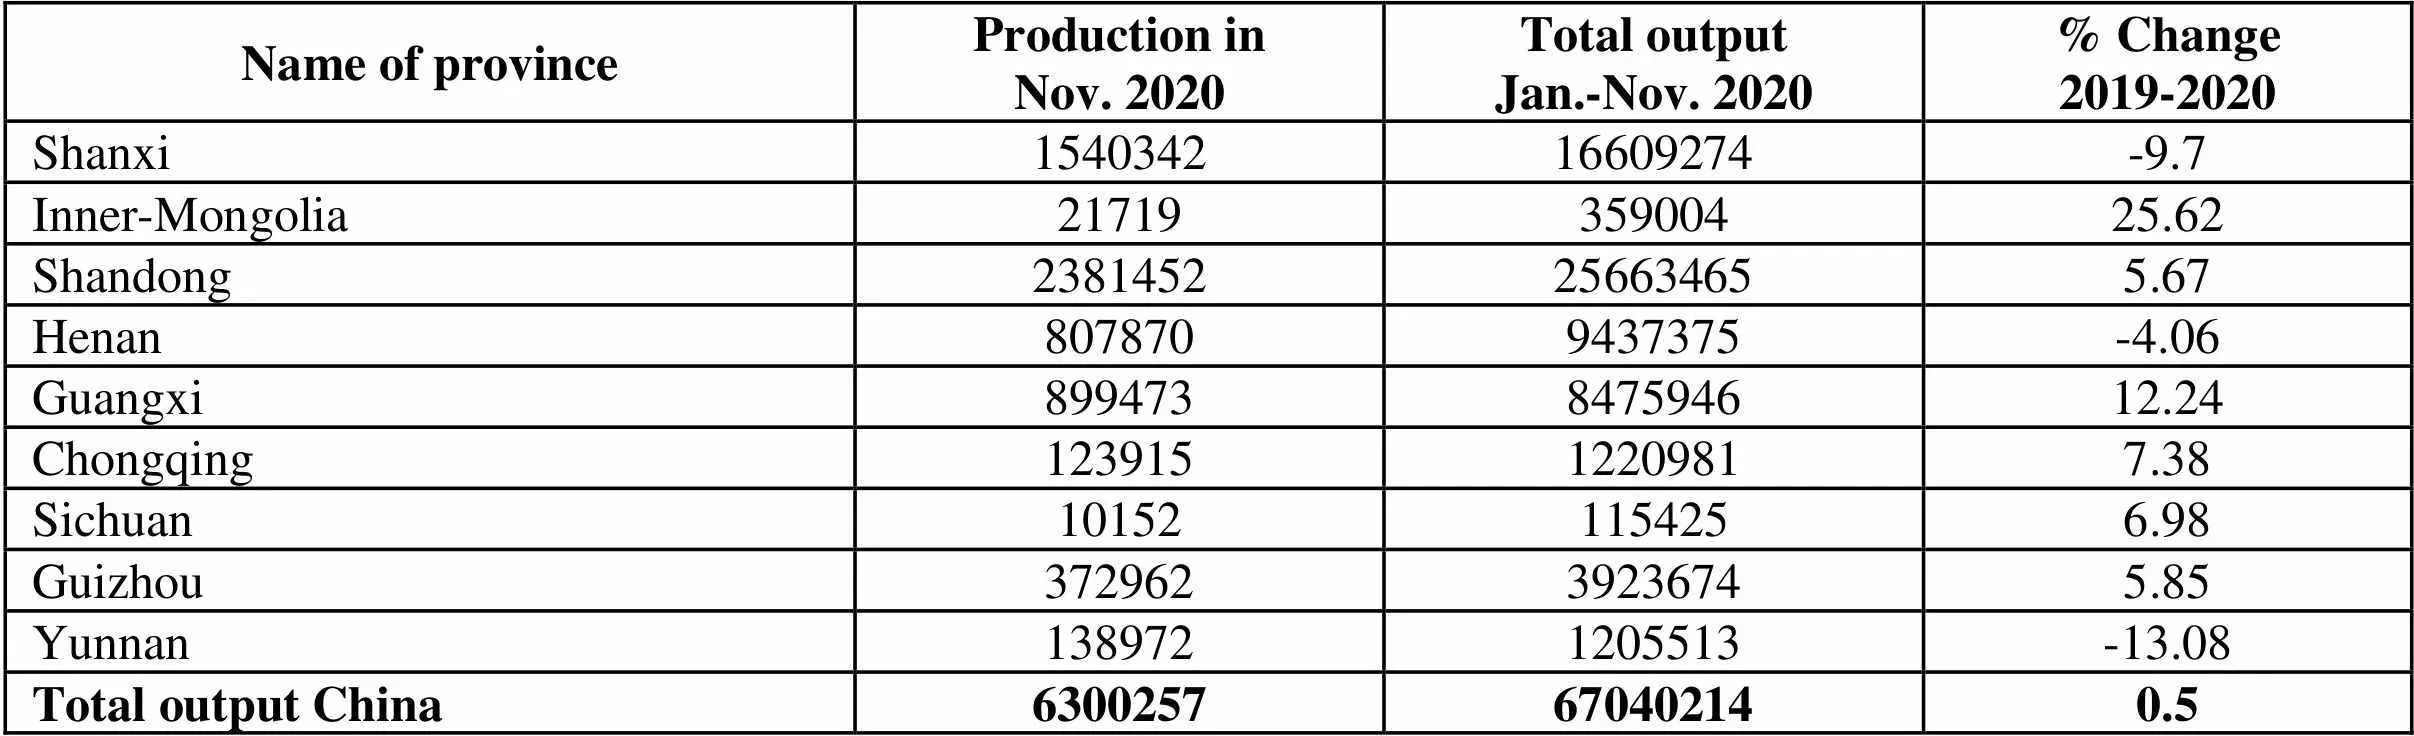
Name of province Production inNov. 2020Total outputJan.-Nov. 2020% Change2019-2020 Shanxi154034216609274-9.7 Inner-Mongolia2171935900425.62 Shandong2381452256634655.67 Henan8078709437375-4.06 Guangxi899473847594612.24 Chongqing12391512209817.38 Sichuan101521154256.98 Guizhou37296239236745.85 Yunnan1389721205513-13.08 Total output China6300257670402140.5
Unit: metric ton
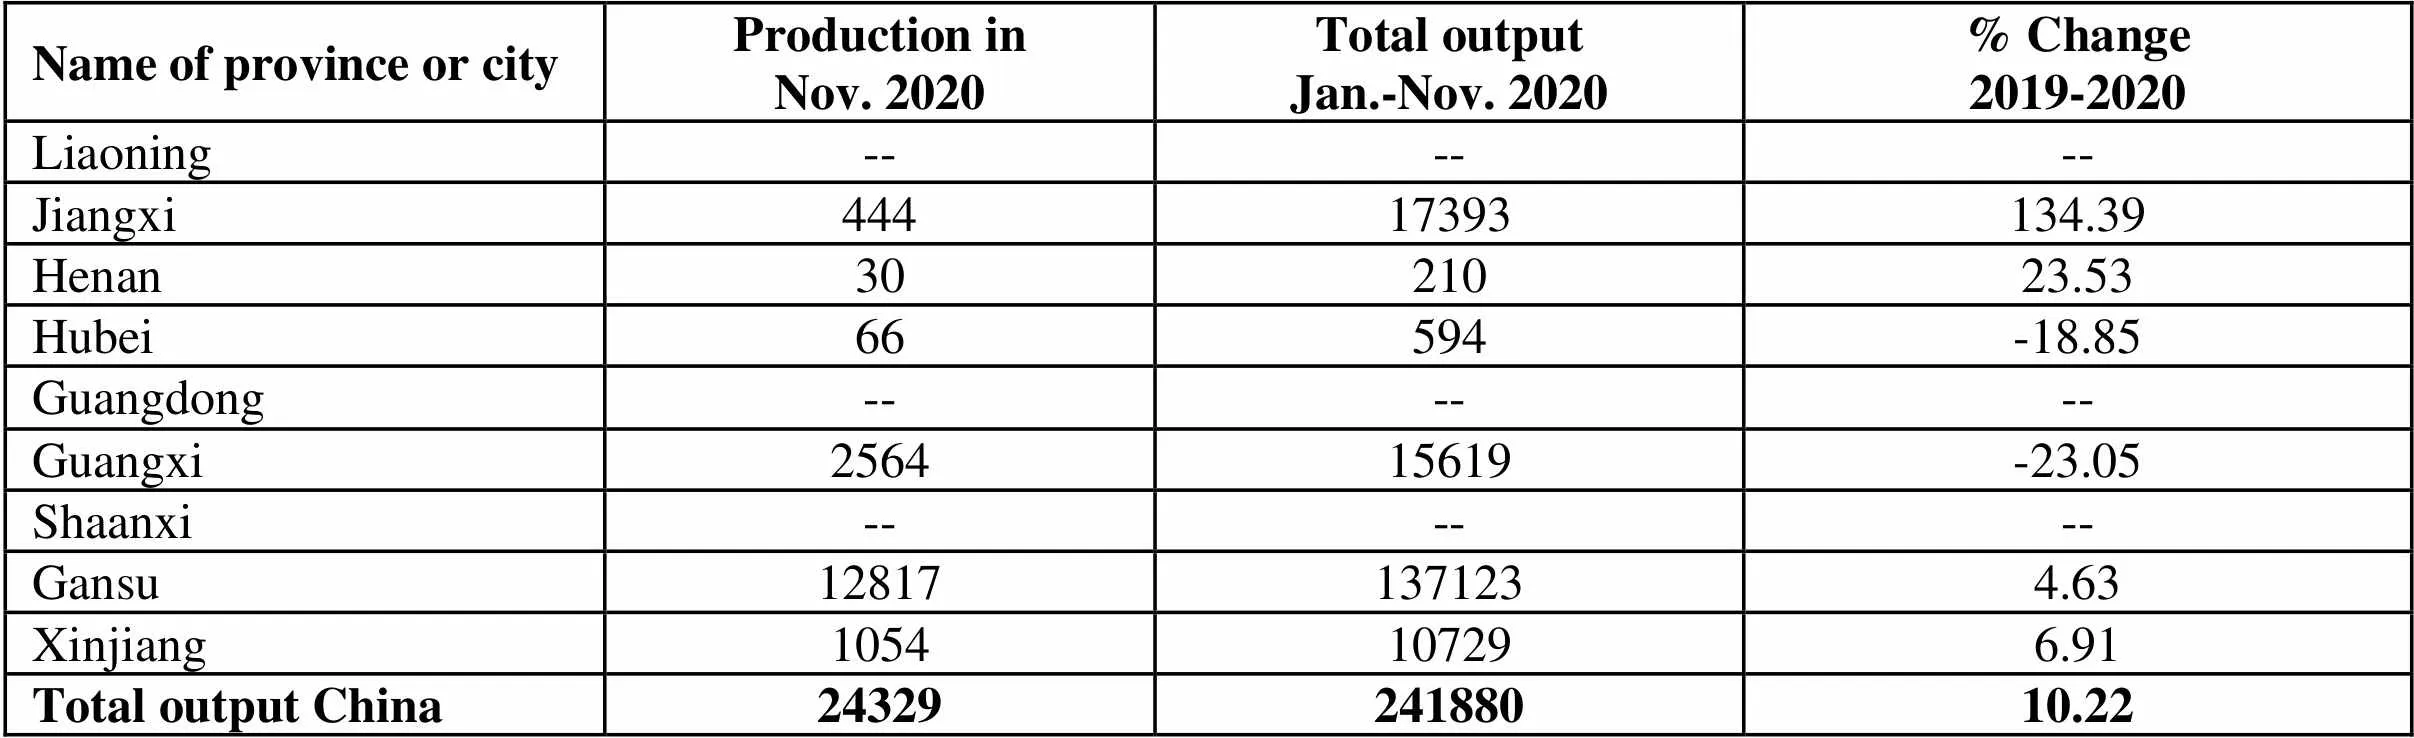
Name of province or cityProduction inNov. 2020Total outputJan.-Nov. 2020% Change2019-2020 Liaoning------ Jiangxi44417393134.39 Henan3021023.53 Hubei66594-18.85 Guangdong------ Guangxi256415619-23.05 Shaanxi------ Gansu128171371234.63 Xinjiang1054107296.91 Total output China2432924188010.22
Unit: metric ton
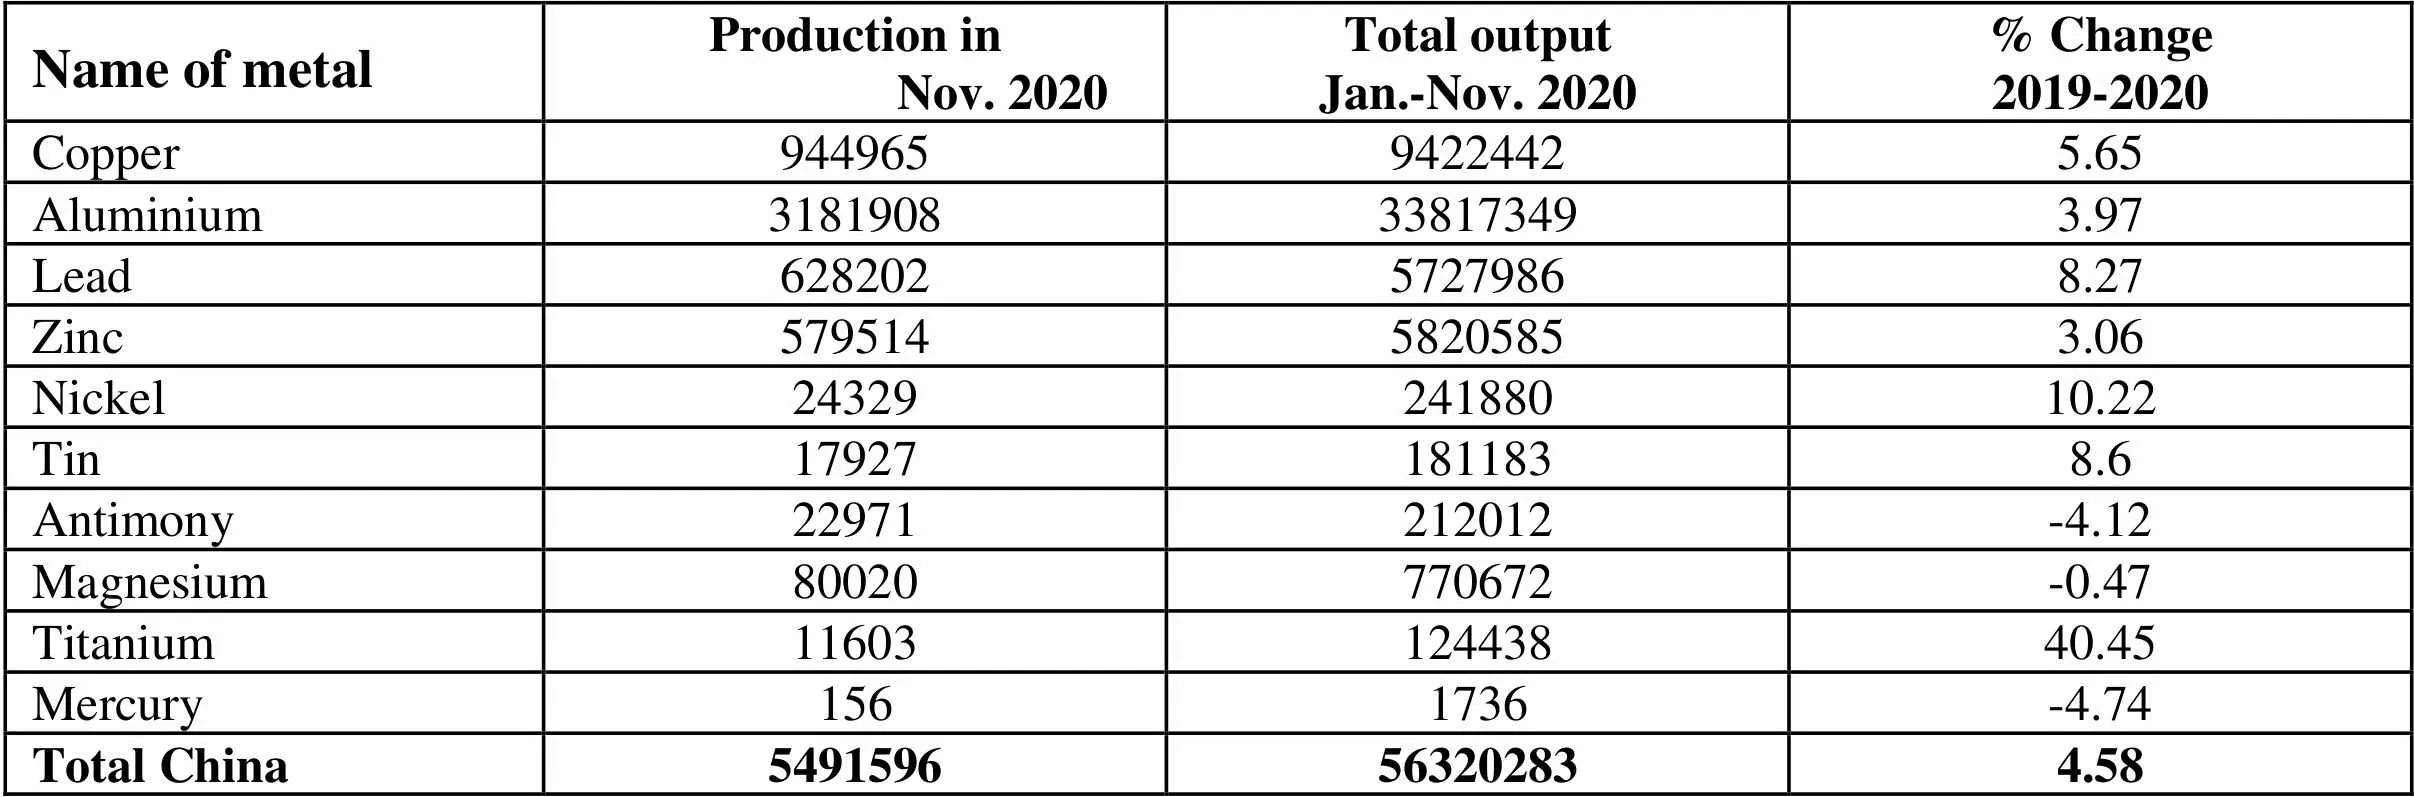
Name of metalProduction in Nov. 2020Total outputJan.-Nov. 2020% Change2019-2020 Copper94496594224425.65 Aluminium3181908338173493.97 Lead62820257279868.27 Zinc57951458205853.06 Nickel2432924188010.22 Tin179271811838.6 Antimony22971212012-4.12 Magnesium80020770672-0.47 Titanium1160312443840.45 Mercury1561736-4.74 Total China5491596563202834.58
Unit: metric ton
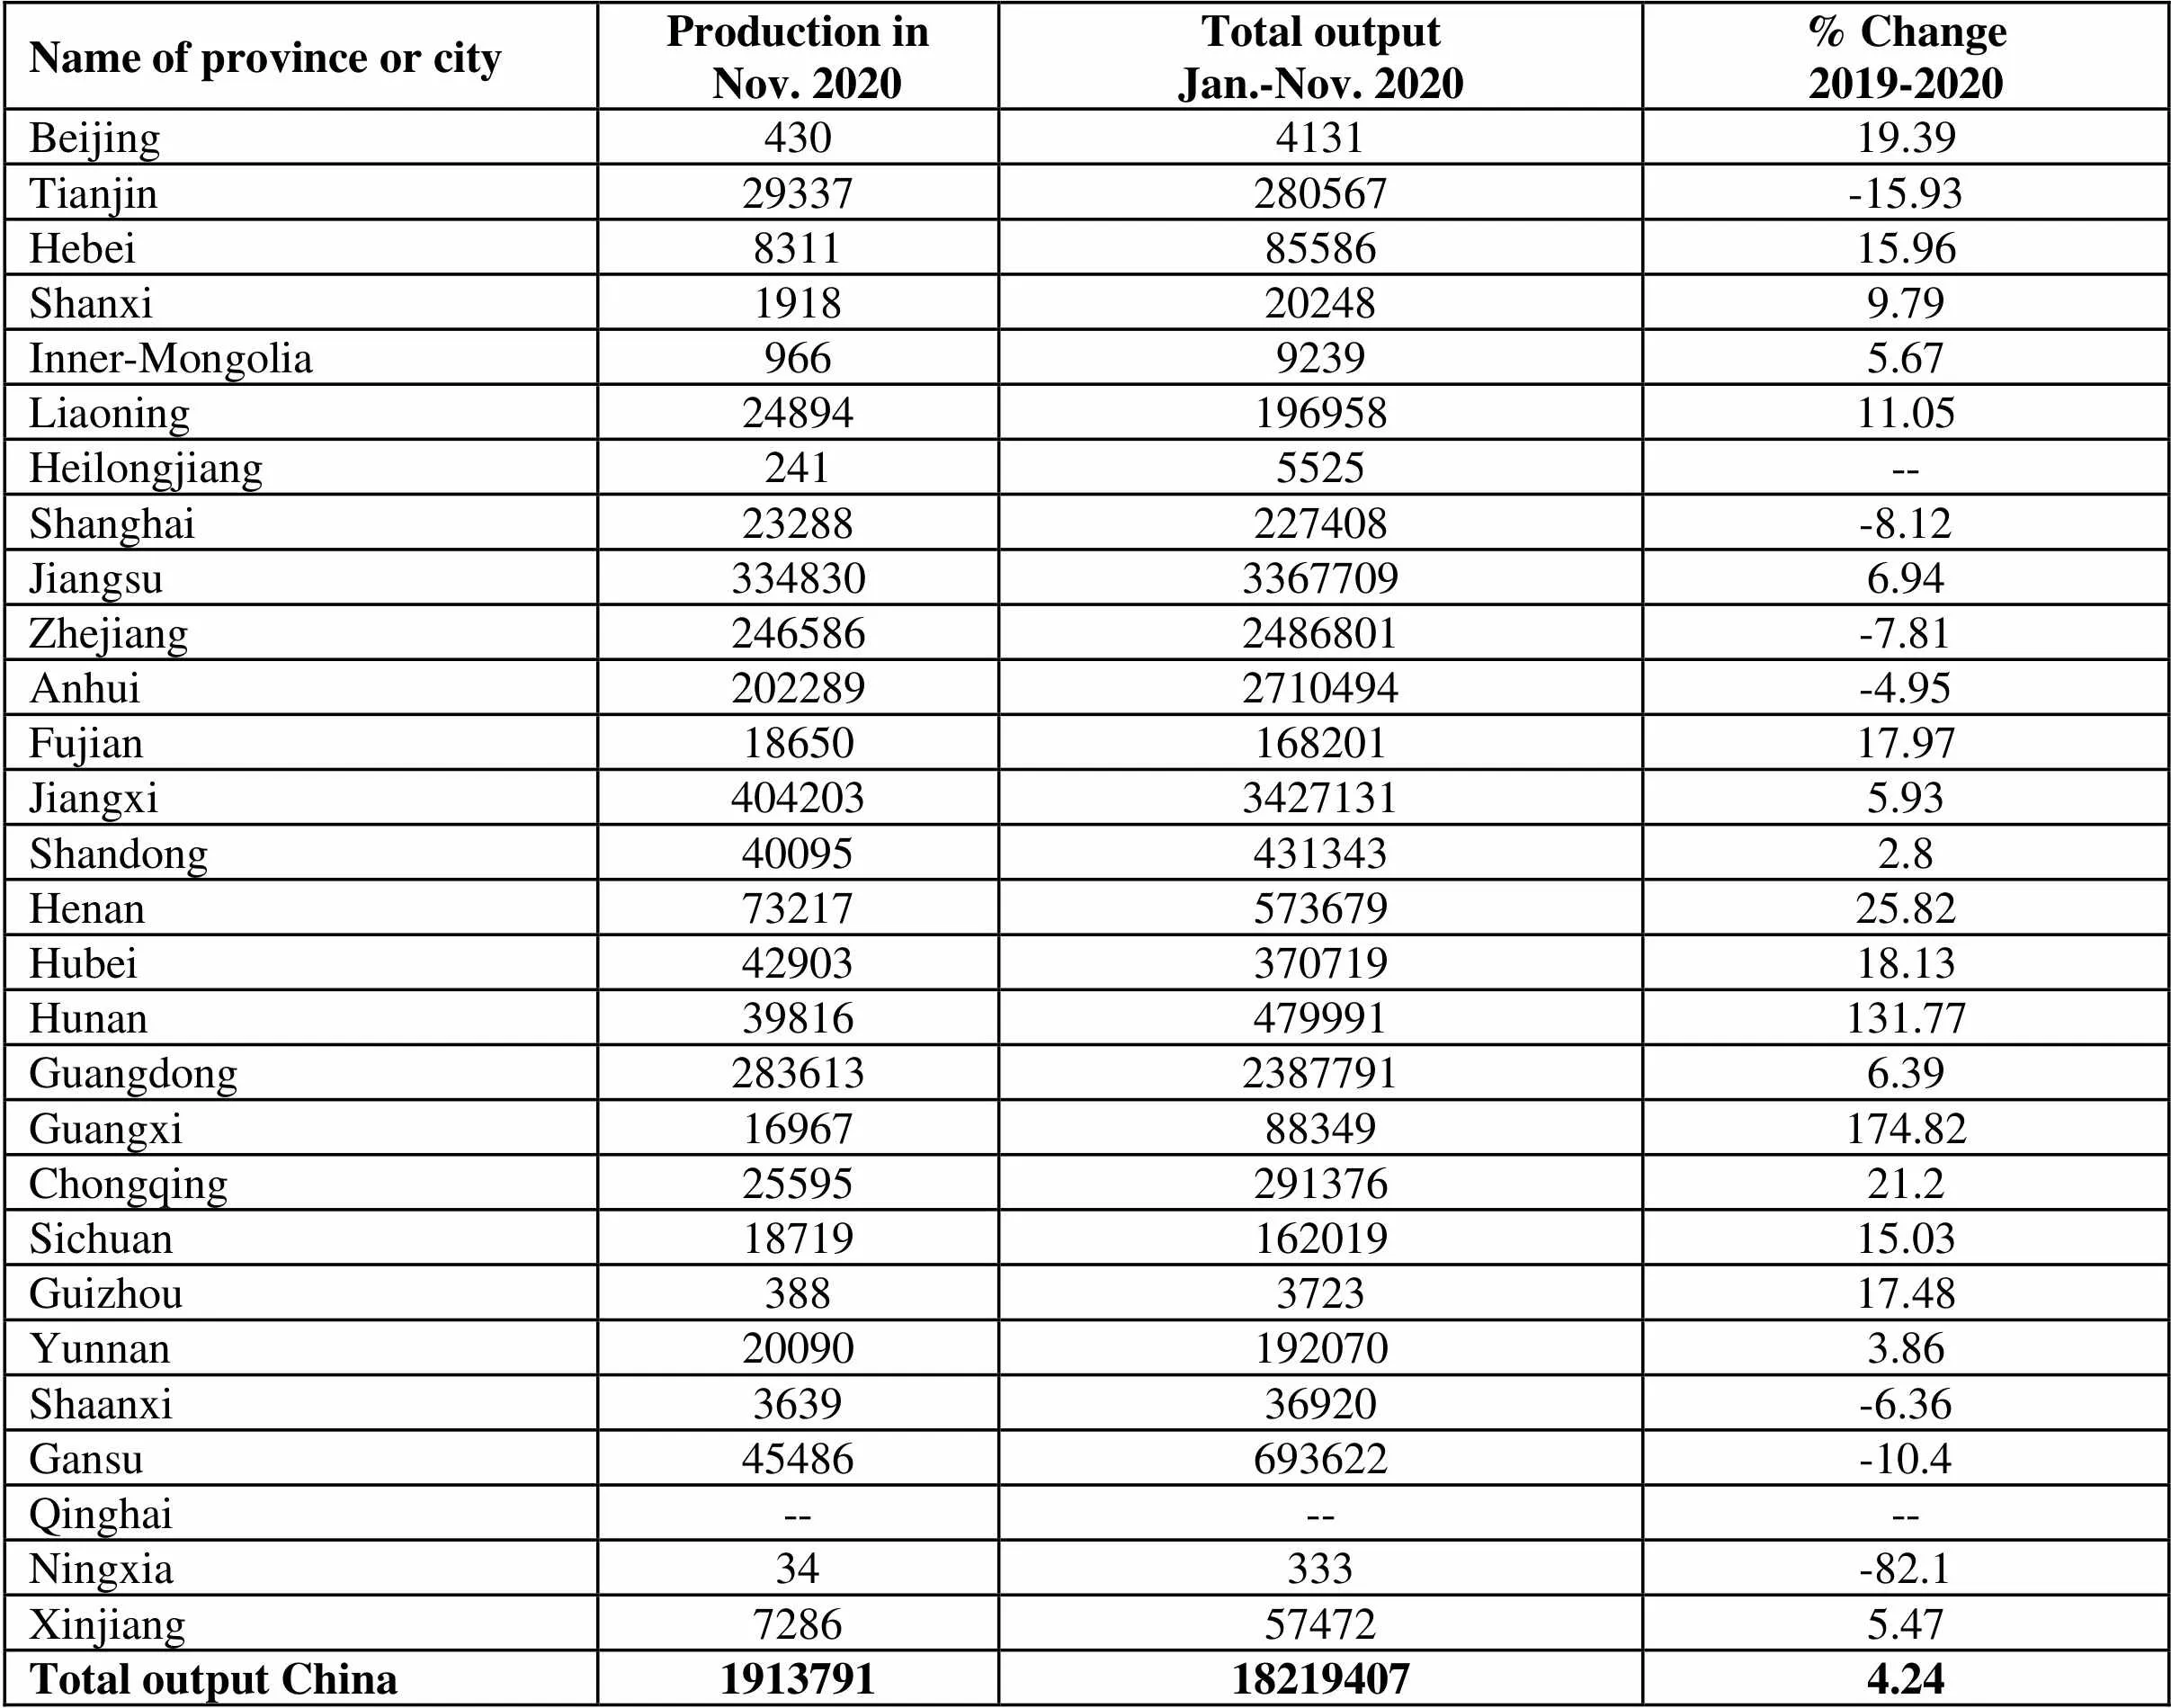
Name of province or cityProduction inNov. 2020Total outputJan.-Nov. 2020% Change2019-2020 Beijing430413119.39 Tianjin29337280567-15.93 Hebei83118558615.96 Shanxi1918202489.79 Inner-Mongolia96692395.67 Liaoning2489419695811.05 Heilongjiang2415525-- Shanghai23288227408-8.12 Jiangsu33483033677096.94 Zhejiang2465862486801-7.81 Anhui2022892710494-4.95 Fujian1865016820117.97 Jiangxi40420334271315.93 Shandong400954313432.8 Henan7321757367925.82 Hubei4290337071918.13 Hunan39816479991131.77 Guangdong28361323877916.39 Guangxi1696788349174.82 Chongqing2559529137621.2 Sichuan1871916201915.03 Guizhou388372317.48 Yunnan200901920703.86 Shaanxi363936920-6.36 Gansu45486693622-10.4 Qinghai------ Ningxia34333-82.1 Xinjiang7286574725.47 Total output China1913791182194074.24
Unit: metric ton
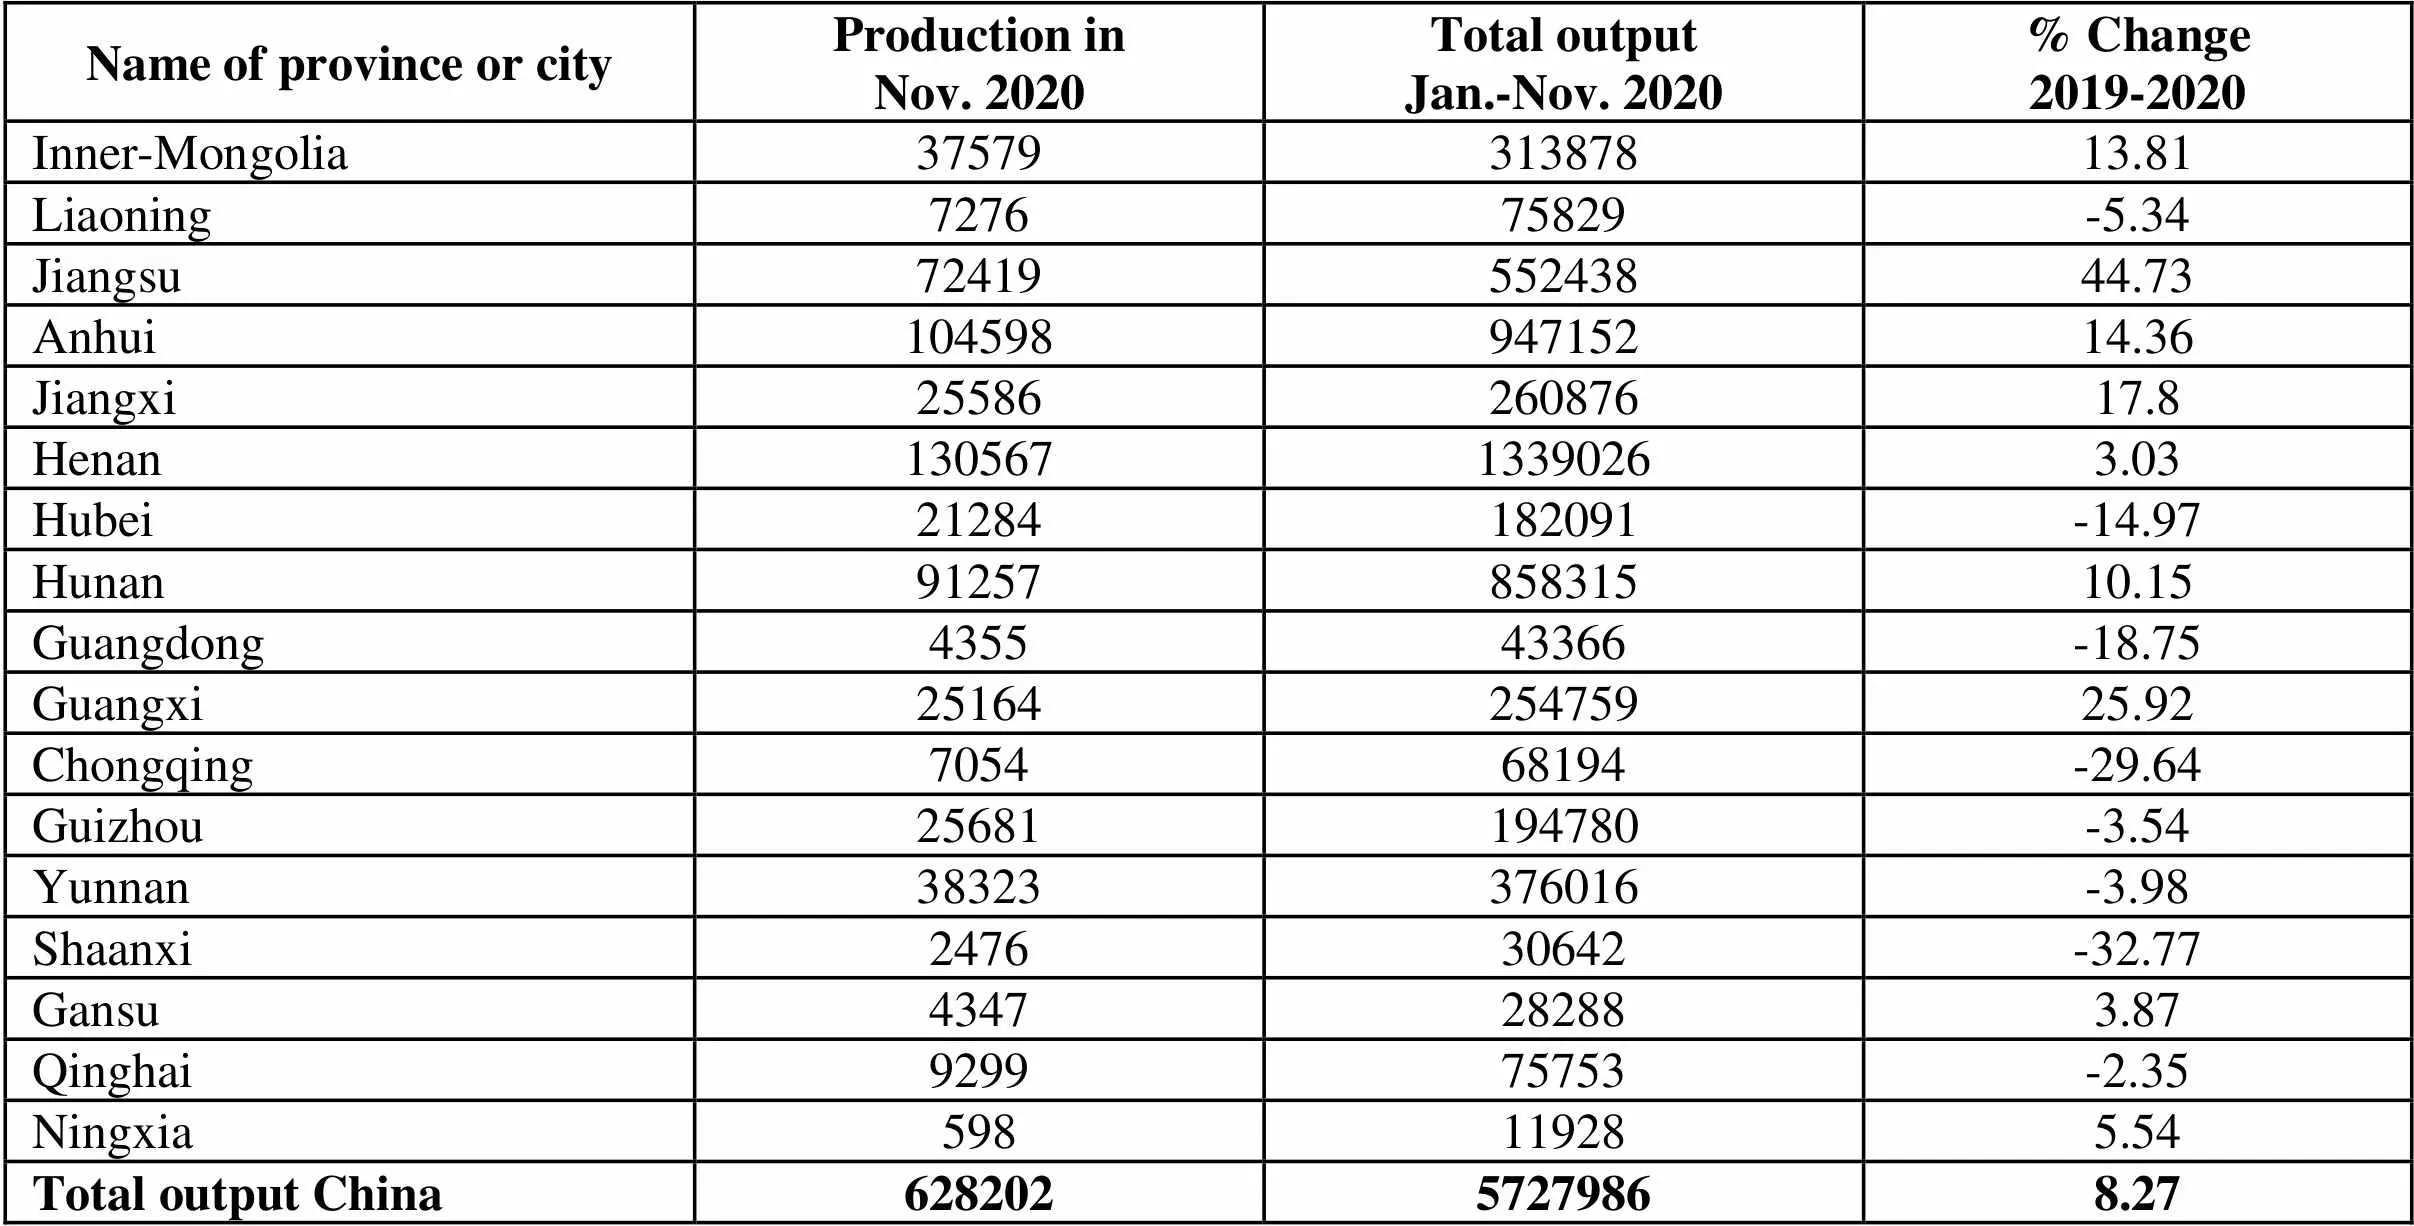
Name of province or cityProduction inNov. 2020Total outputJan.-Nov. 2020% Change2019-2020 Inner-Mongolia 3757931387813.81 Liaoning727675829-5.34 Jiangsu7241955243844.73 Anhui10459894715214.36 Jiangxi2558626087617.8 Henan13056713390263.03 Hubei21284182091-14.97 Hunan9125785831510.15 Guangdong435543366-18.75 Guangxi2516425475925.92 Chongqing705468194-29.64 Guizhou25681194780-3.54 Yunnan38323376016-3.98 Shaanxi247630642-32.77 Gansu4347282883.87 Qinghai929975753-2.35 Ningxia598119285.54 Total output China62820257279868.27
Unit: metric ton(metal content)
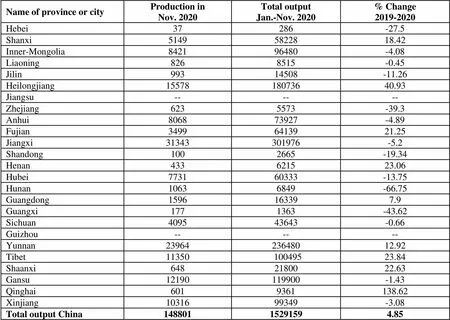
Name of province or cityProduction inNov. 2020Total outputJan.-Nov. 2020% Change2019-2020 Hebei37286-27.5 Shanxi51495822818.42 Inner-Mongolia842196480-4.08 Liaoning8268515-0.45 Jilin99314508-11.26 Heilongjiang1557818073640.93 Jiangsu------ Zhejiang6235573-39.3 Anhui806873927-4.89 Fujian34996413921.25 Jiangxi31343301976-5.2 Shandong1002665-19.34 Henan433621523.06 Hubei773160333-13.75 Hunan10636849-66.75 Guangdong1596163397.9 Guangxi1771363-43.62 Sichuan409543643-0.66 Guizhou------ Yunnan2396423648012.92 Tibet1135010049523.84 Shaanxi6482180022.63 Gansu12190119900-1.43 Qinghai6019361138.62 Xinjiang1031699349-3.08 Total output China14880115291594.85
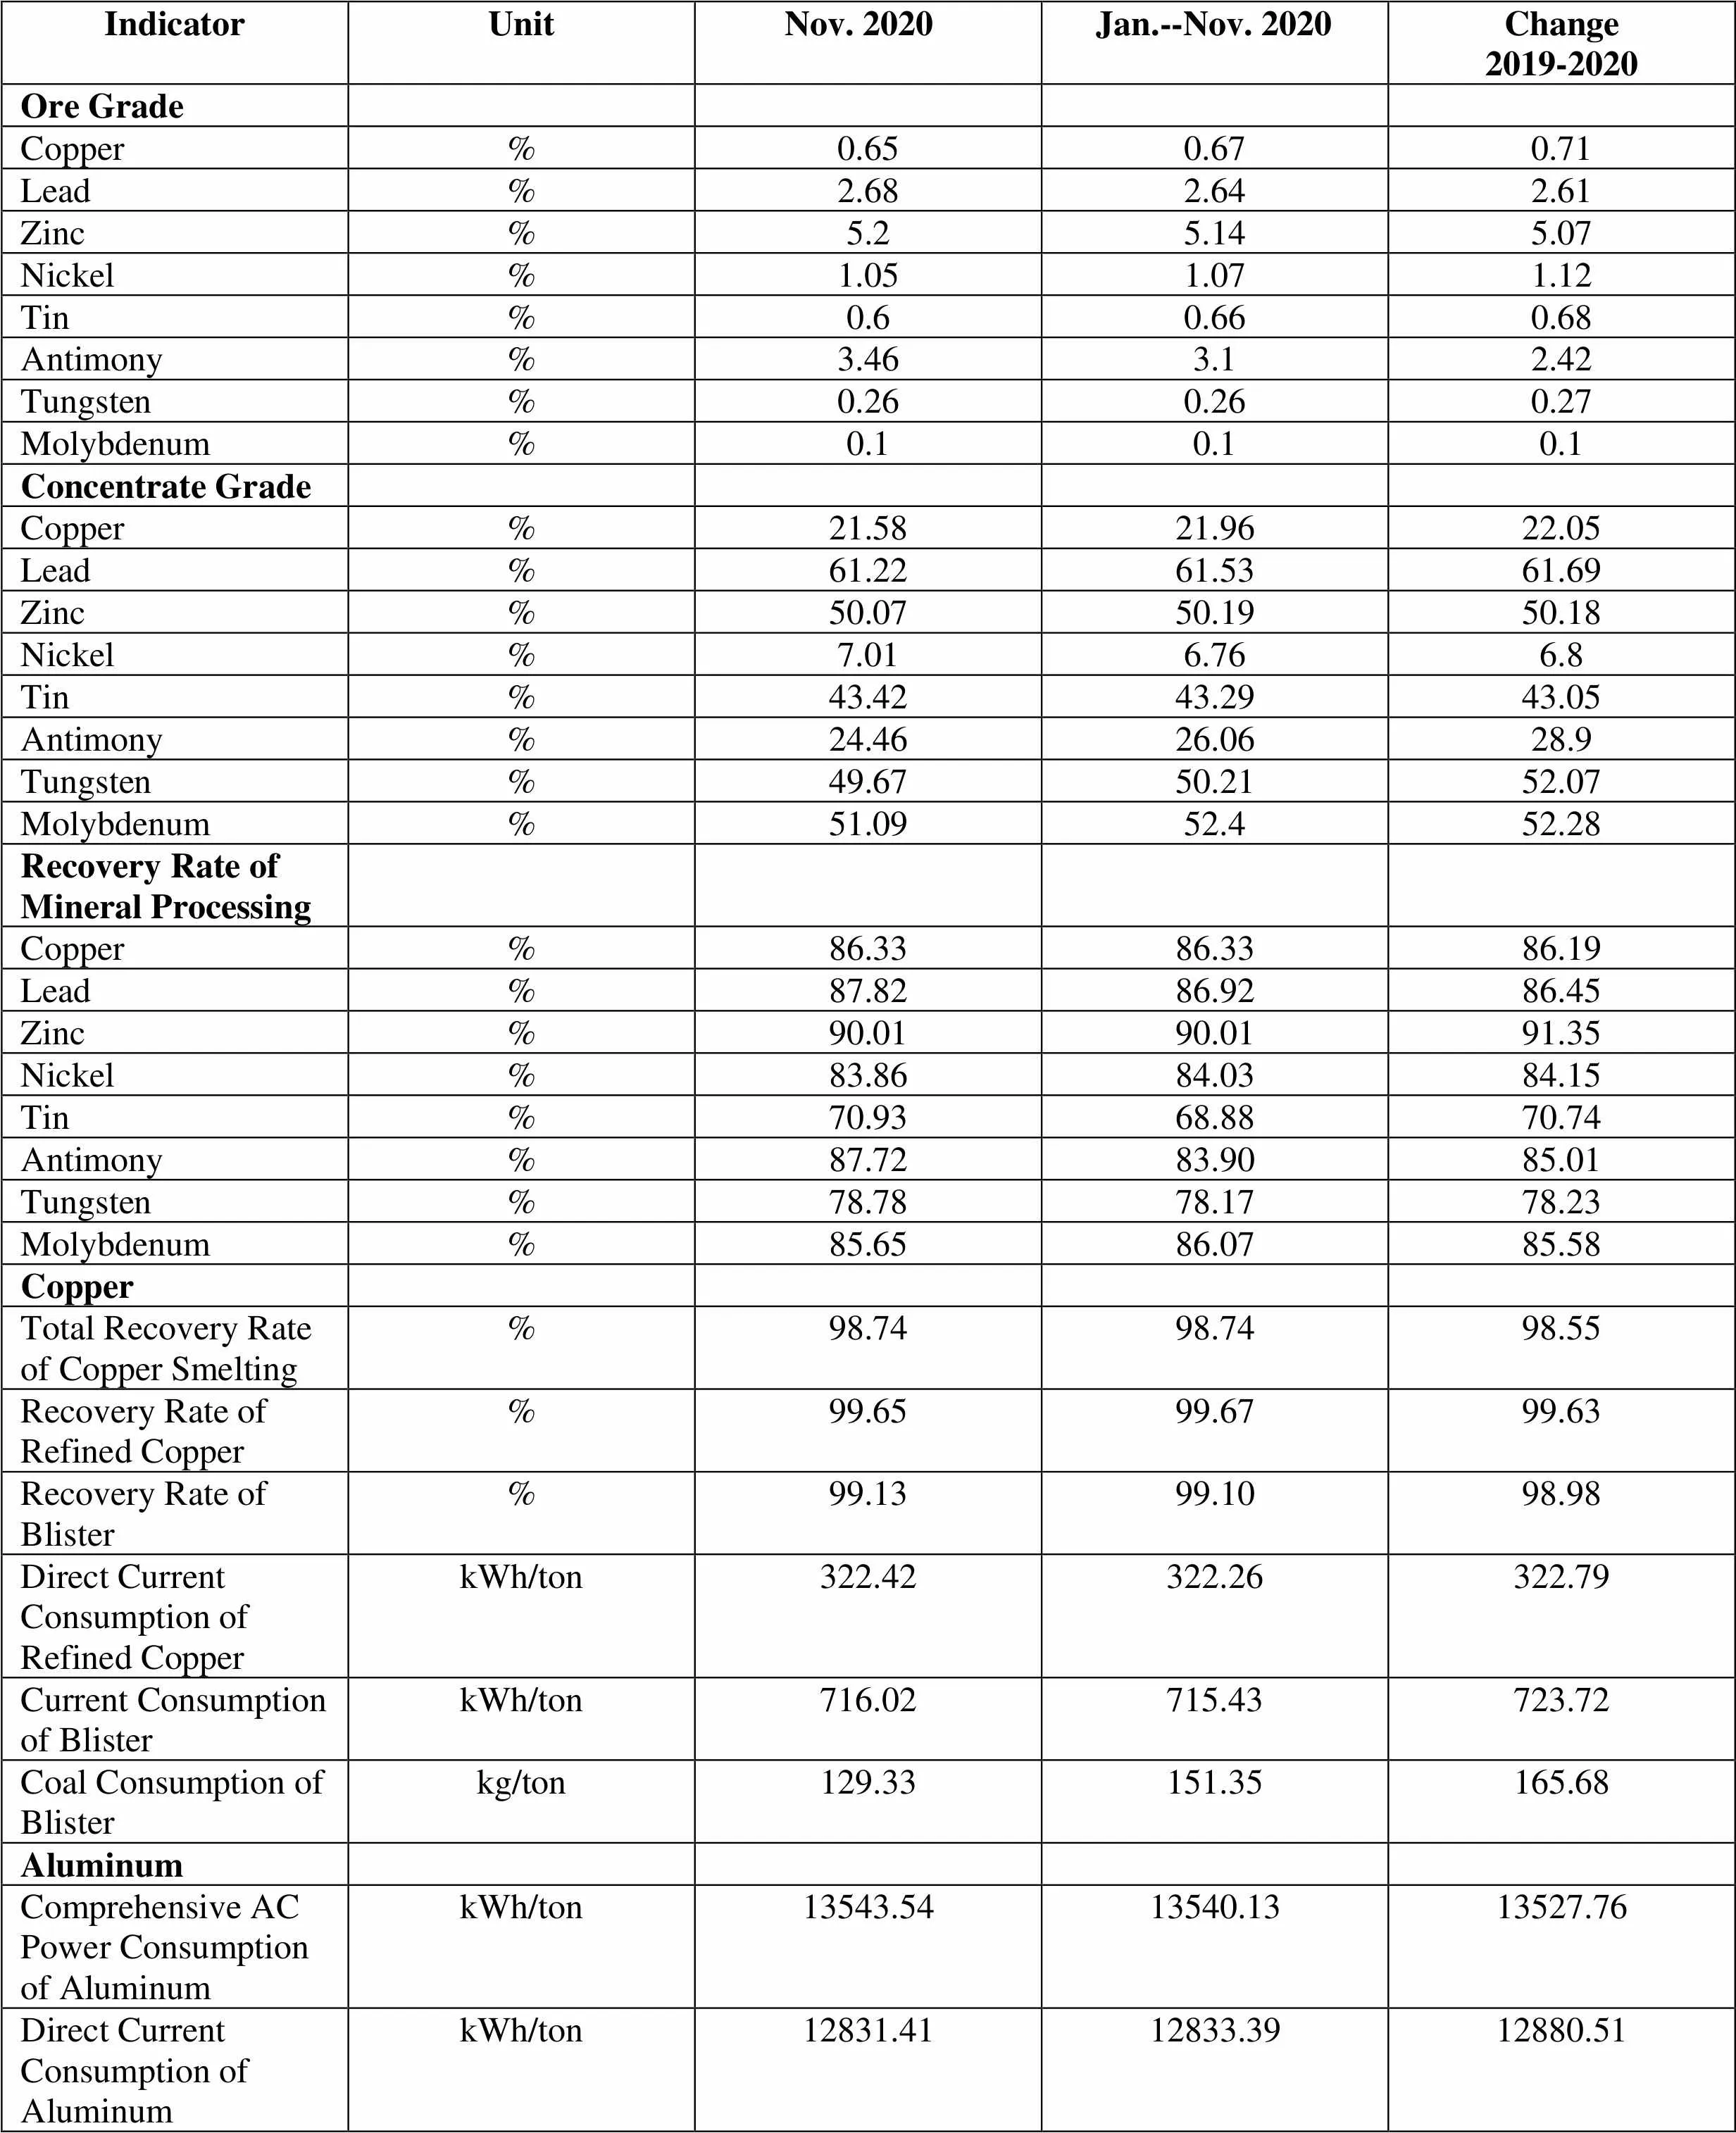
IndicatorUnitNov. 2020Jan.--Nov. 2020Change2019-2020 Ore Grade Copper%0.650.670.71 Lead%2.682.642.61 Zinc%5.25.145.07 Nickel%1.051.071.12 Tin%0.60.660.68 Antimony%3.463.12.42 Tungsten%0.260.260.27 Molybdenum%0.10.10.1 Concentrate Grade Copper%21.5821.9622.05 Lead%61.2261.5361.69 Zinc%50.0750.1950.18 Nickel%7.016.766.8 Tin%43.4243.2943.05 Antimony%24.4626.0628.9 Tungsten%49.6750.2152.07 Molybdenum%51.0952.452.28 Recovery Rate of Mineral Processing Copper%86.3386.3386.19 Lead%87.8286.9286.45 Zinc%90.0190.0191.35 Nickel%83.8684.0384.15 Tin%70.9368.8870.74 Antimony%87.7283.9085.01 Tungsten%78.7878.1778.23 Molybdenum%85.6586.0785.58 Copper Total Recovery Rate of Copper Smelting%98.7498.7498.55 Recovery Rate of Refined Copper%99.6599.6799.63 Recovery Rate of Blister%99.1399.1098.98 Direct Current Consumption of Refined CopperkWh/ton322.42322.26322.79 Current Consumption of BlisterkWh/ton716.02715.43723.72 Coal Consumption of Blisterkg/ton129.33151.35165.68 Aluminum Comprehensive AC Power Consumption of AluminumkWh/ton13543.5413540.1313527.76 Direct Current Consumption of AluminumkWh/ton12831.4112833.3912880.51
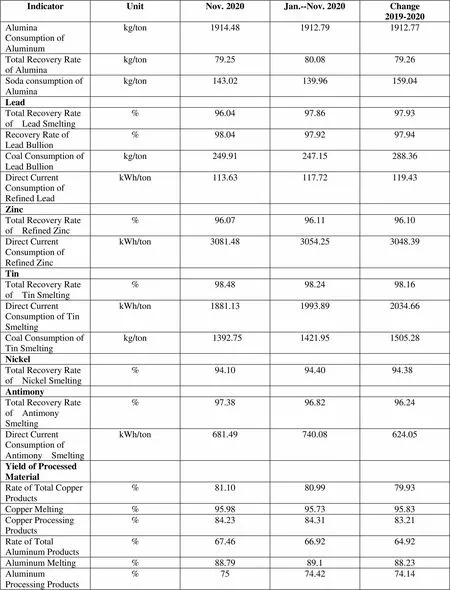
IndicatorUnitNov. 2020Jan.--Nov. 2020Change2019-2020 Alumina Consumption of Aluminumkg/ton1914.481912.791912.77 Total Recovery Rate of Aluminakg/ton79.2580.0879.26 Soda consumption of Aluminakg/ton143.02139.96159.04 Lead Total Recovery Rate of Lead Smelting%96.0497.8697.93 Recovery Rate of Lead Bullion%98.0497.9297.94 Coal Consumption of Lead Bullionkg/ton249.91247.15288.36 Direct Current Consumption of Refined LeadkWh/ton113.63117.72119.43 Zinc Total Recovery Rate of Refined Zinc%96.0796.1196.10 Direct Current Consumption of Refined ZinckWh/ton3081.483054.253048.39 Tin Total Recovery Rate of Tin Smelting%98.4898.2498.16 Direct Current Consumption of Tin SmeltingkWh/ton1881.131993.892034.66 Coal Consumption of Tin Smeltingkg/ton1392.751421.951505.28 Nickel Total Recovery Rate of Nickel Smelting%94.1094.4094.38 Antimony Total Recovery Rate of Antimony Smelting%97.3896.8296.24 Direct Current Consumption of Antimony SmeltingkWh/ton681.49740.08624.05 Yield of Processed Material Rate of Total Copper Products%81.1080.9979.93 Copper Melting %95.9895.7395.83 Copper Processing Products%84.2384.3183.21 Rate of Total Aluminum Products%67.4666.9264.92 Aluminum Melting%88.7989.188.23 Aluminum Processing Products%7574.4274.14
Unit: metric ton
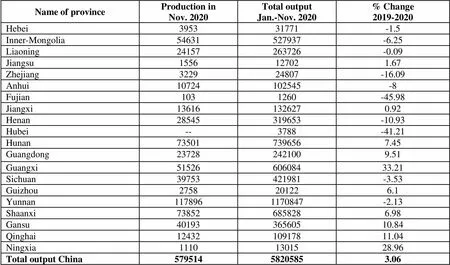
Name of provinceProduction inNov. 2020Total output Jan.-Nov. 2020% Change2019-2020 Hebei395331771-1.5 Inner-Mongolia54631527937-6.25 Liaoning24157263726-0.09 Jiangsu1556127021.67 Zhejiang322924807-16.09 Anhui10724102545-8 Fujian1031260-45.98 Jiangxi136161326270.92 Henan28545319653-10.93 Hubei--3788-41.21 Hunan735017396567.45 Guangdong237282421009.51 Guangxi5152660608433.21 Sichuan39753421981-3.53 Guizhou2758201226.1 Yunnan1178961170847-2.13 Shaanxi738526858286.98 Gansu4019336560510.84 Qinghai1243210917811.04 Ningxia11101301528.96 Total output China57951458205853.06
