A homogenous microstructural Mg-based matrix model for orthopedic application with generating uniform and smooth corrosion product layer in Ringer’s solution:Study on biodegradable behavior of Mg-Zn alloys prepared by powder metallurgy as a case
2021-03-10YngYnXinChuXierLuoXuemeiXuYuZhngYiLongDiDingLiLingjinChenToXioKunYu
Yng Yn,Xin Chu,Xier Luo,Xuemei Xu,Yu Zhng,YiLong Di,Ding Li,Lingjin Chen,To Xio,Kun Yu,b,∗
a School of Materials Science and Engineering,Central South University,Changsha 410083,China
b Department of Materials Science and Engineering,Yantai Nanshan University,Yantai 265713,China
c The Second Xiangya Hospital,Central South University,Changsha 410011,China
d The Third Xiangya Hospital,Central South University,Changsha 410011,China
Received 31 August 2019;
received in revised form 11 March 2020;accepted 20 March 2020
Available online 1 September 2020
Abstract For high corrosion resistance and extensively modified biodegradable Mg-based alloys and composites for bone implants,a new Mgbased matrix model prepared by powder metallurgy is discussed and developed.In this research,Mg-5wt.%Zn alloys were selected as a case.And they were impacted by hot extrusion and aging treatments to construct microstructure with different characteristics.Their selfforming corrosion product layer in Ringer’s solution,biodegradable behavior and corrosion mechanism were minutely investigated by in vitro degradation,electrochemical corrosion and cytocompatibility.The results demonstrated the extruded Mg-5wt.%Zn alloy aged for 96h showed high corrosion resistance,good biocompatibility for L929 and excellent ability of maintaining sample integrity during the immersion.Significantly,the alloy showed fine-grain microstructure and uniform distributed hundred nano-sized second phases,which promoted the formation of the uniform and smooth corrosion product layer at the beginning of immersion.The corrosion product layer was more stable in chloride containing aqueous solution and could be directly formed and repaired quickly,which effectively protected the matrix from further corrosion.In addition,an ideal model of Mg-based matrix for bone tissue engineering was tried to presume and propose by discussing the causal relationship between microstructure and bio-corrosion process.© 2020 Published by Elsevier B.V.on behalf of Chongqing University.This is an open access article under the CC BY-NC-ND license.(http://creativecommons.org/licenses/by-nc-nd/4.0/)Peer review under responsibility of Chongqing University
Keywords:Magnesium alloys;Powder metallurgy;Second phase;Corrosion product layer;Biodegradable behavior;Cytocompatibility.
1.Introduction
The ideal biodegradable implants for repairing damaged bone tissue should be gradually dissolved and absorbed in human body fluids,and disappear spontaneously after human bone have completely healed[1].Over the past two decades,Mg-based implants have attracted wide attention on bone tissue engineering due to their unique biodegradability,suitable mechanical properties and excellent biocompatibility[2].
However,Mg-based implants corrode too fast when they contact abundant chloride ion in human body environment,and excessive corrosion rates cause strength loss before the bone tissue heal completely[3].Besides,the released hydrogen bubbles and the increase pH values around Mg-based implants result in bone cell death and bone tissue inflammation[4].The poor corrosion resistance limits their practical applications,and it is mainly associated with the following two aspects:(1)Pure Mg has a highly negative standard electrode potential of−2.34V and Mg(OH)2product layer is easily to be formed in aqueous electrolytes[5].However,P/B ratio of Mg(OH)2layer is beyond 1,and the layer cannot effectively prevent the magnesium matrix from contacting the aggressive ion,such as chloride ion[6].(2)Magnesium alloys and magnesium composites are susceptible to micro-galvanic corrosion due to the electrochemical heterogeneity of their microstructure,in which grain boundaries and second phases play important roles[7,8].
Powder metallurgy is a promising method to decrease corrosion rates of Mg-based implant and result in an uniform corrosion attack in cell solution by adding calcium-based bioceramic,such as HA andβ-TCP particles,for preparing Mgbased composites[9].Biodegradable behavior of Mg-based composites prepared by powder metallurgy is decided by not only reinforcement but also Mg alloy matrix,which all have important roles to play[10].Therefore,it is necessary to design and prepare an idea magnesium alloy matrix,on which is lack of research,for the future Mg-based implant.
Inspired by the review of Cao[11]and the study of Song[12],the“stainless steel”Mg alloys could be developed,if their microstructure was able to form passive and corrosion resistant film in aqueous solutions.It is important to modify the microstructure of Mg alloy matrix through metallurgical techniques and propose some possible approaches to the production of the protective corrosion product layer.
In our previous studies[13],the as-extruded Mg-6wt.%Zn alloy revealed suitable mechanical properties and a lower in vitro degradation rate,because the litter Zn caused lower bulk MgZn phases which induced the lighter galvanic corrosion.The accumulation of Zn bulk reduced,few fine intermetallic phases precipitated,and the densification of the corrosion product layer improved by the aging treatment.However,the investigation on biodegradation behavior and corrosion mechanism of Mg-Zn matrix were not detailed enough.So we lightly further reduced Zn concentration to 5wt.% and extended aging time to 96h in this study.
Therefore,further research on relationship between microstructure and degradable properties is need to figure out the key microstructure characteristic of improving corrosion resistance for discussing the ideal model of Mg alloy matrix with much more corrosion resistance.Consequently,we selected hot extrusion and aging treatment to modify microstructure of powder metallurgy Mg-Zn alloys.The forming,change and protection of corrosion product layers on different immersion period were also studied for estimating of their biodegradation behavior,and their corrosion mechanism was discussed.In addition,the cytotoxicity test was also processed to evaluate if the alloys can meet the requirement of cell toxicity.

Table 1The abbreviation of different state Mg-Zn alloys.
2.Materials and methods
2.1.Material preparation
Various designed Mg-5%Zn alloys(wt.%)were manufactured with the technology of powder metallurgy.The raw materials in this experiment were Mg and Zn powders with average diameters around 42.0μm and purity over 99.95%.The Mg and Zn powders were mixed for 6h in a vacuum environment.After finishing the mixing process,the powders were cold pressed into billets and sintered at 545 °C±5 °C for 3h with argon protection.Then,the sintered samples were preheated at 350 °C for 1.5h and extruded into bars at the same temperature with an extrusion ratio of 15:1.Finally,the extruded bars were aged at 150 °C for 24h and 96h respectively.The shortening of different state Mg-Zn alloys as shown in Table 1.Each state had three parallel samples and the corresponding results were the average values of parallel samples.
2.2.Microstructure and composition characterization
The metallographic microstructure was observed with Polyvar-MET metallographic microscope.The metallography samples were ground with 1000 grit paper,polished with 1mm diamond paste and then etched with the solution(1g oxalic acid,1ml nitric acid,1ml acetic acid and 150ml distilled water).The optical micrographs were measured by Leica Application Suite.The microstructure of different samples was observed by SEM(Quanta-200)and EDS.The phase of the samples and corrosion products were identified by XRD(DMAX-2500X)using CuKαradiation with a wavelength of 1.5406
2.3.Immersion tests
The immersed samples with 10mm diameter and 10mm length and samples needed to be ground with 1200 grid SiC sandpaper and washed with ethanol before immersing.The chloride ion is the major aggressive ion in human body fluid[14].In order to decrease the influence of other cationic anions and highlight the influence of chloride ion,Ringer’s solution was chosen in this experiment to investigate the corrosion product layers of samples.
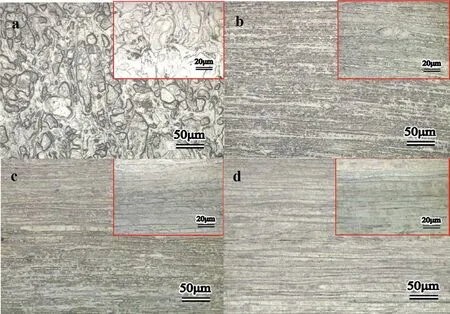
Fig.1.Microstructure of the Mg-Zn alloys at longitudinal direction:(a)S,(b)ES,(c)AES1 and(d)AES2.
The samples were immersed in Ringer’s solution at 37±0.2 °C and the temperature was maintained by an HTW-10B water bath.The ratio of the solution volume to sample surface area was 20ml/cm2[15].In order to simulate the human body liquid environment,the pH value of Ringer’s solution was adjusted to 7.4 before immersing and the change of pH values during the test were measured and recorded by PHSCAN10 pH sensor.The samples after immersing were cleaned by distilled water and then dried,and the medium was not refreshed during the test.The weight change was calculated through weight change of samples before and after immersion.The weight loss was calculated through weight change between samples before immersing and samples after removing corrosion products.The corrosion products were removed by a boiling 20% chromic acid+1% AgNO3solution and then washed samples with absolute ethanol to clean[16].
2.4.Electrochemical tests
The working area of electrochemical samples was 1 cm2and the surface of samples were ground with 1000 grid SiC sandpaper and washed by ethanol solution before using.The electrochemical test was carried on a beaker,which contain Ringer’s solution and a standard three-electrode configuration(platinum mesh as counter,saturated calomel as reference and the alloy as working electrode),with a CHI660E potentiostat/galvanostat system at 37±0.2 °C.The open circuit potential was measured when the potential was stable and polarization curve scanned at a rate of 1mV/s in a fixed value from−1.2V to−1.9V.The results of corrosion potential(Ecorr),corrosion current density(Icorr)and polarization resistant(Rp)of Mg–5%Zn alloys in different state were calculated through the method of Tafel extrapolation[17,18].
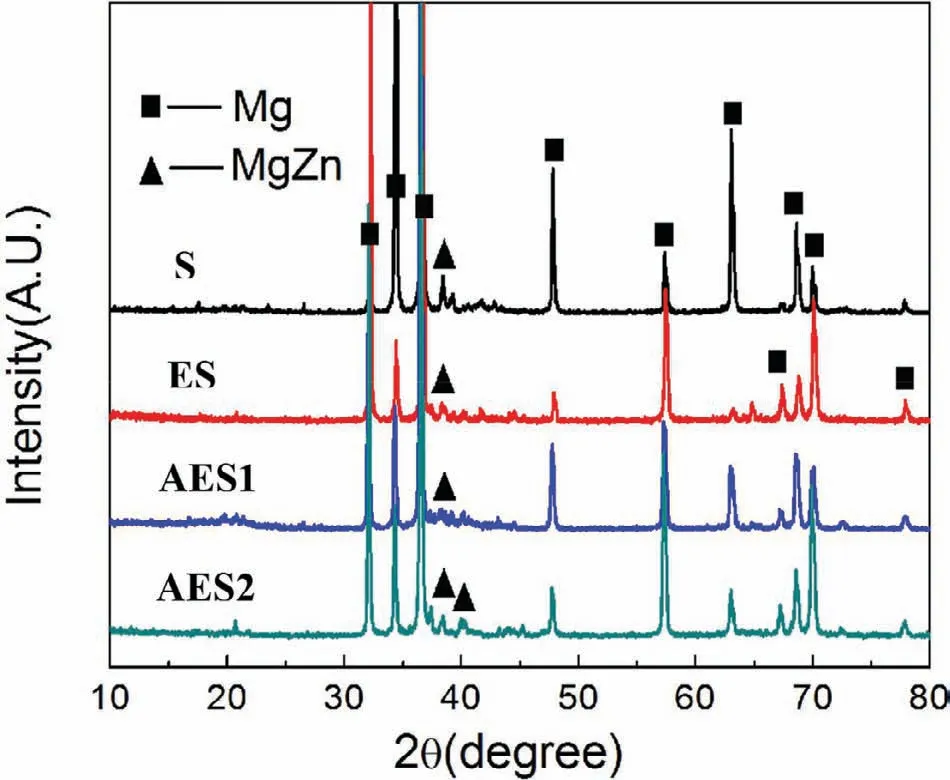
Fig.2.XRD patterns of the Mg-Zn alloys.

Table 2Electrochemical parameters obtained from potentiodynamic polarization curves.
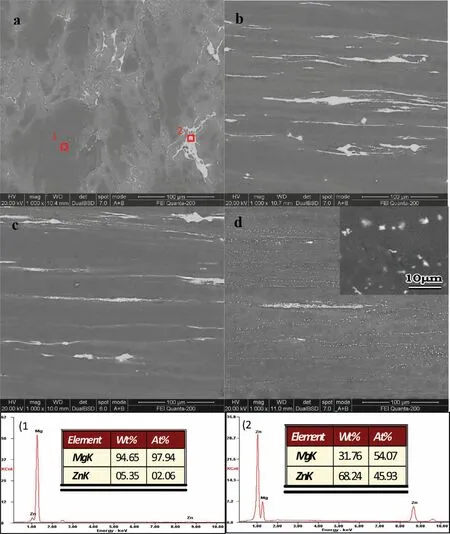
Fig.3.SEM and EDS images of Mg-Zn alloys:(a)S,(b)ES,(c)AES1 and(d)AES2.
Electrochemical impedance spectroscopy(EIS)analysis was tested at open circuit potential with a perturbing signal of 10mV.The frequency of EIS test changed from 100,000 to 0.01Hz.All these results were fitted and analyzed by ZSimpWin 3.20 software.The polarization curve and electrochemical impedance spectroscopy of samples soaked 0h,6h,24h and 72h were measured.
2.5.Cytocompatibility test
The cytotoxicity of Mg-5%Zn alloy imparted by hot extrusion and aging treatment for 96h was measured with the standard ISO 10993-5:1999.The indirect contact testing and corresponding method referenced our previous research[13].
3.Results and discussion
3.1.Microstructure of Mg-Zn alloy
Fig.1 showed metallographic microstructure of Mg-5%Zn alloys.It was observed that S(Fig.1(a))was composed of irregular coarse grains and some micropores(black pots)existing around grain boundaries.The volume shrinkage of micropores was generated by different diffusion rates of metal elements during sintering[19].After hot extrusion,ES(Fig.1(b))exhibited significant fine and elongated grains distributing along extrusion direction due to partial dynamic recrystallization[20].Compared ES,the grain size of AES1 and AES2 increased slightly with aging time prolonging and grain boundaries showed much clearer.
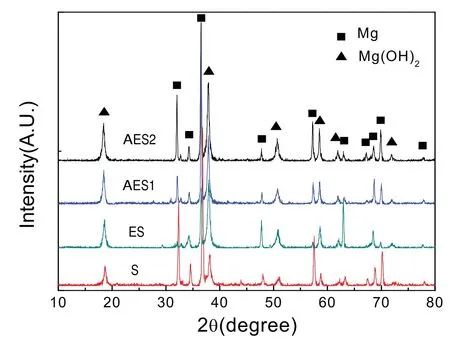
Fig.4.XRD patterns of corrosion products of Mg-Zn alloys after 72h of immersion.
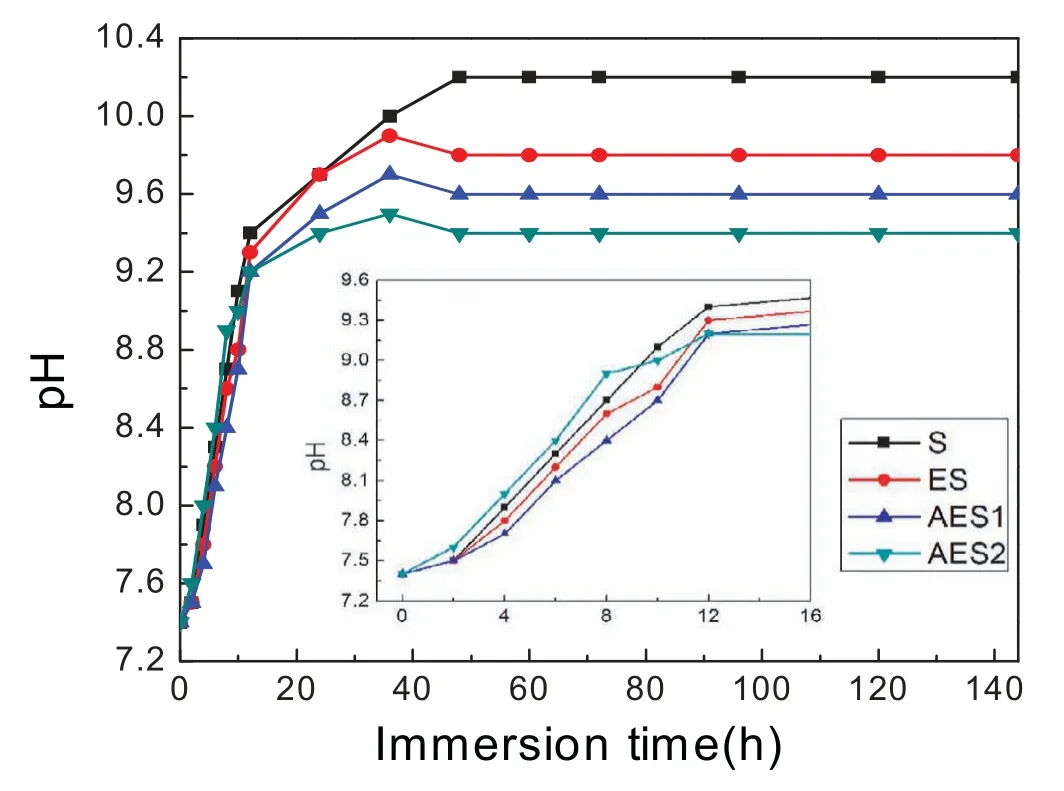
Fig.5.pH value variation of the Mg-Zn alloys with immersion time prolong.
3.2.XRD patterns of Mg-Zn alloys
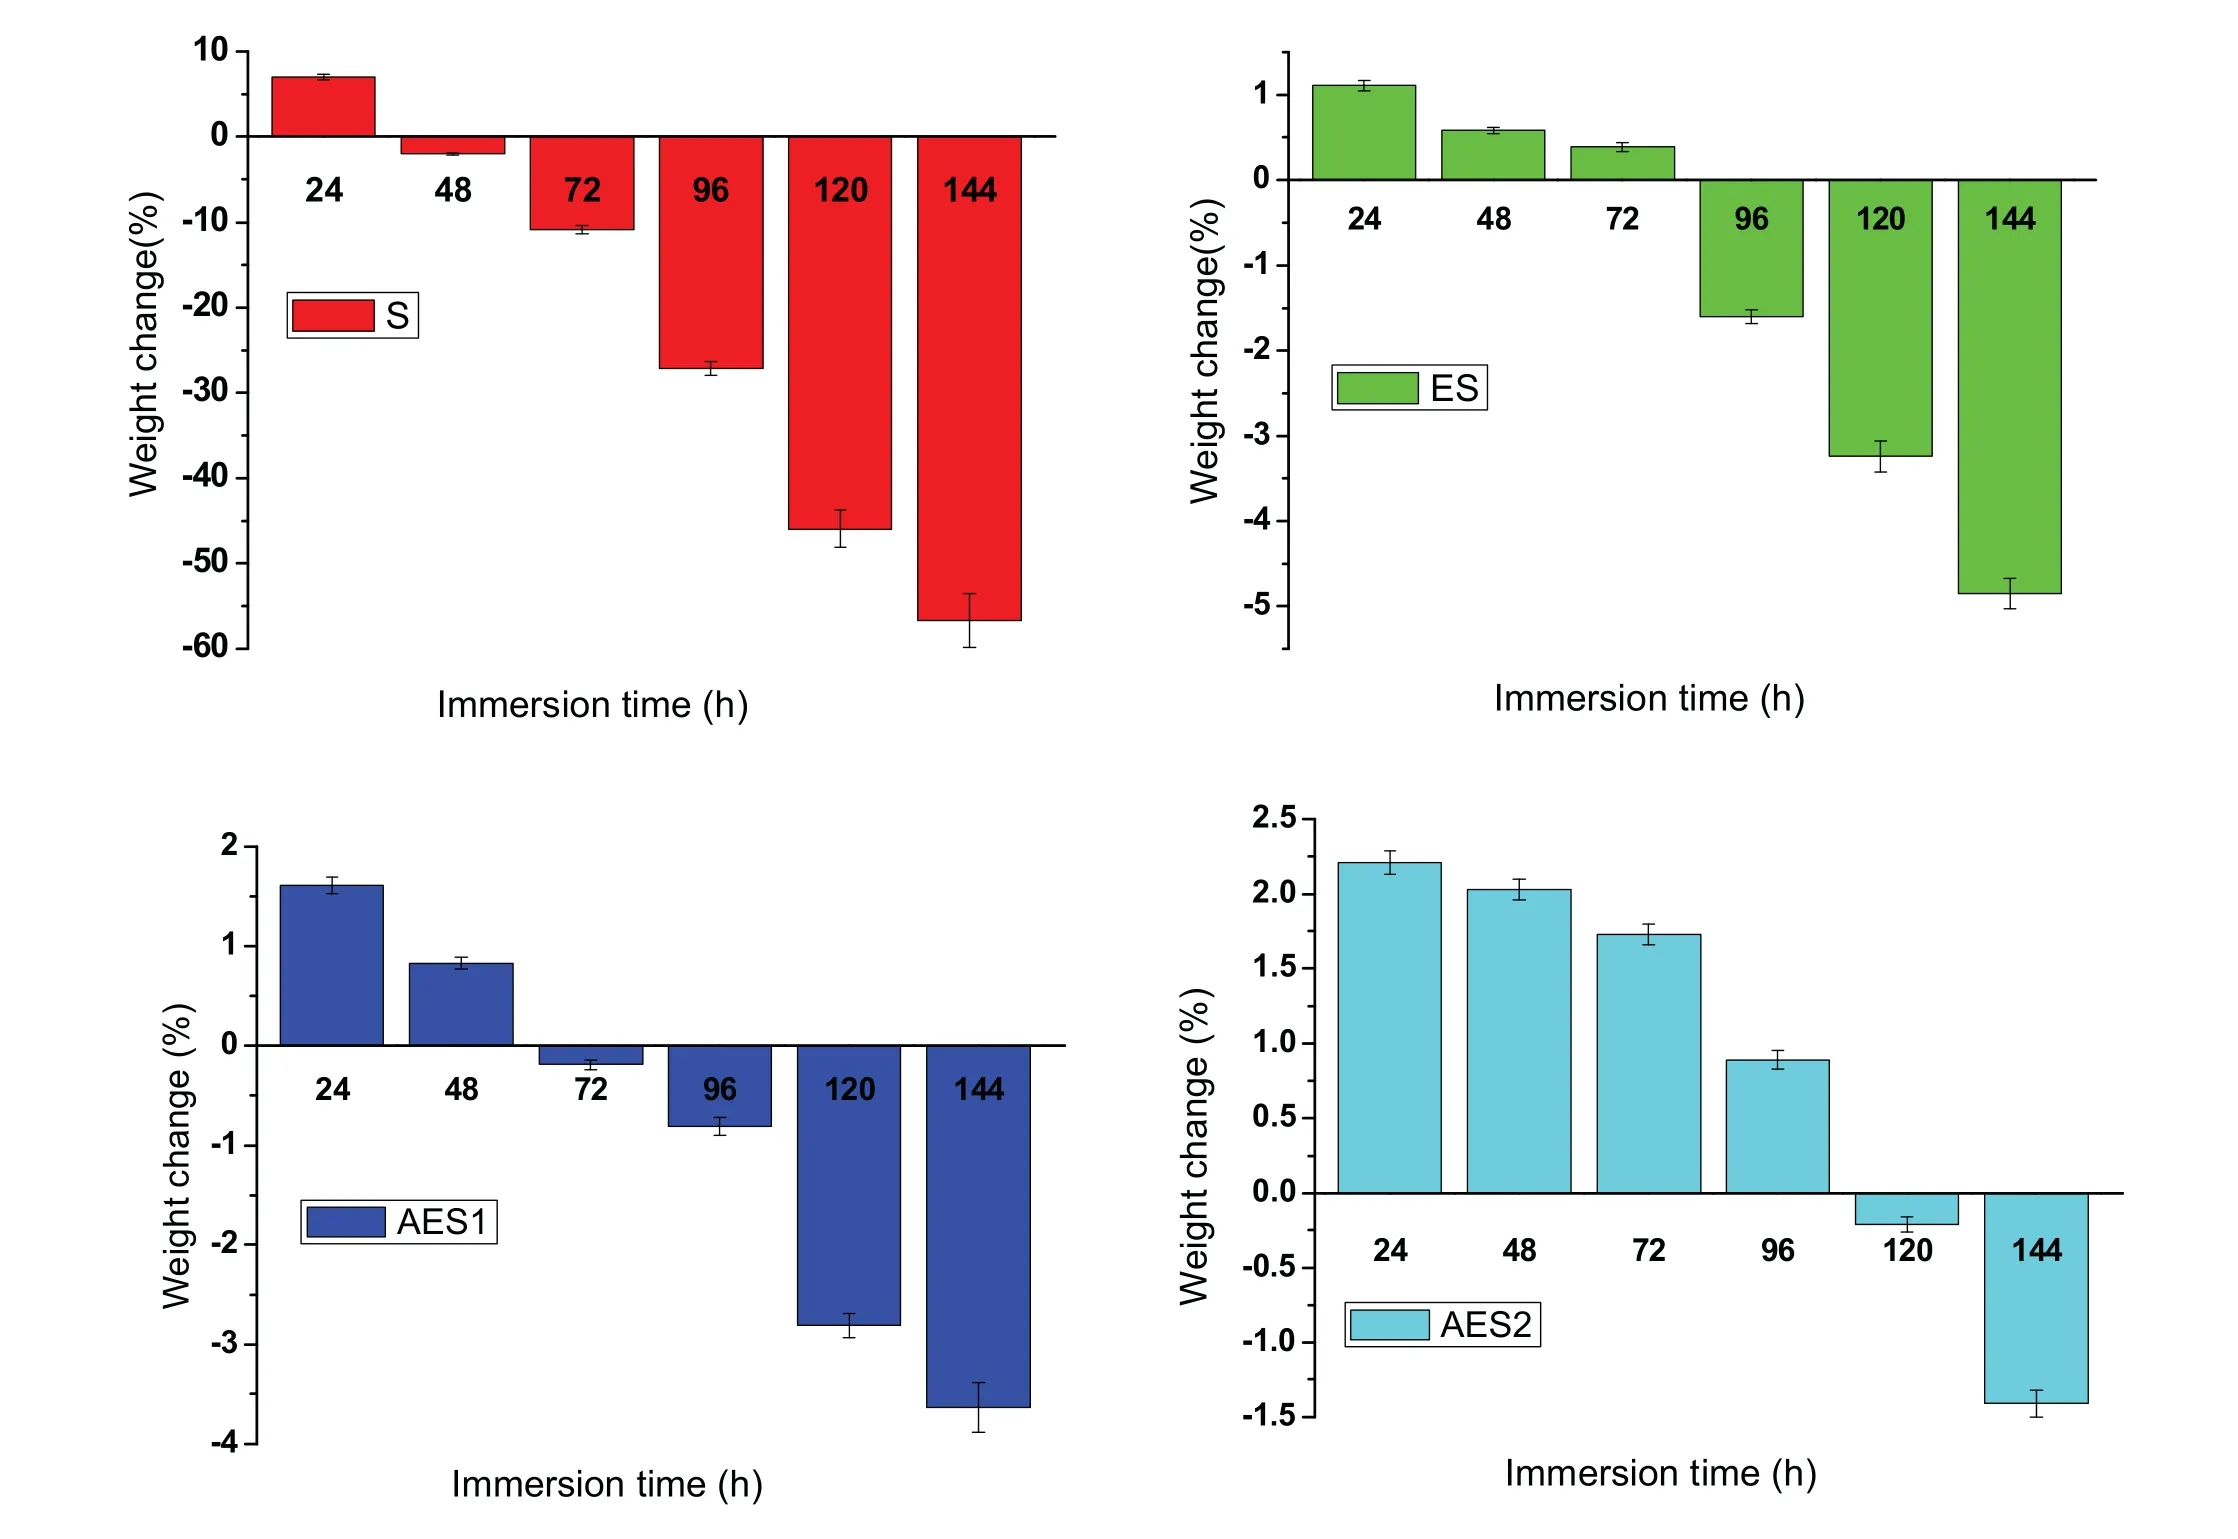
Fig.6.Weight change of Mg-Zn alloys with immersion time prolong.
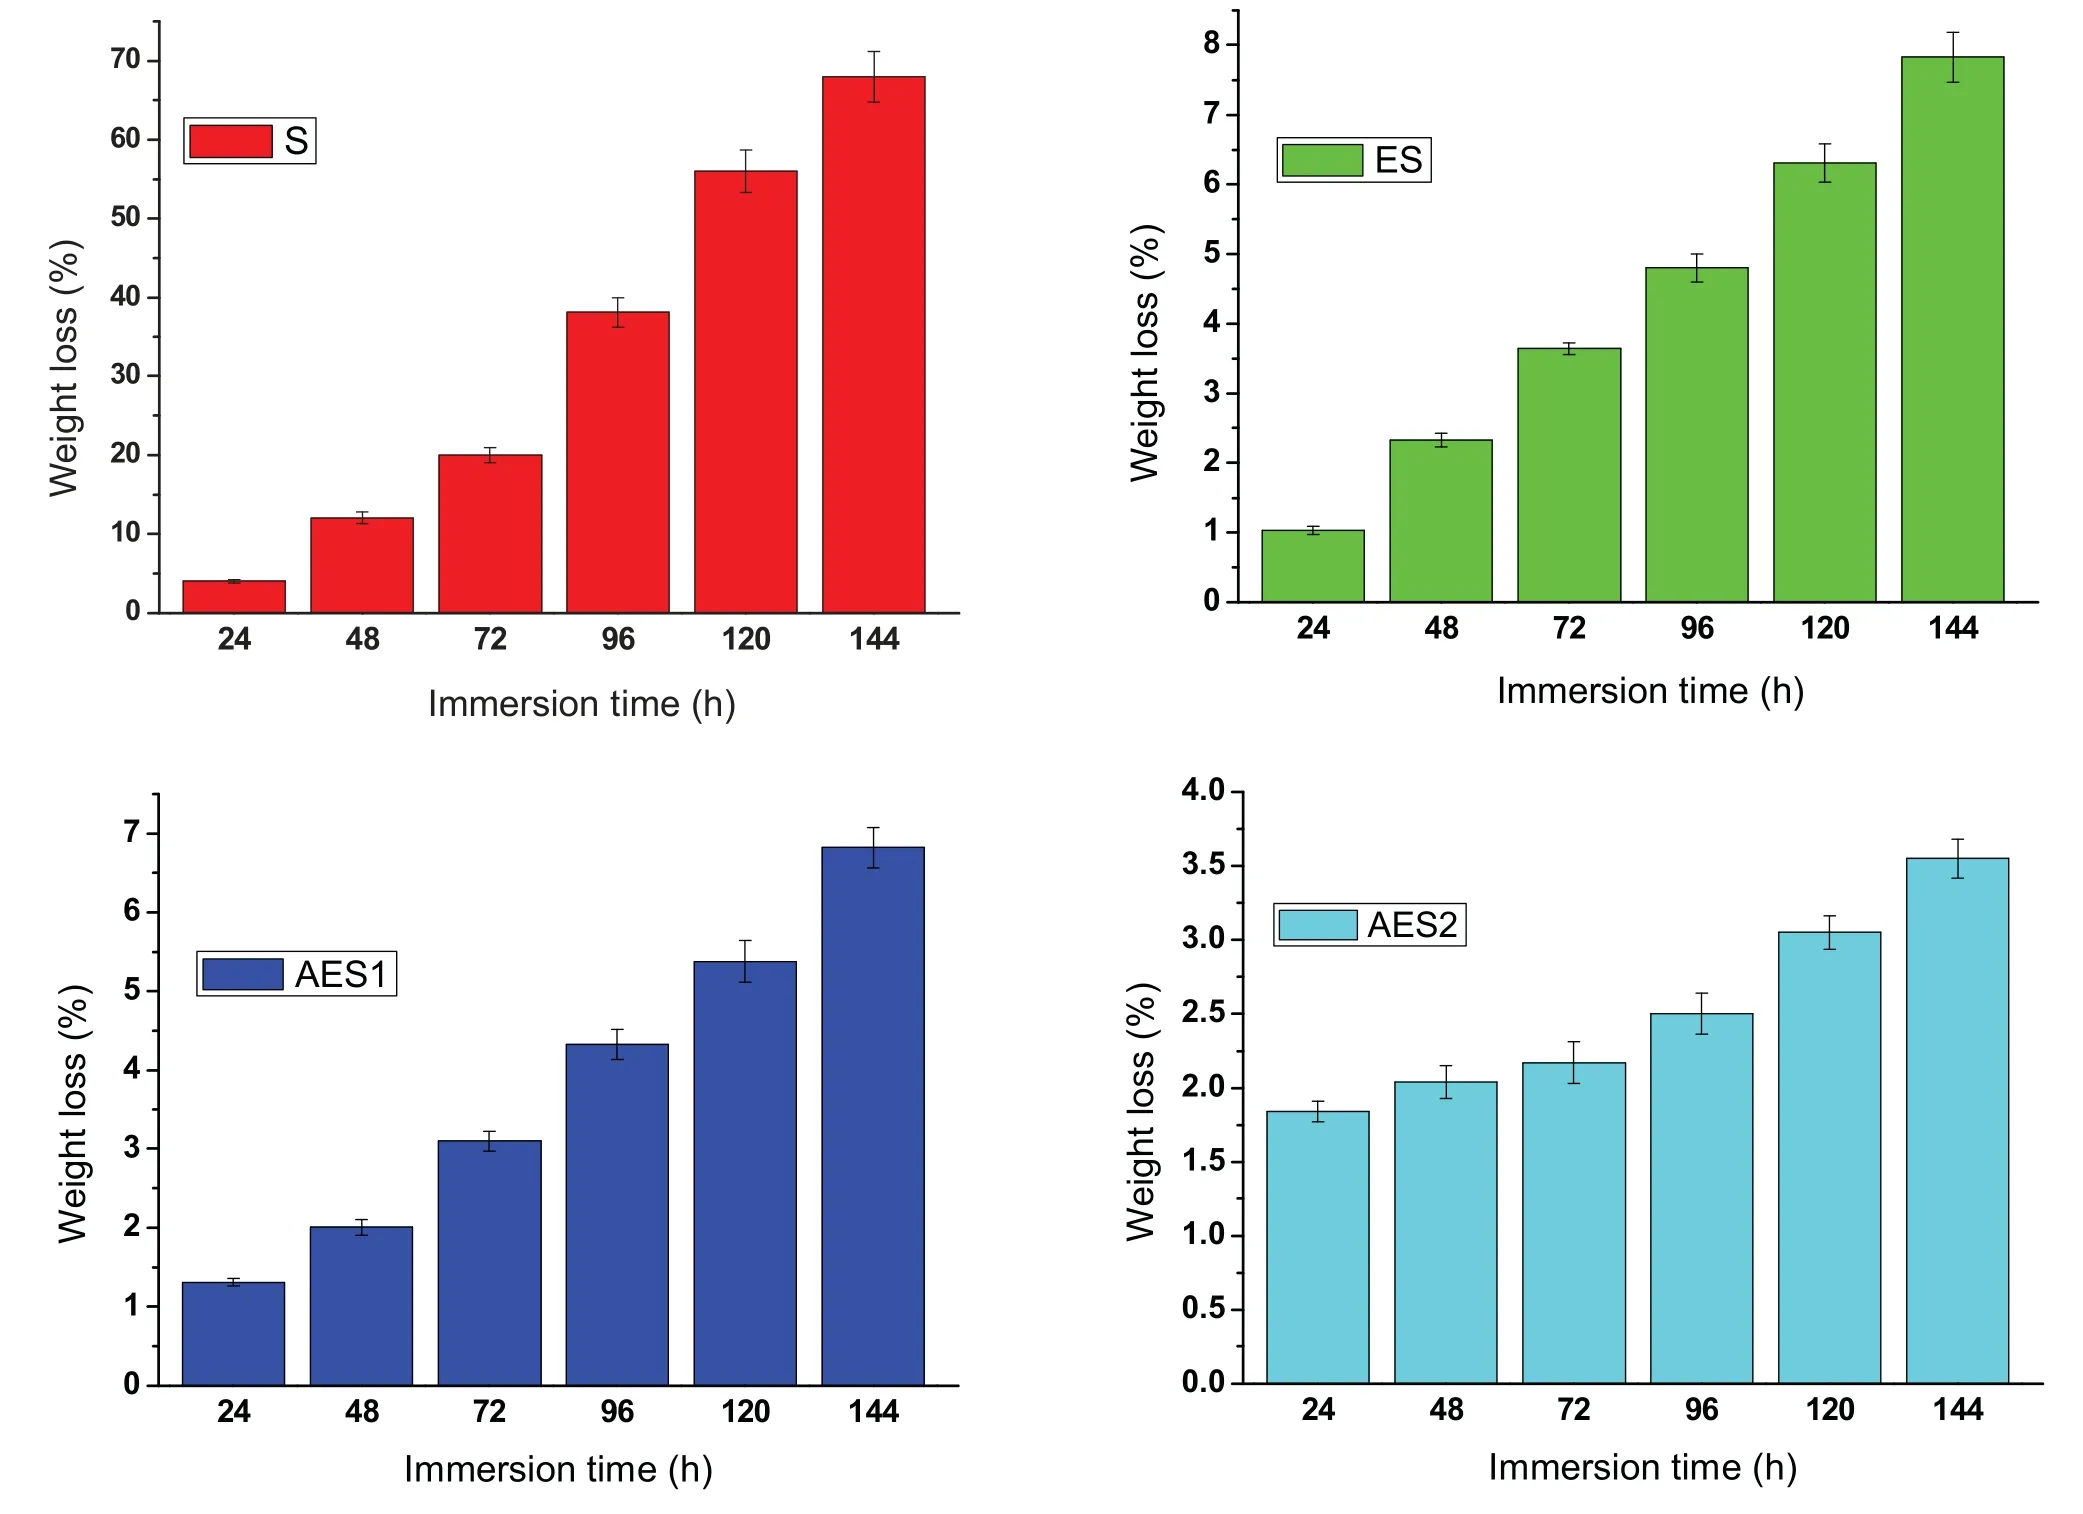
Fig.7.Weight loss of Mg-Zn alloys with immersion time prolong.
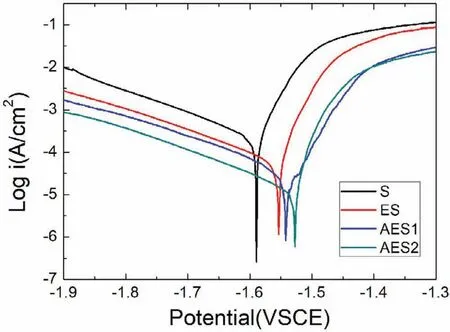
Fig.8.Potentiodynamic polarization curves of Mg-Zn alloys.
Fig.2 showed X-ray diffraction of Mg-5%Zn alloys.According to Mg-Zn binary alloy phase diagrams[21],Maxsolubility of Zn in Mg matrix at room temperature is only 1.6wt.% and when addition of Zn exceeded 1.6wt.%,more second phases are formed.It revealed that the Mg-5%Zn alloys were composed byα-Mg and MgZn.After hot extrusion,diffraction intensities of MgZn phase were reduced.Because some MgZn phase could be formed by rapidly solidification during sintering process and it could be eliminated by hot extrusion.Besides,MgZn phase in AES2 was more obliviously higher intensities than that in ES and AES1.It is because
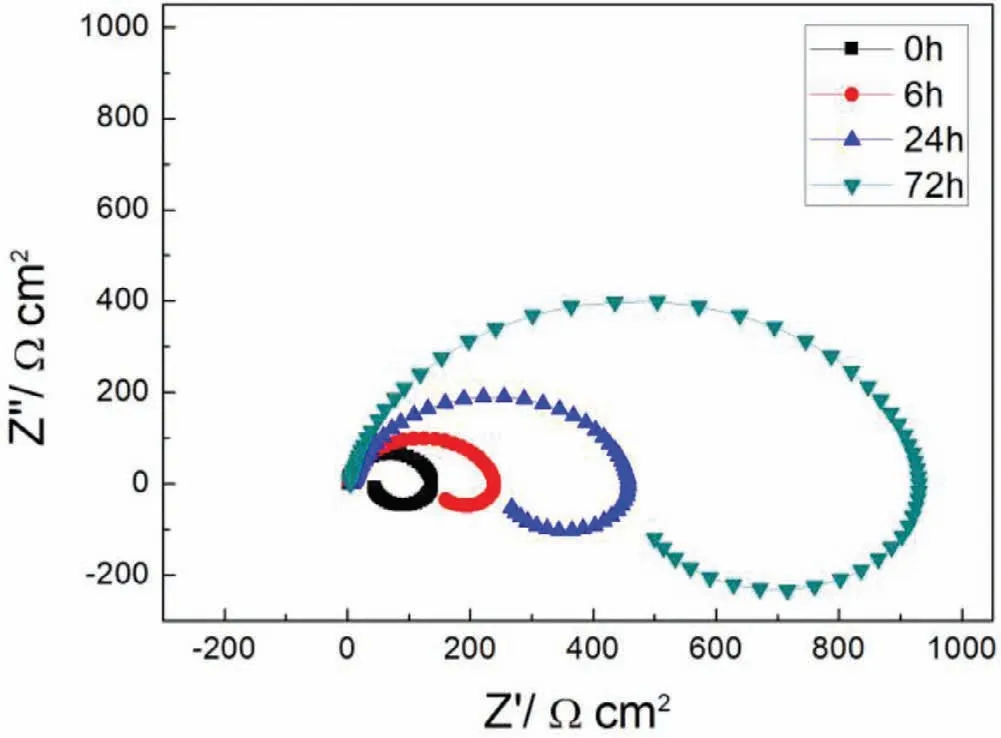
Fig.9.EIS plots of S with immersion time prolong.
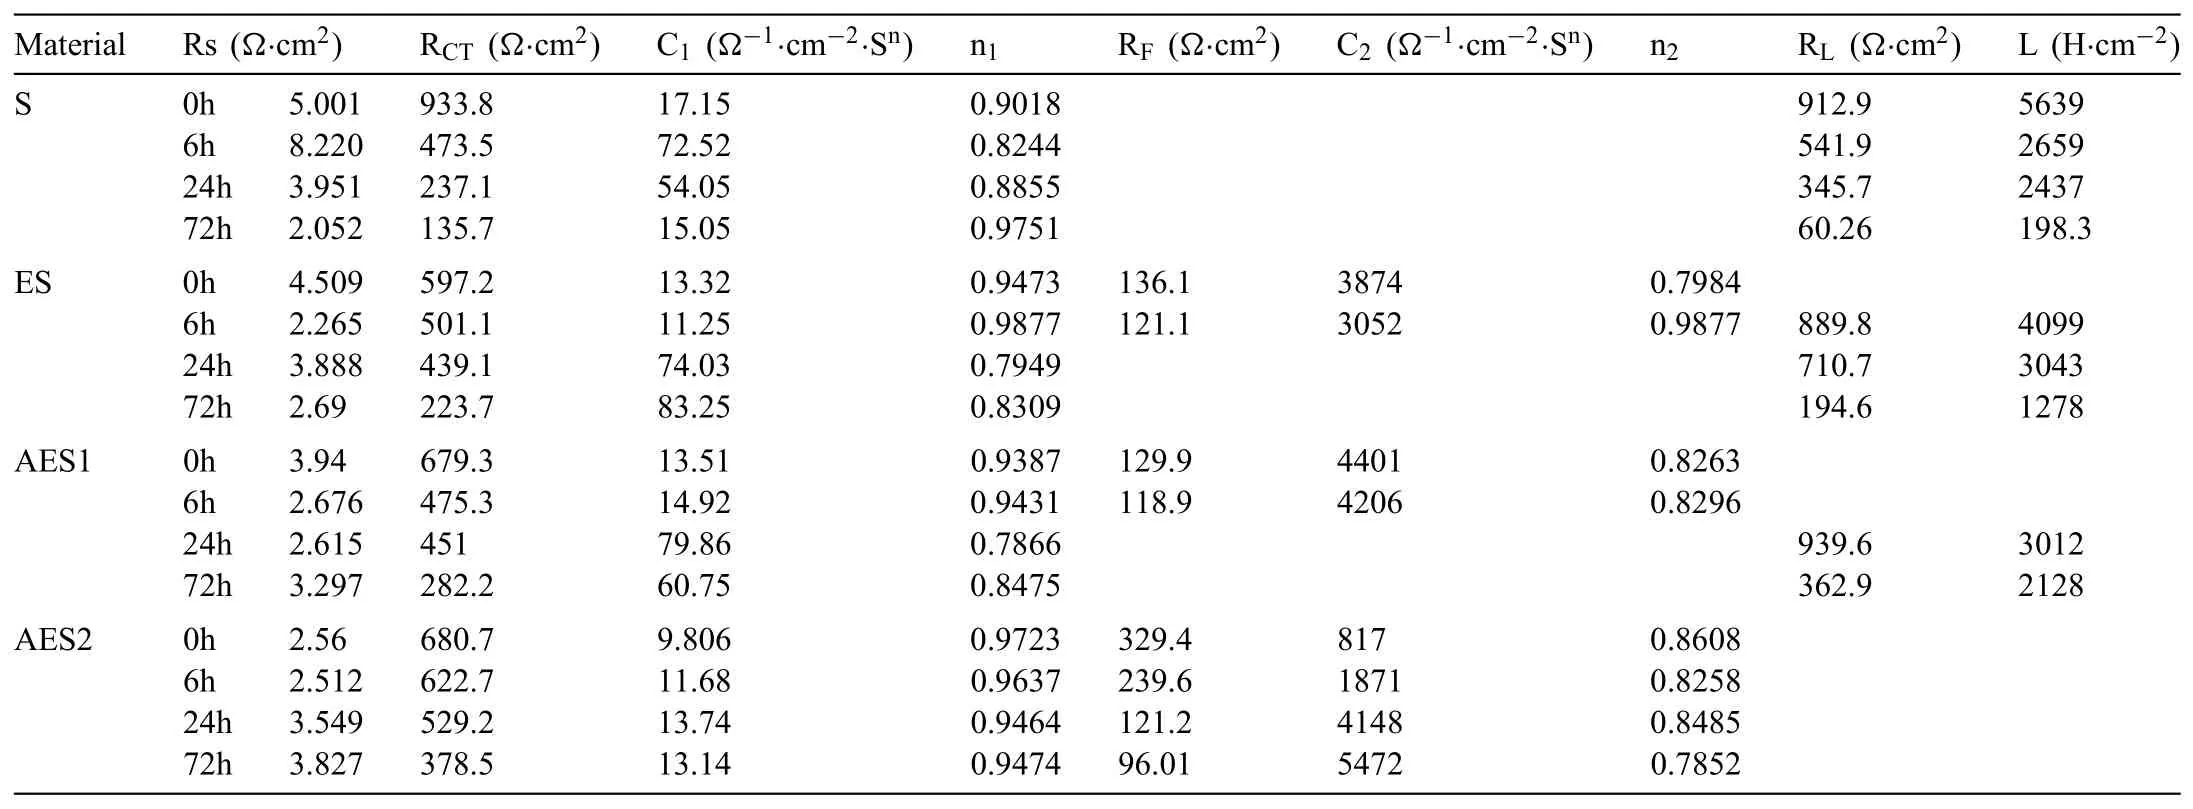
Table 3Electrochemical parameters from the electrochemical impedance spectroscopy.
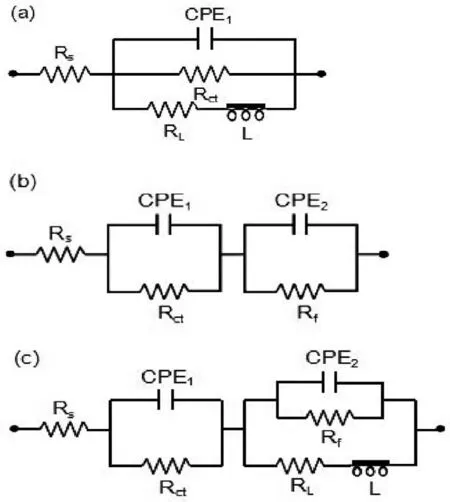
Fig.10.Equivalent circuits of Mg-Zn alloys.
when aging treatment was over 110 °C,Mg-Zn binary phases could not form a G.P.zone but happen to the following precipitation order:α-Mg→MgZn2→MgZn[22].
3.3.SEM analysis of Mg-Zn alloys
Fig.3 showed SEM and EDS images of Mg-5%Zn alloys.In S(Fig.3(a)),the coarse second phases distributed adhere to grain boundaries and formed network.The chemical composition of point 1(Fig.3e)identified by EDS analysis was attributed toα-Mg with little Zn.Meanwhile,the second phases were also identified by EDS analysis,and the Mg/Zn atomic ratios of point 2 was about 1:1,likely attributing to MgZn phase.In ES(Fig.3(b)),the coarse second phases were crushed by hot extrusion and the strike-like MgZn phases were distributed along extrusion direction.As Fig.3(c)shown,some strike-like MgZn phases of AES1 was reduced during aging treatment and few fine MgZn phases were precipitated.In AES2(Fig.3(d)),majority of the strike-like MgZn phases were disappeared and plenty of fine MgZn phases presented the homogeneous distribution.
3.4.Immersion tests of Mg-Zn alloys
Fig.4 presented XRD results of corrosion product of Mg-5%Zn alloys immersed in Ringer’s solution for 72h.The XRD results identified the Mg(OH)2peaks and their intensities in AES2 were much higher.
The Mg-5%Zn alloys were degraded to release H2and formed Mg(OH)2in Ringer’s solution according to Eq.(1)[23].

Fig.5 presented pH curve of Ringer’s solution with immersion time prolong.The pH value increase was mainly because of generation of OH−and,lower slope meant slower corrosion rate[24].The pH value of Mg-5%Zn alloys rose rapidly at initial 16h,and increased much slowly and finally showed different stable value.The increasing pH value could promote more Mg(OH)2adhered on the surface,which restricted reaction of Mg2+and OH−[25].However,the chloride ions of Ringer’s solution could break Mg(OH)2layer[26].
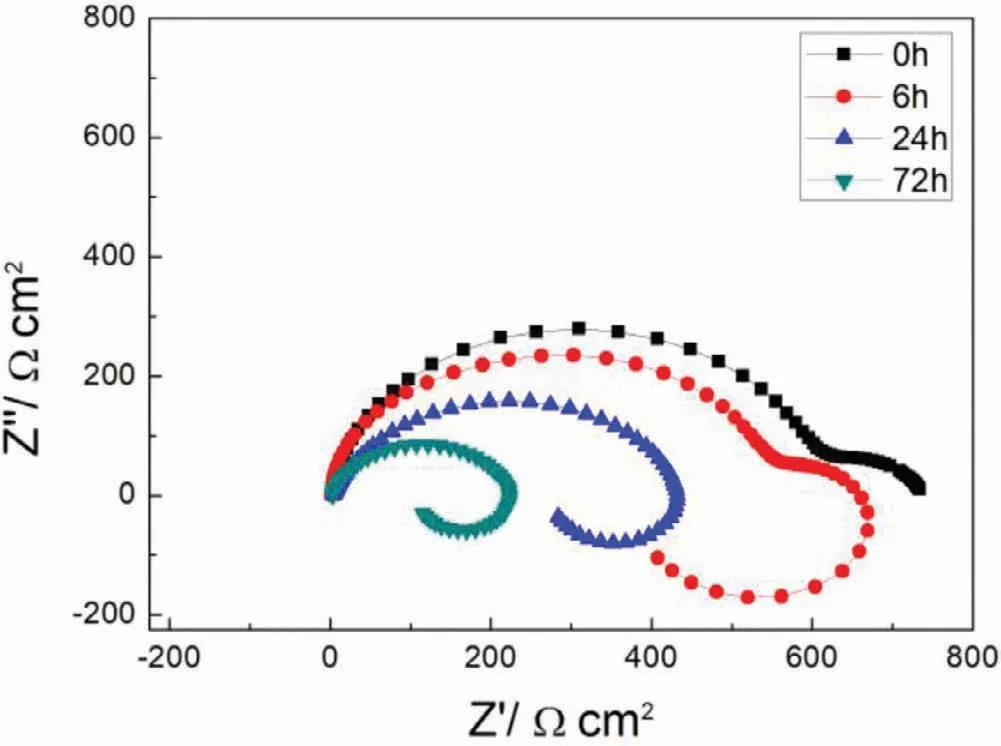
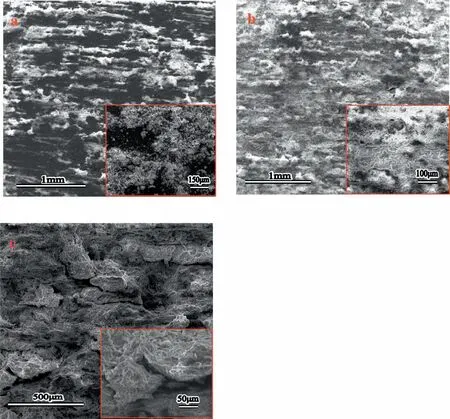
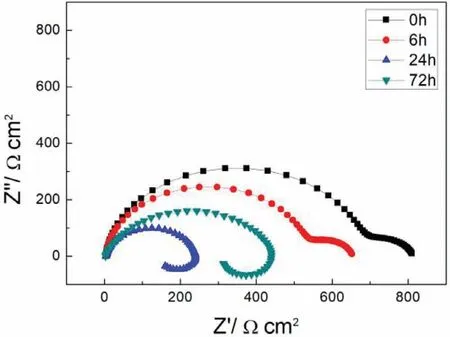
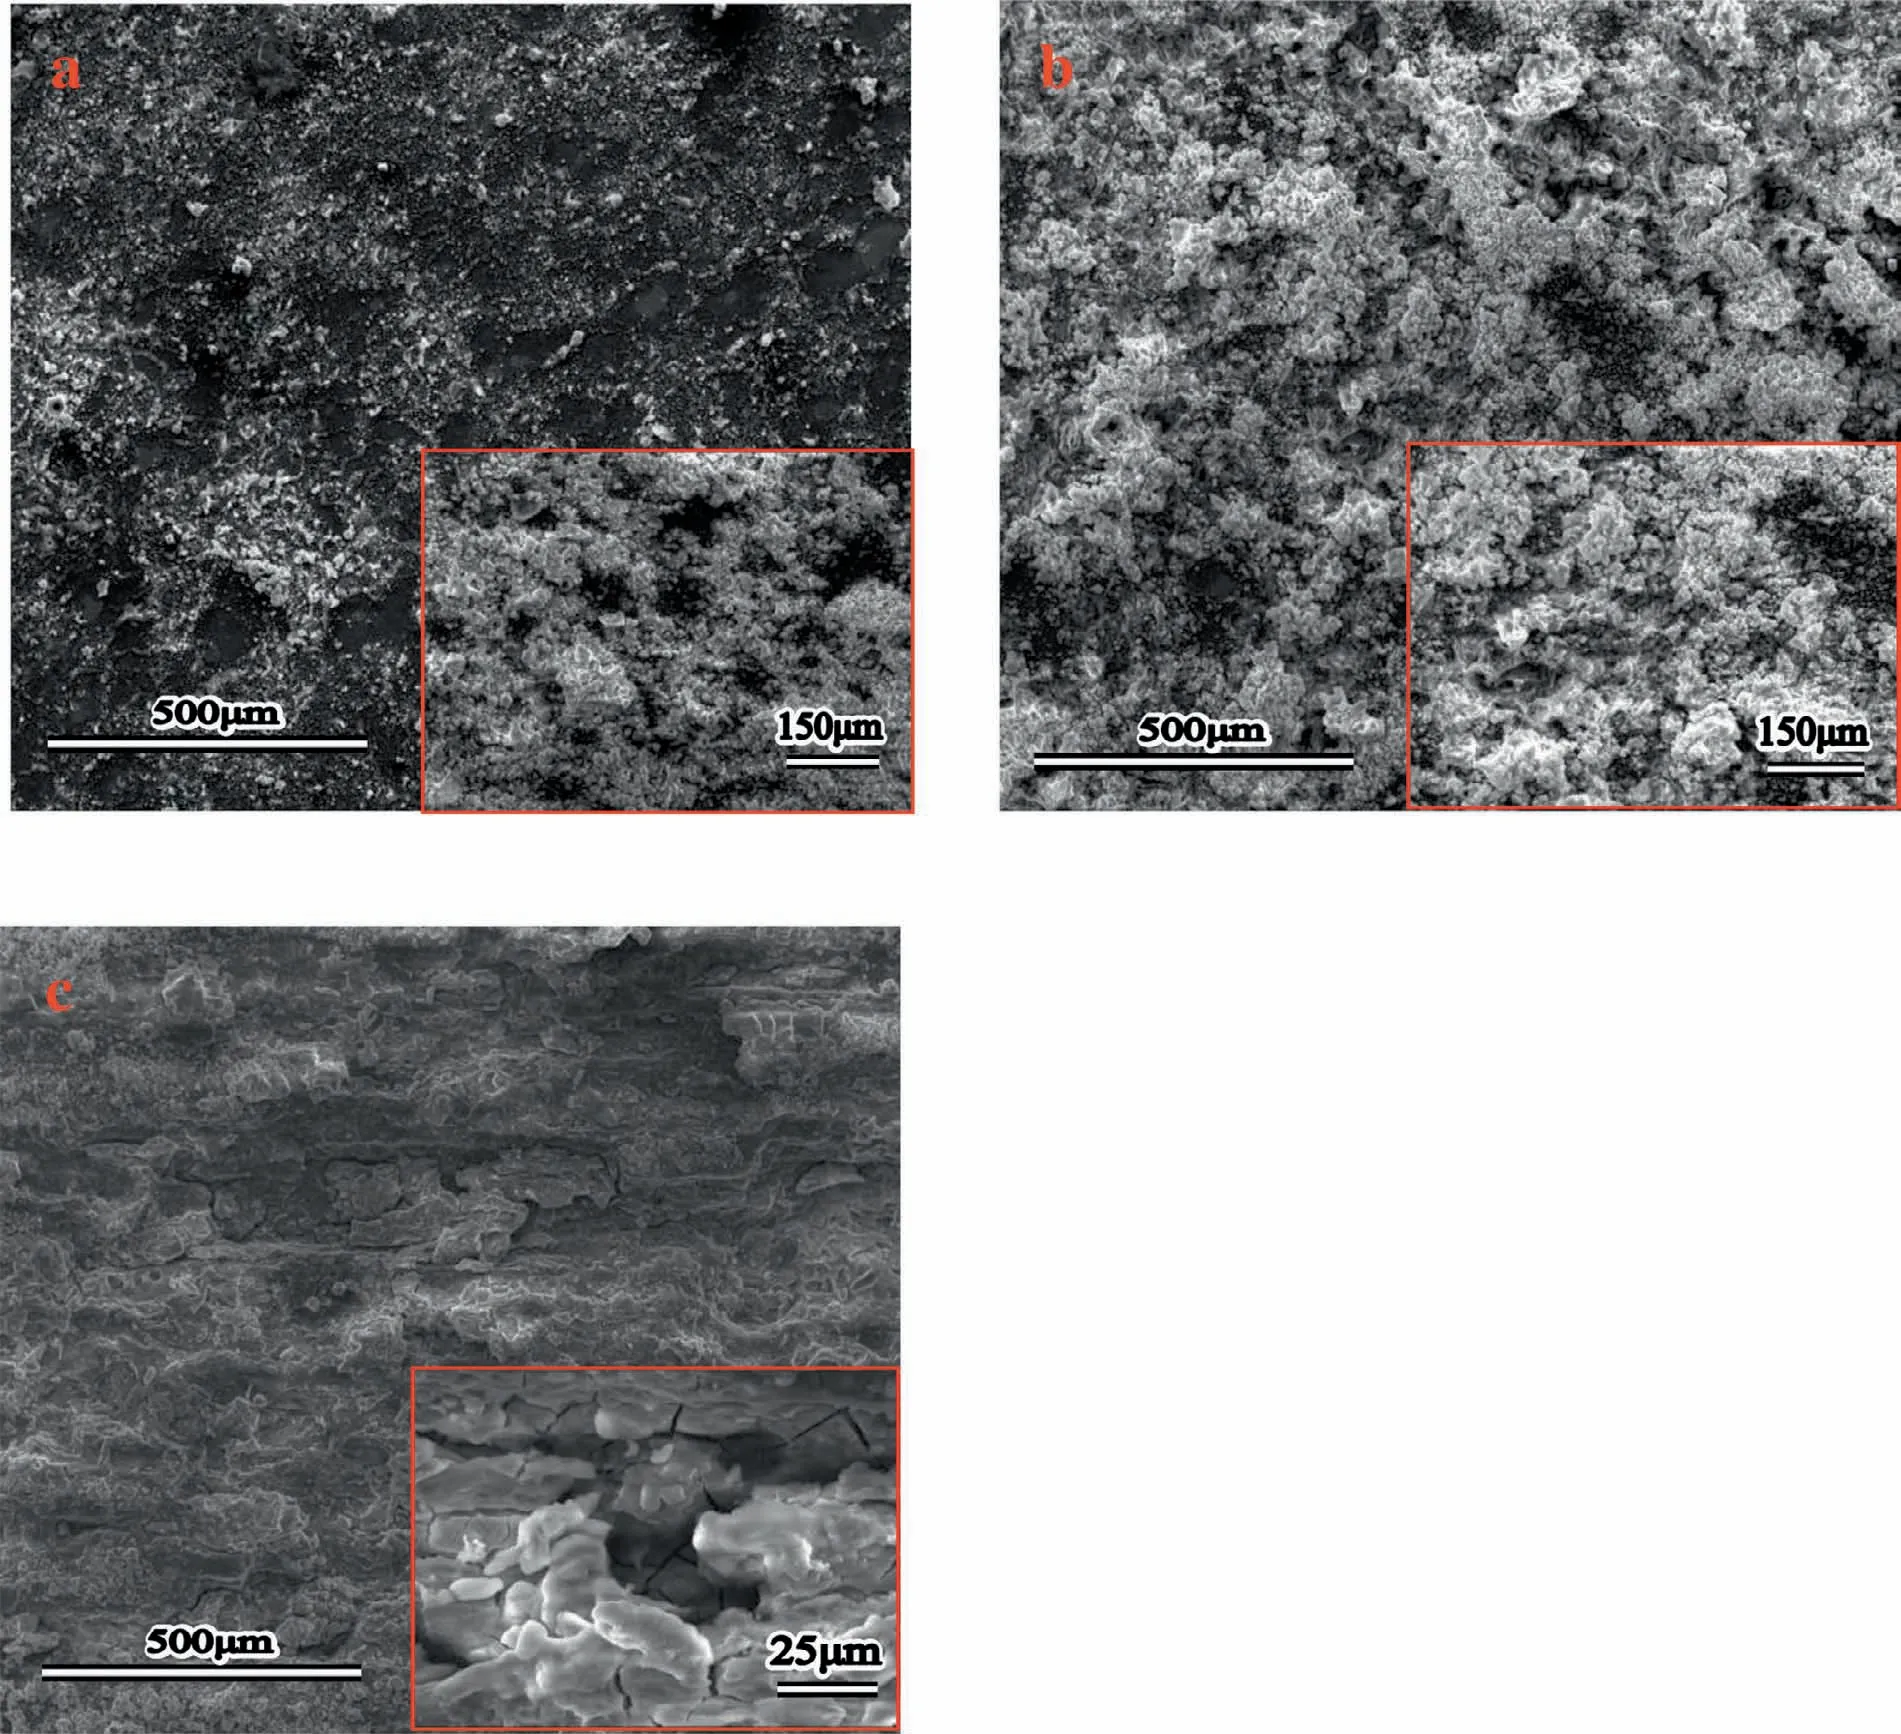
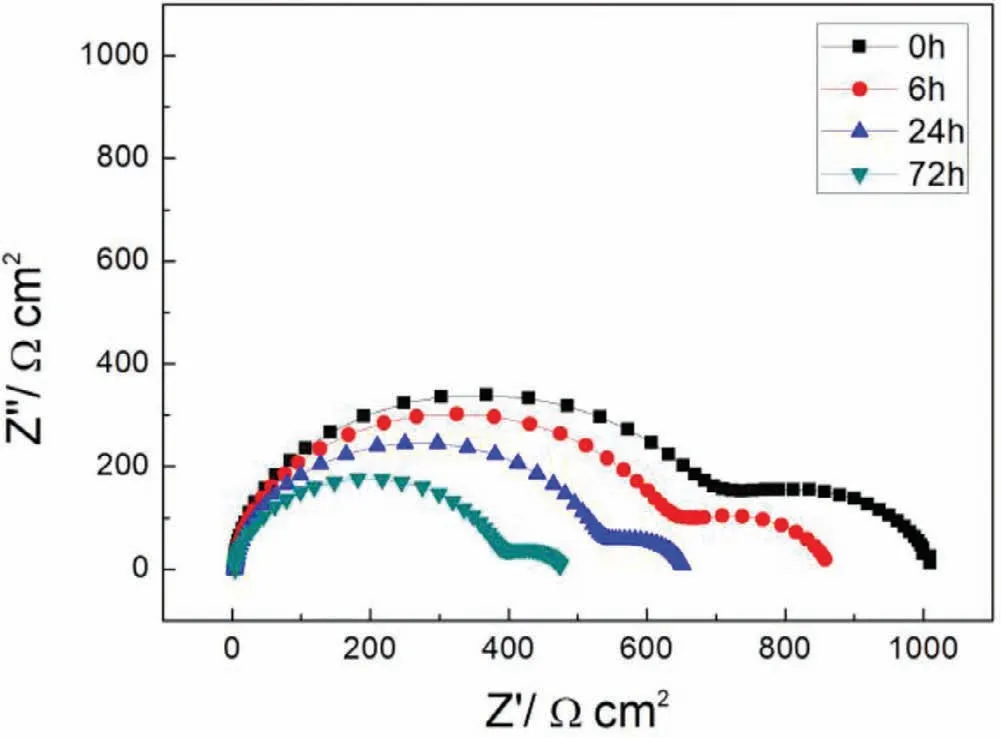
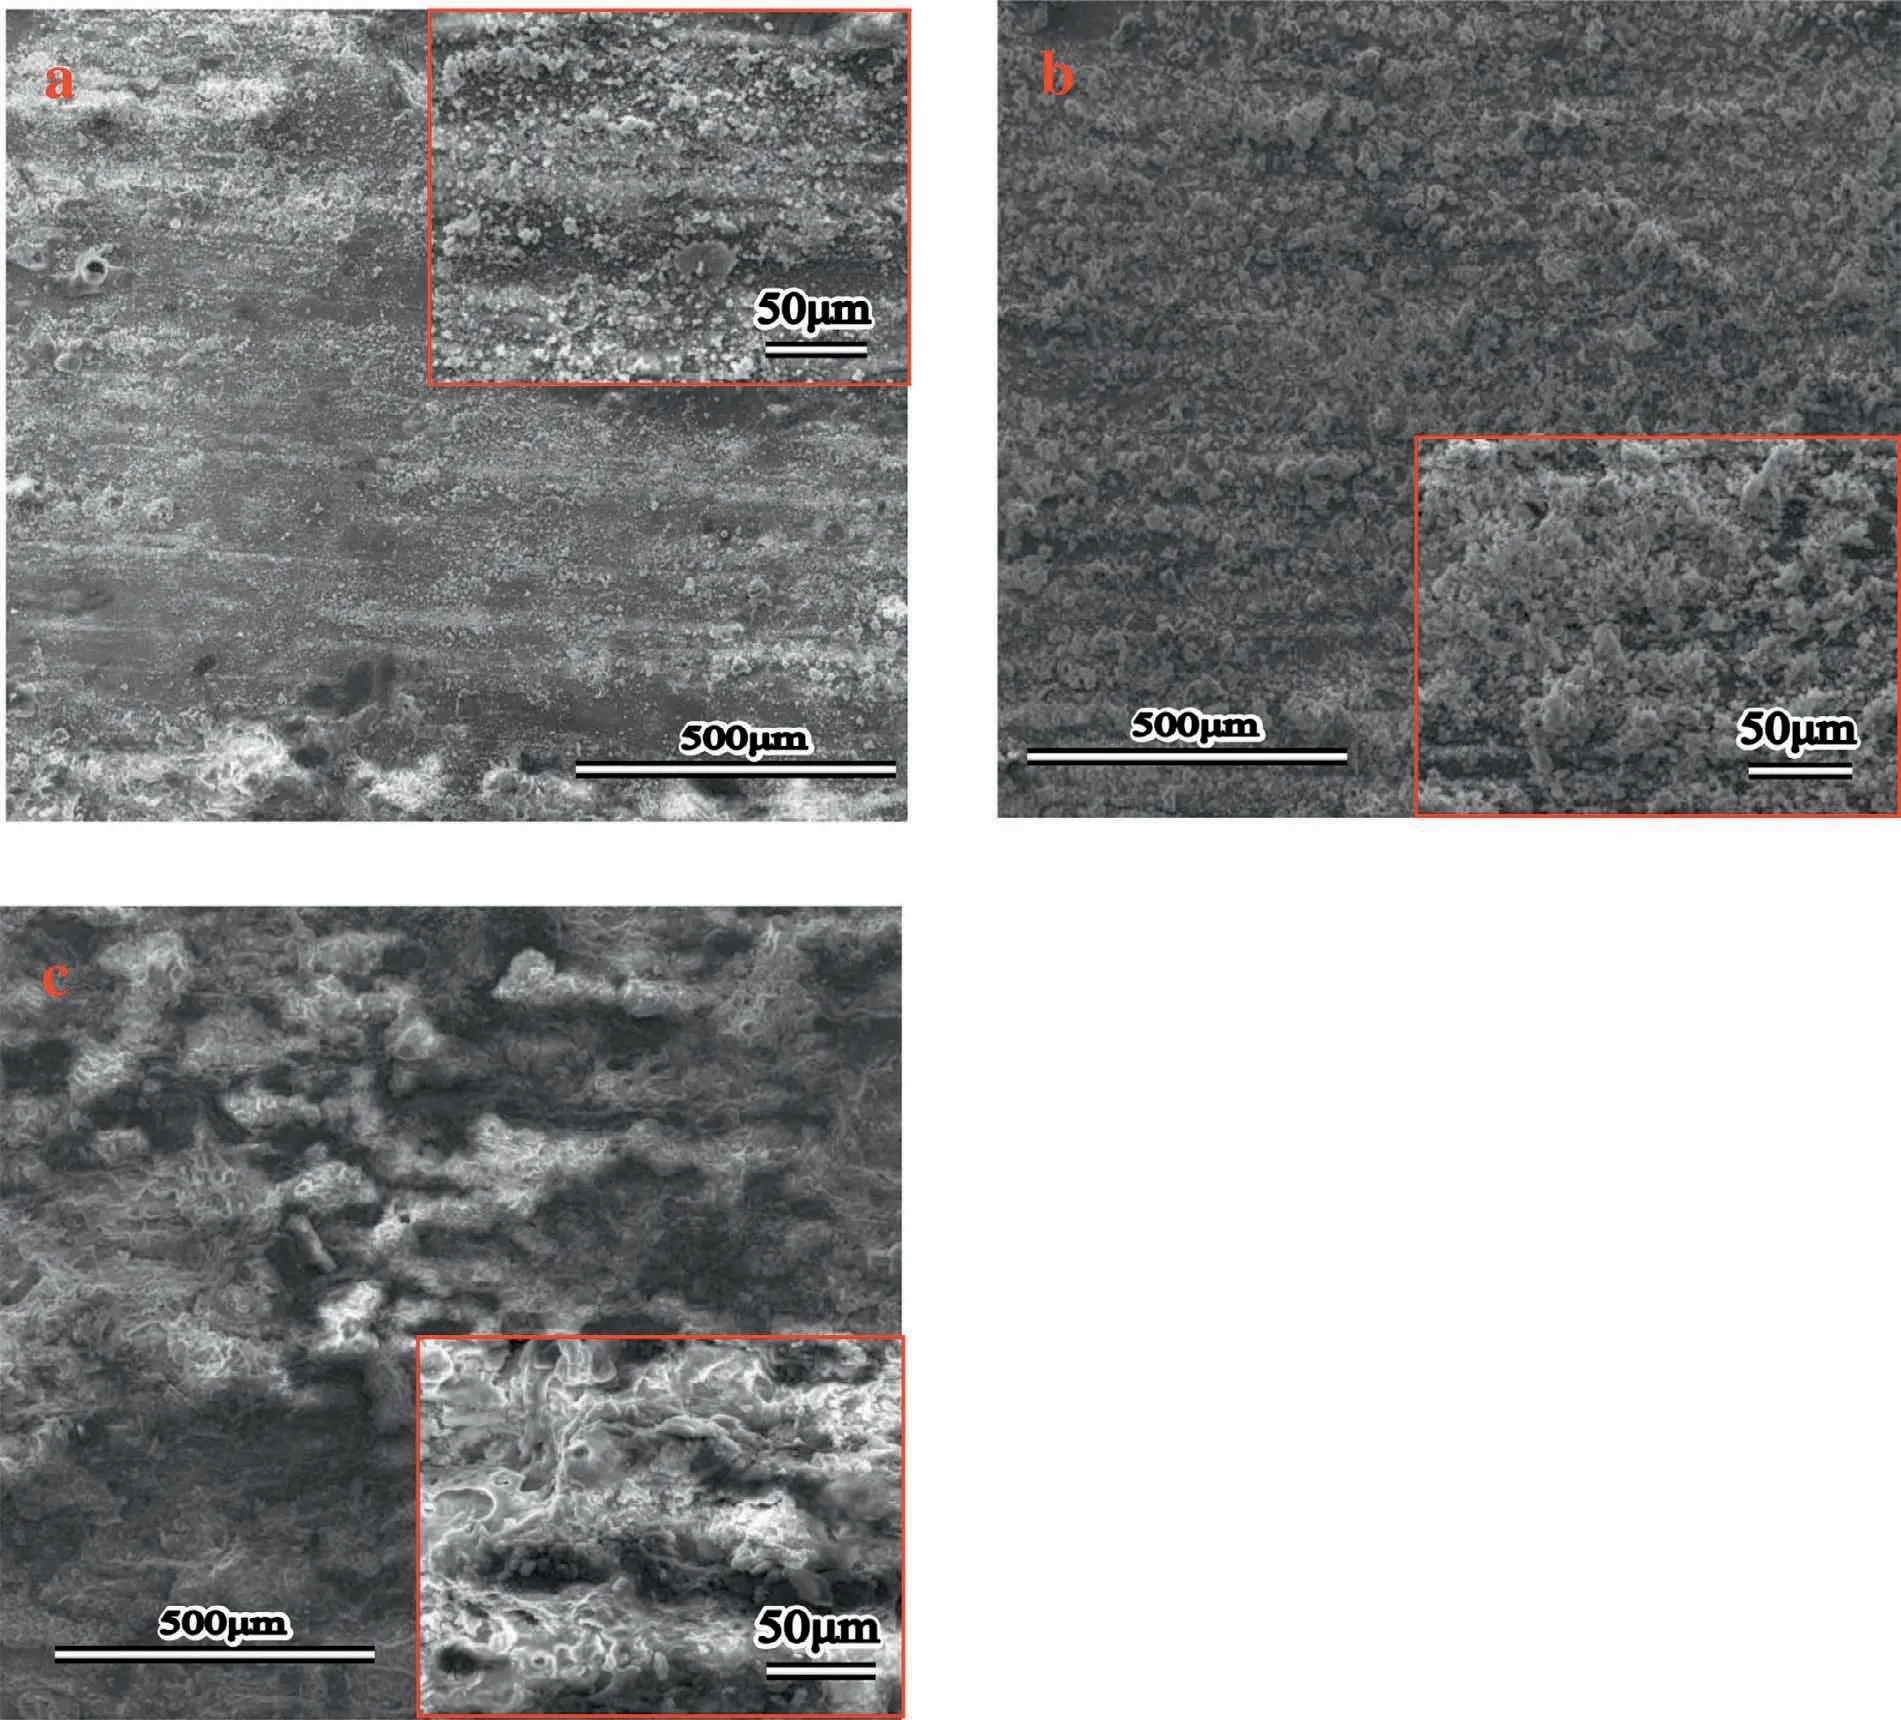
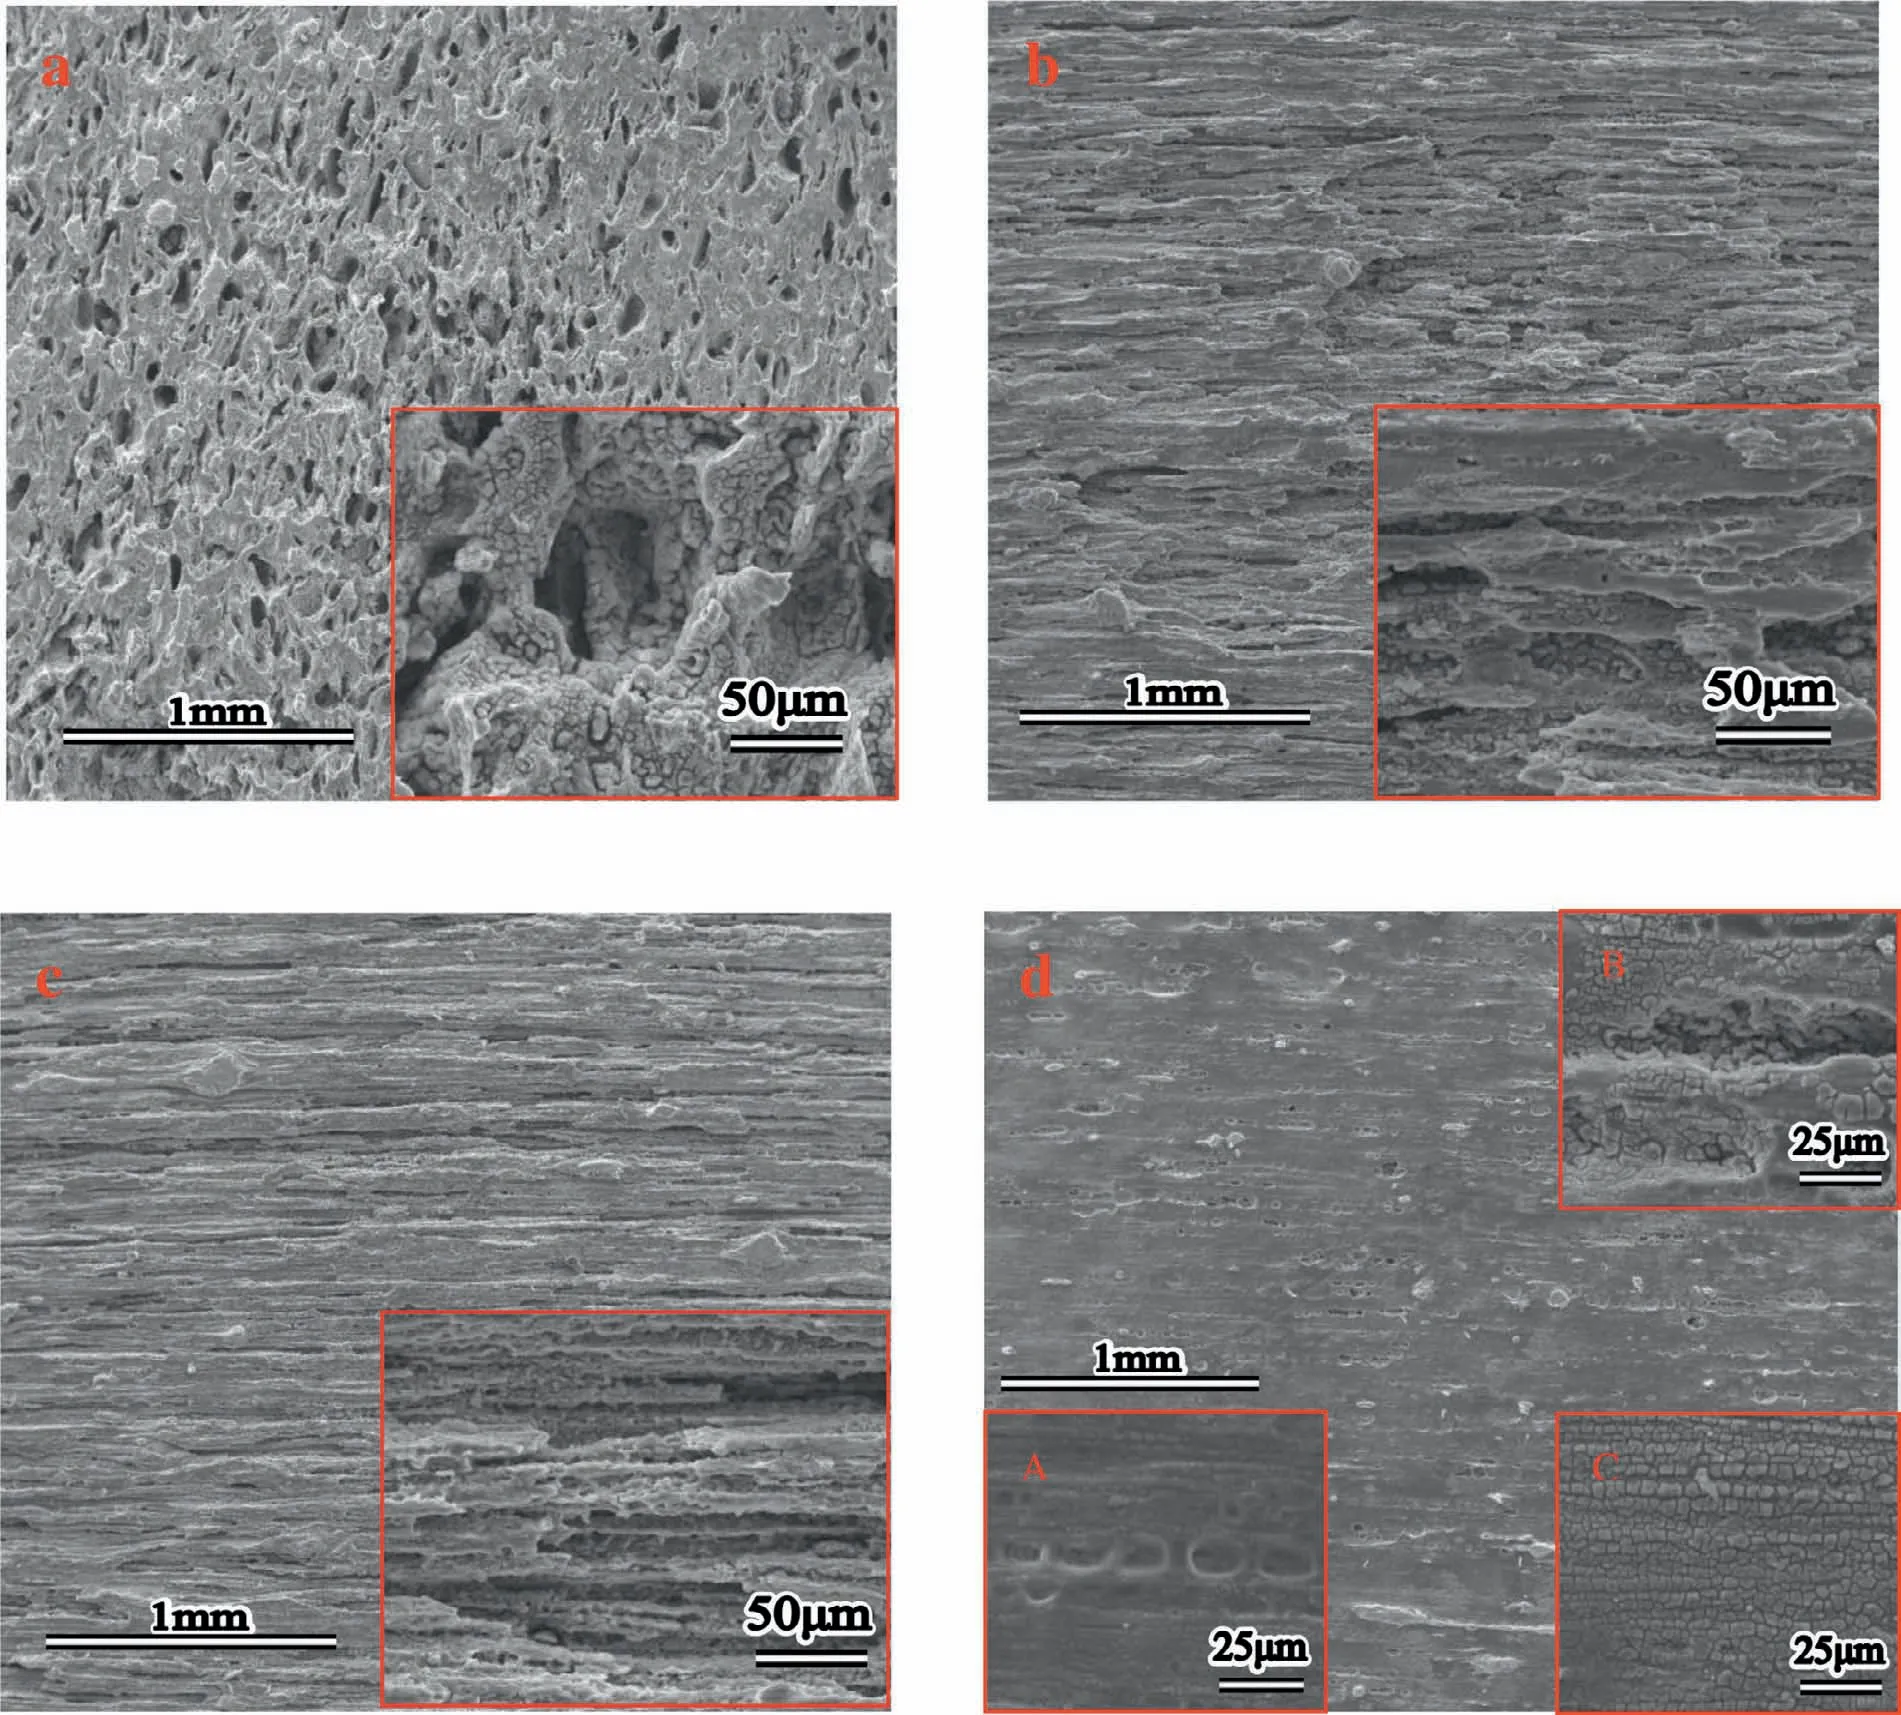
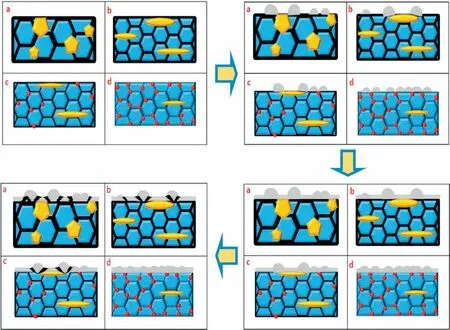
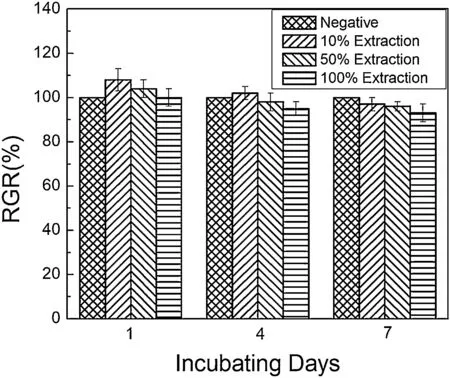
Finally,dissolution and formation of corrosion product layer reached the dynamic balance and the pH values were stable.The sequence of stable pH value at 144h was AES2 Fig.11.SEM micrographs and EDS analysis of S with immersion time prolong:(a)6h,(b)24h and(c)72h. Fig.12.Surface corrosion simulation diagram of S with immersion time prolong:(a)0h,(b)6h,(c)24h and(d)72h. Figs.6 and 7 showed weight change and weight loss of Mg-5%Zn alloys immersed in Ringer’s solution.Weight change value and weight loss value were calculated by(m1-m0)/m0and(m0-m2)/m0respectively,where m1was weighted at different immersion time,m2was weight after cleaned corrosion product at the same immersion time and m0was original weight.A higher weight change meant a higher corrosion resistance and sample integrity,and slower strength loss.At the beginning,corrosion product could be formed and adhered on the surface,and weight change was increased.With the progress of corrosion,some corrosion product was peeled off surface and weight change was decreased.According to Fig.6,the sample integrity of was much higher than that of S,and AES2 could maintain the stage of weight change>0.0% for the longest time.Fig.7 showed a similar weight loss trend.The results of immersion test suggested that corrosion resistance of Mg-5%Zn alloys in Ringer’s solution was S Fig.13.EIS plots of ES with immersion time prolong. Fig.8 showed potentiodynamic polarization curves of Mg-5%Zn alloys in Ringer’s solution.And electrochemical parameters obtained are showed in Table 2. Compared with S,ES showed a more positive Ecorrand a lower Icorr.Because fine grain could create more grain boundaries which acted corrosion barriers and enhanced corrosion resistance[27,28].With aging time prolonging,AES1 and AES2 showed more positive Ecorrand lower Icorr.The results indicated that aging treatment could rise Ecorr,and result in reduction of Icorr.The order of the Rivalues was S>ES>AES1>AES2 and it was consistent with the results of immersion test. Fig.14.SEM micrographs of ES with immersion time prolong:(a)6h,(b)24h and(c)72h. Fig.15.Surface corrosion simulation diagram of ES with immersion time prolong:(a)0h,(b)6h,(c)24h and(d)72h. In order to further clarify the influence of microstructure characteristic on biodegradable behavior of Mg-5%Zn alloys in Ringer’s solution.The EIS plots with immersion for different time were analyzed and the equivalent circuits were established.Because the change of sample surface in original immersion periods had a giant influence on the whole biodegradable behavior,we focused on the immersion time for 0,6,24 and 72h.And the EIS parameters of Mg-5%Zn alloys were present in Table 3. Fig.9 showed EIS plots of S with immersion time prolong.The curves consisted of one high-medium frequency capacitance loop and one medium-low frequency inductance loop. Fig.10(a)illustrated the equivalent circuit of S.Rs represented the solution resistance,and Rctand CPE1were used to describe the capacitance loop in high-medium frequency.Rctrepresented charge transfer resistance and CPE1was related to the electric double layer[29,30].In this study,the CPE1was defined by two values,C1and n1,due to non-homogeneity in the system[31].Besides,RLand L were used to represent the medium-low frequency inductance loop.RLindicated inductance resistance associated inductive element in parallel,meanwhile,L was related to absorb intermediately. The inductance loops existed at all four curves of S,suggesting the generation of pitting corrosion occurred in the whole corrosion process[29].With immersion time prolonging,the charge transfer resistances(Rct)of the Mg-Zn alloys decreased,which revealed higher corrosion rate of alloys matrix[32].lower Rctvalues were shown,which implied higher corrosion rates of Mg matrix[33].In addition,S indicated the higher L,which was relate to severe localized corrosion and pitting corrosion[34]. Fig.11 illustrated SEM surface morphology and EDS analysis of S at different immersion time.After 6h of immersion(Fig.11(a)),the surface of S showed the typical localized corrosion and severe pitting corrosion.And the Mg(OH)2clusters partially adhered,and uneven corrosion product layer remained the fresh matrix reacted with the Ringer’s solution.After 24h of immersion(Fig.11(b)),the rough Mg(OH)2covered the whole surface,however,a number of pits and cracks were also observed.As Fig.11(c)shown,the pits and cracks gradually developed to deep corrosion pits at 72h. Fig.16.EIS plots of AES1 with immersion time prolong. The EDS results revealed that the corrosion products at Point 1 were much richer in O than those in Point 2,and the content of Mg(OH)2in bright areas was higher than the dark areas.It was also possible that the corrosion product contained MgO,but it did not detect by XRD due to its low content. Fig.12 showed surface corrosion simulation diagram of S.The seriously inhomogeneous corrosion of S was greatly attributed to the large-sized second phases along grain boundaries.These second phases could act as micro-cathode of galvanic corrosion and resulted in plenty of corrosion pits,and the micropores also could provide favorable conditions for the formation of pitting corrosion[35].Therefore,through these corrosion pits,solution could infiltrate corrosion product layer,and caused the consistent corrosion.Consequently,corrosion product layer of S was so loose that it could not effectively protect the alloy matrix. Fig.17.SEM micrographs of AES1 with immersion time prolong:(a)6h,(b)24h and(c)72h. Fig.13 showed EIS plots of ES.For 0h of immersion,the EIS plot was characterized by two loops:one high-medium frequency capacitance loop and one medium-low frequency capacitance loop.Fig.10(b)illustrated the equivalent circuit of ES at 0h of immersion.The Rfand CPE2represented resistance and capacity of surface product layer respectively,which were used to describe the second capacitance loop in medium-low frequency.In this study,the CPE2was also defined by two values,C2and n2,for the non-homogeneity in the system.The medium-low frequency capacitance loop for 0h of immersion meant a protective corrosion product layer existed on the surface of ES in the initial corrosion stage.When immersion time reached 6h,one low frequency inductance loop appeared and its equivalent circuit was illustrated by Fig.10(c).As immersion time prolonged to 24h and 72h,the EIS plots included two capacitance loops and Fig.10(a)illustrated their equivalent circuits. After 6h of immersion(Fig.14(a)),lots of Mg(OH)2was formed along the extrusion direction,And the new pitting corrosion could be occurred on the exposed matrix,which was consisted with the appearance of low frequency inductance loop.After immersed 24h(Fig.14(b)),the corrosion product layer became more compact but a few shallow pits and cracks were still observed along the extrusion direction.Though the corrosion product layer was thick at 72h(Fig.14(c)),the peeling of corrosion product layer was obliviously found. As Fig.15 shown,compared with S,corrosion morphology of ES were more uniform due to following effects:(1)The fine-grained microstructure of ES was beneficial to improve corrosion resistance and its corrosion behavior was more homogeneous[36].(2)The reduction of network second phases decreased the micro-galvanic cell areas.However,alloy matrix around the strike-like MgZn second phases was preferentially attacked and corrosion pits and cracks could initiate at the vicinity of strike-like second phases contributing to galvanic corrosion[37].It was considered that corrosion initiated at these pits and cracks to the surrounding and generated H2gas,which enhanced stress between alloy matrix and corrosion products and resulted in the peeling of corrosion product layer. Fig.18.Surface corrosion simulation diagram of AES1 with immersion time prolong:(a)0h,(b)6h,(c)24h and(d)72h. As Fig.16 shown,EIS plots of AES1 consisted of one high-medium frequency capacitance loop and one mediumlow frequency capacitance loop at 0 and 6h of immersion.And the EIS plots of AES1 contained two loops:one highmedium frequency capacitance loop and one low frequency inductance loop at 24 and 72h of immersion.Fig.10(a)and(b)represented the equivalent circuits of AES1 for 0h and 6h,as well as,24h and 72h respectively.It was found that AES1 could keep the protective corrosion product layer longer than ES. After 6h,surface of AES1 was nearly covered with corrosion products and the corrosion product layer was relatively uniform(Fig.17(a)).At 24h,corrosion product layer became more compact and only a few matrix was exposed(Fig.17(b)).And the adhered corrosion product of AES1 was cluster and it was different from the strike-like corrosion product of ES.After 72h of immersion,the entire surface was covered and the peeling of corrosion product layer was weaker than that of ES(Fig.17(c)). Fig.18 illustrated,in the corrosion process of AES1,the more uniform corrosion product distributed,the less falling of corrosion product layer occurred and the more protective of the corrosion product layer possessed.Because,the tide and dense corrosion product layer could effectively extinct the specific narrow space,such as corrosion pores,pits and cracks that would aggregate the solution and increased the concentration of chloride ion,and decreased the area of exposed matrix surface.All those could avoid the possibility that further corrosion happen. The EIS plots of AES2(Fig.19)inhibited the same pattern:one high-medium frequency capacitance loop and one medium-low frequency capacitance loop.The equivalent circuit of AES2 could be described by Fig.10(b).And the Rct values at 72h of immersion increased in the order of S Fig.19.EIS plots of AES2 with immersion time prolong. After 6h of immersion,thin corrosion product layer was nearly covered the whole surface of AES2 and was more uniform and smoother than the others(Fig.20(a)).It was surprising that the distinctive corrosion product layer could be formed rapidly at the initial immersion and reduced the exposed matrix.With immersion time prolonging to 24h,the corrosion product layer became much thicker and denser(Fig.20(b)).When immersion time reached 72h,the corrosion product layer still kept integrity and almost no corrosion pits or cracks were observed(Fig.20(c)). With Fig.21.uniform and smooth of corrosion product layer decreased the stress with AES2 matrix and corrosion product was difficult to fall off.Therefore,the layer could effectively protect alloy matrix from the corrosion of solution and improve its corrosion resistance dramatically.It could explain why the EIS resulted in a relatively stable Rf. The surface morphology of Mg-5%Zn alloys after corrosion product removed(Fig.22)were studied,and their cross section corrosion simulation diagrams(Fig.23)were also presented.Likewise,the causal relationship between microstructure and bio-corrosion process was focus to be discussed,including the formation,adhesion and shedding of the self-corrosive product layer.Finally,a possible Mg-based implant matrix with high corrosion resistance was further be presumed. Fig.20.SEM micrographs of AES2 with immersion time prolong:(a)6h,(b)24h and(c)72h. Fig.21.Surface corrosion simulation diagram of AES2 with immersion time prolong:(a)0h,(b)6h,(c)24h and(d)72h. Plenty of deep pits were observed over the surface of S where severe localized corrosion and pitting corrosion occurred(Fig.22(a)).The magnified morphology showed that many tiny crevices were visible on the surface where Ringer’s solution permeated through and degraded the matrix. Several large-sized corrosion pits were found along the extrusion direction due to micro-galvanic corrosion of strike-like second phases(Fig.22(b)).And the number of tiny crevice was less than that of S.On the one hand,hot extrusion could crush the coarse second phases and eliminate micropores,which obviously decreased corrosion resistance of corrosion product layer.On the other hand,fine grain structure of ES could improve combine force between alloy matrix and corrosion product layer[39]. Fig.22.SEM micrographs of Mg-Zn alloys for 72h with corrosion product removed:(a)S,(b)ES,(c)AES1 and(d)AES2. AES1 showed a smoother corrosion surface with fewer corrosion pits(Fig.22(c)).Aging treatment reduced the strike-like second phases and distributed Zn element more uniformly.Thus,the reducing of electrochemical heterogeneous region lead to more homogeneous corrosion morphology. AES2 presented the uniform corrosion morphology and there were three kinds of magnified corrosion morphology(Fig.22(d)).(1)Some shallow corrosion pits were observed in the interior of larger crystal grains(region A).It could be explained that the Zn-rich site around grain boundaries could serve as excellent cathodes and the interior of grains was suffered severe attack.(2)Several large-sized corrosion pits(region B)were also visible due to the peeling of strike-like second phases.The magnesium matrix around second phases was preferentially suffered and the adhesion between them became weaker resulting in the peeling of second phases.(3),No obvious corrosion pits and cracks were observed(region C).The fine second phases with homogeneous-distributed could act as micro-cathodes of galvanic corrosion and accelerate to form uniform corrosion product layer on the whole surface at the beginning of immersion.The uniform corrosion product layer could make pitting corrosion and localized corrosion difficult to happen.And it can be considered an ideal structure of Mgbased implant matrix model to improve corrosion resistance. Therefore,what is supposed to be the major elements to make up the ideal microstructure to the formation of the distinctive corrosion product layer?The results are as follows:Fine grain size,Tiny second phases with homogeneousdistributed,Uniform element distribution and Reduction of defect. Fig.23.Cross section corrosion simulation diagram of Mg-Zn alloys with immersion time:(a)S,(b)ES,(c)AES1 and(d)AES2. Fig.24.RGRs of the L-929 cells cultured in different extracts of AES2. According to the above investigations,AES2 demonstrated the suitable mechanical properties and better corrosion resistance.Thus it was selected to investigate in cytocompatibility test(Fig.24).According to the ISO 10993-5:1999 standard,the cytotoxicity of these extracts was grade 0–1.Thus,AES2 was innocuous and was suitable for cellular applications. Mg-5%Zn(mass fraction)alloys were prepared by powder metallurgy for orthopedic application.α-Mg and MgZn were identified in as-sintered samples.After hot extrusion,grains significant refined,and coarse second phases were broken into strike-like second phases along extrusion direction.With aging treatment prolonging,grain size increased slightly,the strike-like MgZn phases were reduced and plenty of fine MgZn phases were precipitated. The electrochemical tests and immersion tests in Ringer’s solution showed that corrosion product layer played an important role in biodegradable behavior,and the microstructure characteristics of Mg-based alloy had giant impact on its corrosion resistance.The Mg-Zn alloy after hot extrusion and aging treatment could generate protective corrosion product layer with more uniform and stability. It is worth noting that Mg-Zn alloy matrix with fine-grain microstructure and homogeneous hundred nano-sized MgZn phases could rapidly form the uniform Mg(OH)2layer at the beginning of immersion,and the uniform and smooth corrosion product layer is the results of the slight corrosion caused by the homogenous microstructure,which effectively protect the matrix in Ringer’s solution during immersion.And in vitro cytotoxicity assessments showed its good biocompatibility.In result,fine grain size,tiny second phases and uniform element distribution could be recognized as significant microstructure characteristics to form protective corrosion product layer,and the alloy matrix could be considered for further investigations as an ideal biodegradable implant. Declaration of Competing Interest The authors declare that they have no known competing financial interests or personal relationships that could have appeared to influence the work reported in this paper. Acknowledgement The authors acknowledge the Project(81472058)supported by the National Natural Science Foundation of China,the financial support of the 2015 ShanDong province project of outstanding subject talent group.the project(LSDKB1806)supported by the foundation of National Key laboratory of Shock Wave and Detonation Physics and the project(11802284)supported by the National Natural Science Foundation of China.The project(2017GK2120)supported by the Key Research and Development Program of Hunan Province and the Natural Science Foundation of Hunan Province of China(2018JJ2506).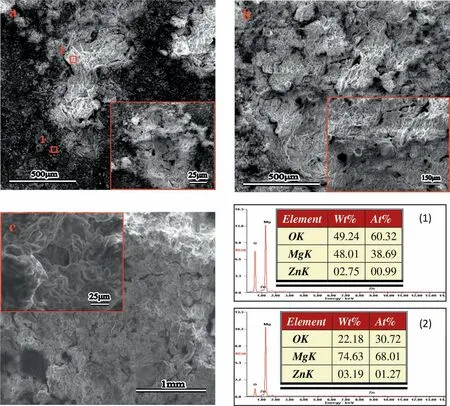

3.6.Potentiodynamic polarization curves of Mg-Zn alloys

3.7.Biodegradable behavior of Mg-Zn alloys in original immersion periods

3.8.Discussion of an ideal Mg-based implant matrix model

3.9.Cytocompatibility test of Mg-Zn alloys
4.Conclusion
杂志排行
Journal of Magnesium and Alloys的其它文章
- Recent developments and applications on high-performance cast magnesium rare-earth alloys
- Surface characterization and corrosion behavior of calcium phosphate(Ca-P)base composite layer on Mg and its alloys using plasma electrolytic oxidation(PEO):A review
- Towards developing Mg alloys with simultaneously improved strength and corrosion resistance via RE alloying
- Magnesium matrix composite reinforced by nanoparticles–A review
- The design of Co3S4@MXene heterostructure as sulfur host to promote the electrochemical kinetics for reversible magnesium-sulfur batteries
- A new die-cast magnesium alloy for applications at higher elevated temperatures of 200–300°C
