Topography modulates effects of nitrogen deposition on microbial resource limitation in a nitrogen-saturated subtropical forest
2021-02-28HaoChenJunjieTangXibinSunKayanMaHuaihaiChenandDejunLi
Hao Chen,Junjie Tang,Xibin Sun,Kayan Ma,Huaihai Chen and Dejun Li*
Abstract
Keywords: Nitrogen deposition,Topography,Nutrient limitation,N saturation,Enzyme activity,Enzymatic stoichiometry
Introduction
Over the past few decades, atmospheric nitrogen (N) deposition increased rapidly due to fossil fuel combustion and widespread use of chemical fertilizer N (Galloway et al. 2008). It is documented that N deposition is altering the structure and function of terrestrial ecosystems,including the plant growth, carbon and nutrient cycling(Galloway et al. 2008). To describe effects of N deposition on ecosystem processes, especially the N cycling, a N saturation theory was developed basing on studies from temperate forests (Aber et al. 1989). This theory proposes that continuous N input may reduce system requirements for N, and finally the system may become Nsaturated. In this case, carbon (C), phosphorus (P) or water limitation is expected to occur or be aggravated(Aber et al. 1989). This is a useful theory for predicting dynamics of terrestrial ecosystems in response to increased N deposition (Chen et al. 2018d).
This proposition, however, has not specified which nutrient would be the most limited after removing N limitation. In plants, this topic has been studied widely.Recent studies tend to suggest that N deposition may switch N limitation to P limitation (Gress et al. 2007;Braun et al. 2010; Crowley et al. 2012; Li et al. 2016;Deng et al. 2017), although some studies find no effects(Finzi 2009; Weand et al. 2010) or other limitations,such as calcium (Ca) limitation (McNulty et al. 1996). In microbes, however, the discussion is relatively few, and the situation might differ from plants. For microbes, C is often a more limited element compared to N, P or other nutrients (Soong et al. 2020). Thus, when N limitation is removed after continuous N input, C may be the most limited factor for microbial growth, instead of P or other nutrients. However, such an expectation is not consistent with many recent studies, which suggest that N addition may aggravate microbial P limitation (Marklein and Houlton 2012). Since microbes are as important as plants in an ecosystem, more studies are undoubtedly needed to address how microbial resource limitation changes after increased N deposition.
The ecoenzymatic stoichiometry method provides a new tool to study this topic. Compared to traditional methods that measure effects of substrate additions on microbial biomass or respiration as indicators of microbial resource limitation (Traoré et al. 2016), ecoenzymatic stoichiometry has following advantages. First, it is much faster, because it measures activities of only four enzymes, including β-D-glucosidase (BG), L-leucine aminopeptidase (LAP), β-N-acetylglucosaminidase (NAG),and acid/alkaline phosphatase (AP). Second, using enzymes as proxy indicators of C, N, and P acquisition, it is much easier for us to understand which nutrient is more limited to an ecosystem (Sinsabaugh 1994). However, most previous studies reported effects of N addition on the activity of the single enzyme (Marklein and Houlton 2012; Chen et al. 2016b; Jian et al. 2016),very few studies have assessed responses of ecoenzymatic stoichiometry to N additions (Wang et al. 2015).By collecting published data regarding single enzyme activity in response to N addition, a previous meta-analysis reported that nitrogen deposition may aggravate microbial C limitation (Chen et al. 2018d). However, there were two major limitations in this study: firstly, the selected published studies rarely reported C, N, and P acquisition enzymes at the same time, which largely limited the data’s comparability and the conclusion’s generality; secondly, most selected studies were conducted in N-limited systems rather than N-saturated systems, and thus could not answer the above question regarding changes of resource limitation after a system has been N-saturated. These limitations highlight the importance of more field experiments conducted in Nsaturated systems and more experiments measuring enzymes fully for calculating ecoenzymatic stoichiometry.
Topography is a modulator in many microbial processes, but is often ignored in the previous N-deposition studies. Most N-deposition simulation experiments were conducted in one topography position (mostly in flat ground) or did not distinguish topography positions(Zhang et al. 2021), while few experiments estimated whether and how topography regulates the responses of microbial processes to N deposition (Zhang et al. 2013).In a previous study, divergent responses of soil asymbiotic N2fixation to N addition has been found between the valley and slope, implying the important effect of topography on ecosystem processes (Wang et al. 2019),but further conclusions were not drawn on whether microbial resource limitation status had similar responses.In general, soil N level was found lower in the upslope(due to erosion) than in the downslope or valley (Weintraub et al. 2015), resulting in a higher sensitivity of microbes to the addition of N in the upslope than in the downslope or valley. Nevertheless, the N leaching was reported higher in the upslope than in the downslope or valley (Wang et al. 2019), which in turn weakened the N addition effects. The ambiguous effects of topography as a result of these contrary mechanisms has prevented predictions regarding responses of terrestrial ecosystem processes to atmospheric N deposition.
Therefore, in this study we conducted a two-year N addition experiment in a subtropical karst forest, where soil microbes have been proven to be N-saturated (Chen et al. 2018b), to test how N deposition changes the status of microbial resource limitation in such a Nsaturated situation. In order to investigate whether topography regulates effects of N additions on microbial resource limitation status, the N-addition experiment was set up at two topography positions, a valley and a slope.To our knowledge, this is the first N-deposition simulation experiment site that considers effects of topography in the subtropical forest. We hypothesized that (1) nitrogen additions may aggravate microbial C limitation according to the previous studies (Chen et al. 2018d), but(2) the response of microbial limitation to nitrogen additions may be more sensitive in the valley than on the slope due to the higher soil N level in the valley and higher N leaching on the slope in the studied area.
Materials and methods
Site description
The studied forest locates in Mulun National Nature Reserve of Huanjiang County, southwest China (24°54′-24°07′ N, 107°56′-108°00′ E; 299–686 m a.s.l) (Wang et al. 2019). This area has a monsoon climate. Mean annual temperature is about 19 °C, with the lowest monthly mean in January and the highest in July. The mean annual precipitation is about 1,389 mm, with a distinct seasonal pattern: the wet season is from April to October and the dry season is from November to March.The selected forest is about 35 years old after clear-cut,dominated by Cryptocar-yachinensis (Hance) Hemsl.,Cinnamomum saxatile H. W. Li, Koelreuteria minor Hemsl., Pittosporum tobira (Thunb.) Ait., Bridelia tomentosa Bl., Murraya exotica L. Mant. The soil is leptosols based on the FAO World Reference Base for Soil Resources (IUSS-Working-Group 2006). More detailed information of soil properties can be found in a previous study (Wang et al. 2019).
Experimental design
The experiment was initiated in April 2016 (Wang et al.2019). The experiment was conducted in the valley and on the slope, respectively, where the soil properties are different (Table 1): there are higher concentrations of soil organic C, total N, NO3-, and Ca and greater NO3-leaching rate on the slope than in the valley. In each position, a randomized block design was adopted with three N treatments and three blocks: control (CT, 0 kg N·ha-1·yr-1), low-N addition (LN, 50 kg N·ha-1·yr-1)and high-N addition (HN, 100 kg N·ha-1·yr-1), which were widely used in the N addition experiments (Mo et al. 2007). Thus, there were 18 plots (10 m × 10 m each) in total (Fig. S1). Each plot was surrounded by a 10-m wide buffer strip. NH4NO3was weighed and mixed with 10 L of water (equals to 1.2 mm annual precipitation) for each N-treatment plot, and the NH4NO3solution was sprayed every month to the forest floor with a backpack sprayer. The control plots received 10 L of water without fertilizer.
Soil sampling and lab experiments
Soil sampling was conducted twice in May, 2017 and 2018, respectively. In each plot, five soil cores were collected and mixed into a composite sample. Soils were passed through a 2-mm mesh sieve after picking out roots and stones. The sieved soil samples were divided into two portions for further processes. One portion was air-dried at room temperature for analyzing soilproperties, including soil organic C (SOC), total N (TN),total P (TP), dissolved organic C (DOC), total dissolved N (TDN), and available P (AVP) (Carter and Gregorich 2006; Lasota and Błońska 2021). Another portion were kept on ice in the field and were stored at 4 °C in the laboratory for analyses of soil NH4+and NO3-concentrations, microbial biomass C (MBC), N (MBN), and P(MBP), and extracellular enzyme activity (Chen et al.2018b). Soil NH4+and NO3-concentrations were analyzed by an autoanalyzer (FIAstar 5000, FOSS, Sweden).MBC, MBN, and MBP were determined by the chloroform fumigation extraction method (Brookes et al. 1982,1985; Vance et al. 1987). In 2018, the nitrification rate was measured using the intact tube incubation method,and NO3-leaching rate was measured using ionexchange resin bags method (Chen et al. 2016a).

Table 1 The differences in soil properties between slope and valley. BD,SOC, TN, TP,NH4+, NO3-,Ca and Mg are bulk density,soil organic carbon,total nitrogen,nitrate,ammonium, calcium and magnesium,respectively. Values represent means with standard errors in the parentheses.Different letters denote the significant difference between valley and slope
Enzyme activity assays were conducted within two weeks after soil sampling. β-D-glucosidase (BG), LLeucineaminopeptidase(LAP),β-Nacetylglucosaminidase (NAG), and acid phosphatase(AP) were assayed with published microplate protocols.In addition, in order to model decomposition rates, we also measured the activity of ligninolytic enzyme (i.e.polyphenol oxidase [POX]) with a spectrophotometrical method. Detailed assay processes can be found in our previous studies(Chen et al.2017,2018b).Enzyme activity was expressed to units per g of soil organic carbon,i.e., μmol·g-1SOC·h-1.
Ecoenzymatic stoichiometry
Several methods were used to reflect microbial resource limitation status. First, simple ratios of enzyme activities were used.Higher BG/(LAP+NAG)and BG/AP indicate lower N and P limitation, respectively (Waring et al. 2014). Second,vector length and angle of ecoenzymatic stoichiometry was conducted as follows(Moorhead et al.2013):

A longer vector length indicates greater C limitation;vector angles of <45° and >45° indicate N and P limitation, respectively (Moorhead et al. 2013). When vector angle is <45°, a greater vector angle indicates smaller N limitation. When vector angle is >45°, a greater vector angle indicates greater P limitation.
Third, C:N and C:P of the available resources (DOC/TDN (RC:N) and DOC/AVP (RC:P), respectively) were compared to the Threshold Elemental Ratios (TER) for C:N and C:P (TERC:Nand TERC:P, respectively). When RC:N– TERC:Nor RC:P– TERC:Pis less than zero, soil microbes are not limited by N or P. When the RC:N–TERC:Nor RC:P– TERC:Pis greater than zero, microbes are N or P limited. In the latter case, higher RC:N–TERC:Nor RC:P– TERC:Pindicate higher N or P limitation (Sterner and Elser 2002). TERC:Nand TERC:Pwere calculated as follows (Sinsabaugh et al. 2009; Guo et al.2020; Zhao et al. 2021):
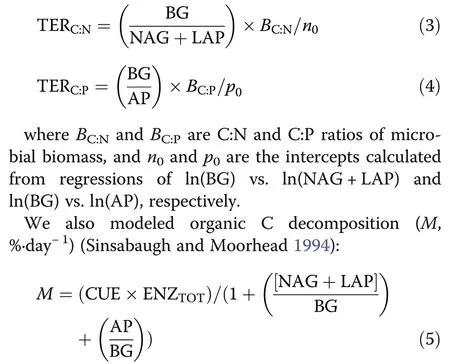
where ENZTOTis the sum of BG, POX, (NAG+LAP),and AP normalized to their maximum values. CUE is carbon use efficiency, which was calculated as follows(Sinsabaugh et al. 2013;Chen et al. 2018b):

CUEmaxis the upper limit for microbial growth efficiency (0.6). SC:Nor SC:Pis a scalar that represents the extent to which the allocation of ecoenzymatic activities offsets the disparity between the elemental composition of available resources and the composition of microbial biomass. KC:Nand KC:Pare the half-saturation constants(0.5). BC:Nand BC:Pare C/N and C/P of microbial biomass. LC:Nand LC:Pare available C:N (i.e. DOC/TDN)and C:P (i.e. DOC/ AVP).
Data analysis
In this study, soil enzyme activity had no responses to one-year N addition (Table S2), but had significant changes after two years of N addition. Thus, in the following analyses we only focused on the results after two years of N additions. One-way analysis of variance(ANOVA) with least significant difference (LSD) test was used to test the effects of the two-year N addition on soil properties, enzyme activities and ecoenzymatic stoichiometry indexes. A one-sample t-test was used to test the difference between RC:N– TERC:N(or RC:P–TERC:P) and zero, and the difference between vector angle and 45°. The data was tested homogeneity of variance and normality of distribution prior to statistical analyses. All statistical analyses were conducted using SPSS 16.0 statistical software (SPSS Inc., Chicago, IL,USA). All reported significant differences are at P <0.05.
Results
In the control, mean enzyme activities were 1.9±0.1,31.7±4, 0.01±0.01, 0.6±0.04, and 1.8±0.1 μmol·g-1SOC·h-1for BG, POX, LAP, NAG, and AP, respectively,and there was no significant difference between slope and valley (Fig. 1). On the slope, N addition did not change activities of all studied enzymes (Fig. 1). In the valley, N addition changed activities of all studied enzymes after two years of N treatments (Fig. 1). The BG and NAG activities increased significantly in the high-N treatment compared to the control (Fig. 1a and d), and AP activity increased significantly in both high-N and low-N addition treatments (Fig. 1e), but POX and LAP activities decreased significantly in the high-N treatment(Fig. 1c and b).
As for ecoenzymatic stoichiometry, N addition did not change any indexes of ecoenzymatic stoichiometry on the slope position (Figs. 2 and 3). However, in the valley, N additions significantly increased BG/AP and vector length (Fig. 2a and b), but did not change the BG/(LAP+NAG) in both low and high N treatments compared to the control (Fig. 2c). RC:N– TERC:Nwas significantly lower than zero in the control, and N addition significantly decreased RC:N– TERC:Nin both low-N and high-N treatments (Fig. 2d). Vector angle in the control was significantly greater than 45°,and N addition significantly decreased vector angle in the high-N treatment (not in the low-N treatment).RC:P– TERC:Pin the control was significantly greater than zero, and both low-N and high N treatments significantly increased RC:P– TERC:P(Fig. 2e and f).In addition, N addition significantly increased the modeled decomposition rate (M) in both low-N and high-N treatments, and significantly decreased BG/POX in the high-N treatment (Fig. 3a and b).

Fig.1 Changes of activities of studied enzymes(μmol·g-1 SOC·h-1) after two years of N addition.(a)BG(β-D-glucosidase)and(b) POX(polyphenol oxidase)are two C-acqusition enzymes;(c)LAP(L-leucine aminopeptidase)and(d) NAG(β-N-acetylglucosaminidase)are two Nacquisition enzymes;(e)AP(acid phosphatase) is a P-acqusition enzyme.CT: control;LN:low-N addition;HN:high-N addition.Error bars denote the standard error (n=3). Different letters indicate significant difference(P <0.05)between treatments
Two-year N addition also changed soil properties(Fig. 4). In the valley, N addition significantly increased the concentrations of DOC and TDN in the high-N treatment (but not for the low-N treatment), and significantly increased nitrification rate and NO3-leaching rate in both low-N and high-N treatments, but did not changed other soil variables, including the concentrations of SOC, TN, TP, AVP, MBC, MBN, MBP, NH4+and NO3-. On the slope, N addition significantly increased nitrification rate and NO3-leaching rate in both low-N and high-N treatments, but had no significant effects on other studied variables (Fig. 4 and Table S1).
Discussion
Responses of enzyme activity to N additions
The mean enzyme activities measured in controls are similar to those measured in nearby forests (Chen et al.2018a, b). Nitrogen addition did not change activities of all studied enzymes after one year of N treatments in all topography positions (Table S2), but altered soil enzyme activity two years later in the valley, especially in high-N treatments (Fig. 1), indicating that the duration and rate of N addition are important factors affecting soil enzyme activity. After two years of N addition, the responses of the individual enzyme activity to N addition are consistent with the patterns reported in the recent metaanalysis studies (Jian et al. 2016; Chen et al. 2018c): in the valley, the BG, NAG, and AP activity increased significantly, but POX and LAP activity decreased significantly with the elevated N addition (Fig. 1). This is interesting, because if such patterns reflect a general change of enzyme activity in response to N addition, our results on ecoenzymatic stoichiometry can be representative for regions of larger spatial scales.

Fig.2 Changes of enzymatic stoichiometry indexes after two years of N addition.(a) Vector length and(b) BG/AP are two indicators of microbial C limitation.High vector length or BG/AP means greater C limitation.(c)BG/(LAP+NAG)and(d)RC:N–TERC:N are two indicators of microbial N limiation.High BG/(LAP+NAG)means lower N limitation,while higher RC:N–TERC:N means higher N limitation.(e)Vactor angle and(f)RC:P–TERC:P are two indictors of microbial P limitation.Greater vector angle indicates greater P limitation when vector angles >45°;higher RC:P–TERC:P means higher P limitation.CT:control;LN:low-N addition;HN:high-N addition.Error bars denote the standard error(n=3).Different letters indicate significant difference(P <0.05)between treatments.The asterisks indicate significant different between RC:N–TERC:N(or RC:P–TERC:P)and zero

Fig.3 Effects of N additon on(a) modeled decomposition rate(M)and(b)the ratio of BG(β-D-glucosidase) to POX(polyphenol oxidase). BG and POX are two C-acqusition enzymes,decomposing labile and non-labile organic C, respectively.CT: control;LN:low-N addition;HN:high-N addition.Error bars denote the standard error(n=3).Different letters indicate significant difference(P<0.05)between treatments
Responses of microbial resource limitation to N additions in the valley
We confirm that the studied forest is N-saturated, and show that N addition makes the phenomenon of Nsaturation more obvious. There are several lines of evidence to indicate that the studied forest is N-saturated:RC:N– TERC:Nwas less than zero in controls (in both valley and slope), indicating that the forest is not limited by N (Fig. 2d); by contrast, this forest may be P-limited because vector angle was greater than 45º and the RC:P–TERC:Pwas greater than zero in controls (Fig. 2e and f).These evidence are also found in the previous studies(Chen et al. 2018b). Since this forest has been Nsaturated, it is not surprising that continuous N addition make the symptom more obvious, which is evident from that RC:N– TERC:Nwas significantly lower in N treatments than in the control (Fig. 2d). In addition, increased nitrification rate and NO3−leaching rate (Fig. 4)also support the aggravated N-saturation according to N saturation theory (Aber et al. 1989).
Nitrogen aggravates microbial C limitation in this forest, which is consistent with the first hypothesis. The evidence is from the increased vector length in Naddition plots compared to the control (Fig. 2a). Similarly, we also found increased vector length in a previous meta-analysis by collecting enzyme activity data from 36 published N-addition studies (Chen et al. 2018d). Aggravated microbial C limitation has been suggested in many previous N-addition experiments (Treseder 2008). Here,we propose two likely reasons for the aggravated microbial C limitation after N addition in this study. First, it is a result of nutrient balance. To reach a balance of C and N, microbes will increase decomposition of organic matter to get more available C as N increases. This is supported by modeled decomposition rates (M) in this study, which was increased by 43 and 54% in low-N and high-N addition, respectively, compared to the control(Fig. 3a). As a result, increase in soil DOC concentration was also found (Table 1). However, in this study, the increased total decomposition rate is mainly attributed to the increased decomposition of the labile C fraction, rather than the non-labile C fraction. This can be reflected by the increased BG and the decreased POX (as a result,the decreased BG/POX, Fig. 3b), since BG and POX are two different enzymes to decompose labile C (such as cellulose) and non-labile C fraction (such as lignin), respectively (Chen et al. 2018c). Therefore, the reduced decomposition of non-labile C fraction may be another reason for the aggravated microbial C limitation in this study, because it decreases the sources of available C.
Compared to the aggravated C limitation, however, N addition may alleviate microbial P limitation, because vector angle decreased but RC:P– TERC:Pincreased in N-treatments relative to controls (Fig. 2). This result rejects our general belief that N addition leads to P limitation (Marklein and Houlton 2012). Increased AP may be a reason for the alleviated P limitation (Fig. 1e). However, this might be a paradox, because increased AP not only reflects the increased organic P decomposition(meaning alleviated P limitation), but also reflects the increased P demand of microbes (meaning aggravated P limitation). Instead, we propose that alleviated P limitation can be explained more directly by the increased BG/AP (Fig. 2b), which indicates that microbes need more C than P under N inputs. Therefore, N addition aggravates C limitation, rather than P limitation, according to Liebig’s law of the minimum that suggests only one nutrient can limit plant productivity at a time(Liebig 1842).
Topography modulates effects of N additions

Fig.4 Effects of two-year N addition on the disoveled organic carbon(DOC),total disoveled nitrogen(TDN),available phosphorus(AVP),nitrification rate,and leaching rate of nitrate(NO3-). Error bars denote the standard error(n=3). Different letters indicate significant difference(P <0.05)between treatments
The aggravated C limitation or alleviated P limitation were not found on the slope after two years of N addition, indicating that topography plays a role in modulating the effects of N addition on microbial resource limitation. The second hypothesis is thus supported. Most previous studies did not consider topography effects when they study the responses of ecosystem processes to atmospheric N deposition. This bias may over- or under-estimate effects of N deposition given that most nature ecosystems are not completely flat. In a previous study with the same experimental site,we have found the divergent responses of soil asymbiotic N2fixation to N additions between the valley and slope(Wang et al. 2019). Here, we also found similar pattern for microbial activity, further highlighting the importance of topography in regulating the effects of N deposition on ecosystem processes.
As mentioned, there might be two contrary mechanisms (i.e., different soil N levels and N leaching potentials) controlling the effects of the topography. In the current study, a reason for the weaker impacts of N addition on the slope may be due to the higher NO3-leaching in this topography position (Table 1). Soil gross nitrification rate in the limestone soil of the karst forest is very fast(Li et al.2017),so that deposited NH4+would be rapidly transformed to NO3-upon entering the soil.Considering that soil NO3-is more susceptible to leaching than NH4+, and that more rock outcrops and the greater inclination on the slope, more NO3-would be leached from the slope, which weakens effects of N addition on microbial activity on the slope.
Soil N level is higher on the slope than in the valley in our studied forest (Table 1), which might be another mechanism making the valley position more sensitive to N addition relative to the slope. There is evidence that N additions change ecosystem processes, such as soil C and N availability, more pronouncedly in N limited than in N rich ecosystems (Aber et al. 1998; Chen et al.2015). As for microbial resource limitation, similar responses might exist as well. Higher soil N status on the slope is not common in nature, but has been found in the karst region of south China (Liu et al. 2011). The divergent Ca contents between valley and slope might be responsible to this phenomenon. In karst forests, soil on the slope generally has a higher Ca content due to the higher rock explosion (Table 1). Because of the protection effect of Ca in storing soil organic matter (SOM)(Wen et al. 2016, 2017), soil on the slope has higher C and N content relative to the valley.
Conclusions
Our findings that the continuous N addition to the ecosystem in the valley switches N limitation to other limitations complements the N saturation theory. Most studies suggest that P would be the critical element limiting plant growth after N limitation is removed, but this pattern is rarely discussed at the microbial level. Carbon and P are two elements likely to limit microbial growth,and here we show that C will be the more limited element after N limitation is removed,which is different from the patterns observed in plants. This finding has important implications for the global C cycling by explaining why N addition stimulates the early stages of litter decomposition but in general does not affect longer term decomposition rates (Knorr et al. 2005). During the early decomposition phase, excess labile C availability leads to N limitation, but in later stage, decomposers become Climited as C:N of decomposing material decreases(Soong et al. 2020). We additionally find the modulating effect of topography on N addition in microbial resource limitation. Considering that most previous studies overor under-estimate N deposition effects due to ignorance of such an effect, our study highlights that topography should be included in Earth system models in order to improve predictions of ecosystem process responses to atmospheric N deposition.
Supplementary Information
The online version contains supplementary material available at https://doi.org/10.1186/s40663-021-00341-9.
Additional file 1:
Acknowledgements
We would like to thank Dr.Kun Gao, Dr. Hu Du, and Dr. Zhenchuan Wang for the assistance in fieldwork, and Dr. Lyubing Zhang for the English language editing.
Authors’contributions
Conceived and design the experiment: Hao Chen, Dejun Li. Obtained data and samples in the field: Junjie Tang. Processed samples in the lab: Junjie Tang, Xibin Sun. Analyzed the data and wrote the manuscript:Hao Chen. All authors read and approved the final manuscript.
Funding
This work was funded by the Strategic Priority Research Program of Chinese Academy of Sciences (XDA13010302), the National Natural Science Foundation of China (Nos. 31872691, 41877094, and 31760153),Guangxi Bagui Scholarship Program to Dejun Li,and National High-Level Talents Special Support Program to Dejun Li.
Availability of data and materials
The datasets used in the current study are available from the corresponding author on reasonable request.
Declarations
Ethics approval and consent to participate
Not applicable.
Consent for publication
Not applicable.
Competing interests
The authors declare that they have no competing interests.
Author details
1State Key Laboratory of Biocontrol,School of Ecology, Sun Yat-sen University, 510275 Guangzhou, China.2Key Laboratory of Agro-ecological Processes in Subtropical Region,Institute of Subtropical Agriculture,Chinese Academy of Sciences,410125 Changsha,Hunan,China.3Huanjiang Observation and Research Station for Karst Ecosystems,Institute of Subtropical Agriculture,Chinese Academy of Sciences,547100 Huanjiang,China.
Received: 8 July 2021 Accepted: 27 August 2021

杂志排行
Forest Ecosystems的其它文章
- Distribution of Panama’s narrow-range trees:are there hot-spots?
- Linkage of microbial living communities and residues to soil organic carbon accumulation along a forest restoration gradient in southern China
- Simultaneous optimization of even flow and land and timber value in forest planning:a continuous approach
- Mature stand developmental stage has ceased to constitute the most suitable habitat for the capercaillie in the Augustów Forest,Poland
- Forest disturbances and the attribution derived from yearly Landsat time series over 1990–2020 in the Hengduan Mountains Region of Southwest China
- Nutrient resorption strategies of three oak tree species in response to interannual climate variability