High temperature strain glass in Ti–Au and Ti–Pt based shape memory alloys*
2021-01-21ShuaiRen任帅ChangLiu刘畅andWeiHuaWang汪卫华
Shuai Ren(任帅), Chang Liu(刘畅), and Wei-Hua Wang(汪卫华)
1
Institute of Physics,Chinese Academy of Sciences,Beijing 100190,China
2Frontier Institute of Science and Technology,State Key Laboratory for Mechanical Behavior of Materials,Xi’an Jiaotong University,Xi’an 710049,China
Keywords: shape memory alloys,martensitic transformation,strain glass,glass transition temperature
1. Introduction
Shape memory alloys (SMAs) are one of the most important smart materials that exhibit unique properties of the shape memory effect and superelasticity, due to a ferroelastic/martensitic transformation.[1]The two main SMA systems for current commercial applications are Ti–Ni-based and Cu-based alloys.[1]However,their martensitic transformation temperatures(Ms)are generally lower than 373 K,which limits the applications of SMAs in high temperature conditions.As a result, Ti–Au and Ti–Pt high temperature SMAs (HTSMAs)have received wide attention due to their high Ms.[2–4]
Doping is an essential way to modify the martensitic transformation as well as the associated properties in SMAs.[5]However, doping usually introduces point defects into the SMAs, and thus further reduces the Ms. In recent years, it has been reported that when the martensitic transformation in SMAs is suppressed by excess doping, the system does not directly become nontransforming, but exhibits a novel glass transition.[6]As a result, the long-range strain ordered phase(i.e.,martensitic phase)is replaced by a short-range strain ordered glass state, which is termed as the “strain glass” given that the lattice strain is the order parameter of the martensitic transformation.[6]
Strain glass is characterized by several typical features,such as no enthalpy change during the glass transition observed by differential scanning calorimetry(DSC),the disappearance of thermal hysteresis in electrical resistivity curves,and no breaking of the parent phase symmetry during the glass transition in the x-ray diffraction spectrums.[7]It also exhibits some important glass transition features, including the dynamic freezing measured by dynamic mechanical analysis (DMA) experiments and the breaking down of ergodicity measured by zero-field-cooling and field-cooling(ZFC/FC)experiments.[7]Moreover, the strain glass is of potential interest for applications, because it exhibits many interesting properties, such as the superelasticity of slim hysteresis,[8]stress tuned intelligent damping properties,[9]and low-fieldtriggered large magnetostriction.[10]Unfortunately, the glass transition temperature(Tg)of current strain glass alloys is generally lower than 273 K, which not only limits the potential applications of the strain glass,but also interrupts the investigation of the nature of strain glass as well.
For example, the low glass transition temperature makes the experimental investigation of dynamic relaxation of strain glass difficult. Dynamic relaxation is an intrinsic feature of glasses, and exploring the dynamic relaxation of glasses is significant for understanding the nature of glasses.[11]The dynamic relaxation is generally measured by the DMA experiments,and the lower temperature limit of the DMA is around 130 K, as illustrated in Fig. 1. In metallic glass, thanks to their high Tg, several unique dynamic relaxation modes are observed, including primary α-relaxation, β-relaxation, and nearly constant loss, as illustrated in the loss modulus curve of a La55Ni20Al25bulk metallic glass(BMG)in Fig.1(a). In comparison, only one relaxation mode has been reported in strain glass up to now.[6,7]As shown in Fig. 1(b), there is a peak in the loss modulus curve of a Ti48.5Ni51.5strain glass alloy,close to the lower temperature limit of the DMA,which corresponds to the primary α-relaxation of the BMG.No other relaxation mode can be found except this peak,due to the low Tgof the strain glass.
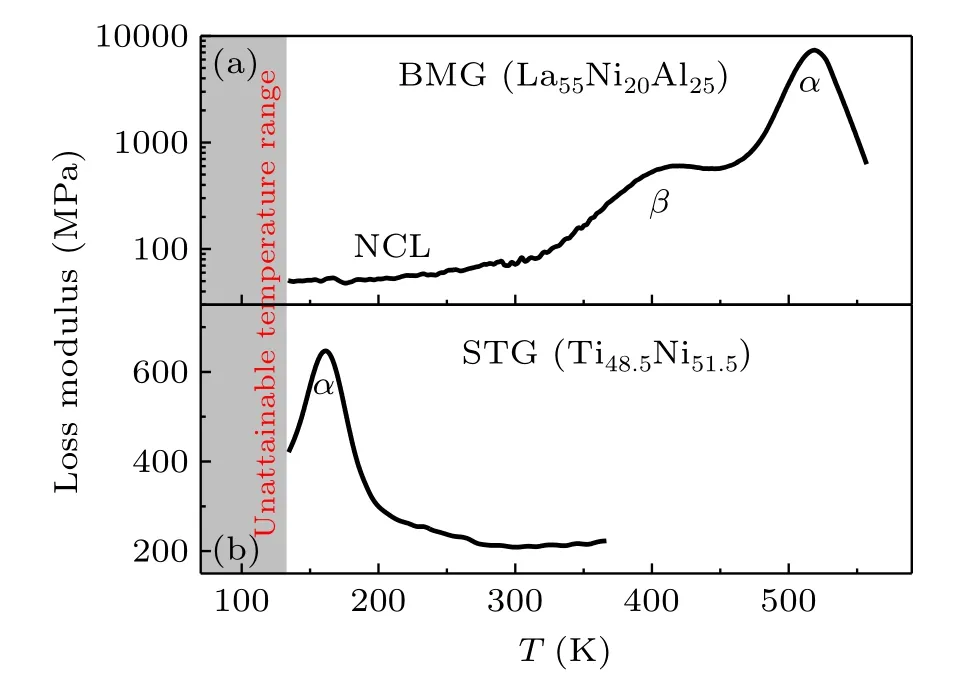
Fig. 1. Comparison of the loss modulus curve of (a) a La55Ni20Al25 bulk metallic glass(BMG)and(b)a Ti48.5Ni51.5 strain glass(STG)alloy, measured by the DMA experiment. The lower temperature limit is around 130 K.Above this limit,the BMG exhibits several relaxation modes in(a),including primary α-relaxation mode,β-relaxation mode,and nearly constant loss(NCL),while the strain glass only exhibits one α-relaxation mode in(b).
In metallic glass, the β-relaxation has been well known as one of the intrinsic dynamic relaxation modes besides the α-relaxation,which corresponds to localized cooperative motions of a small number of atoms confined in loosely packed regions.[11]If strain glass possesses the same glassy dynamics as metallic glass,the β-relaxation should exist in the strain glass in principle. Therefore, the investigation of possible βrelaxation in strain glass may provide insight into the common dynamic characteristics of these two glasses, and deepen the understanding of the nature of strain glass. However, the investigation is interrupted due to the low Tgof current strain glass systems. As a result,it is of importance to discover high temperature strain glass systems.
In Ti50Ni50xFexSMAs, the Tgof strain glass at x=6 is around 180 K,while the Msof the host alloy(i.e.,Ti50Ni50)is around 350 K.[12]On the other hand,in Ti50Pd50-xFexSMAs,the Tgof strain glass at x=14 is about 280 K,while the Msof the host alloy(i.e.,Ti50Pd50)is around 800 K.[13]The comparison between these two systems gives us a clue that the strain glass with high Tgcomes from high MsSMA systems. Therefore,we chose the two HTSMAs,Ti50Au50(Ms=893 K)and Ti50Pt50(Ms=1340 K),[2]as the host alloys and tried to find the strain glass in them. In this paper, we reported the strain glass with relatively high Tgfound in these two HTSMAs. In Ti50Au50-xCrxSMAs,strain glass appears at x=25,while in Ti50Pt50-yFeySMAs, strain glass takes place at y=30. Owing to the very high Msof the host alloys, these two systems both exhibit a relatively large ideal glass transition temperature(T0), which is comparable with the highest T0value reported until now.
2. Experimental methods
Samples of Ti50Au50-xCrx(x =15, 25, abbreviated by Crx hereafter) and Ti50Pt50-yFey(y=25, 30, abbreviated by Fey hereafter) alloys were prepared from highly pure metals(>99.95 at.%) by arc-melting under an argon atmosphere.The ingots were solution-treated at 1373 K for 12 h in evacuated quartz tubes,followed by water quenching. Then the ingots were cut into suitable shapes for different measurements.Latent heat of transformation was measured with a differential scanning calorimeter (DSC-Q200 from TA Company) with a cooling/heating rate of 10 K/min. Electrical resistivity (ER)of specimens was measured through a four-probe method with a constant current of 100 mA and a cooling/heating rate of 2 K/min. The anelasticity was detected by dynamic mechanical analysis(DMA-Q800 from TA Instruments)using a cooling rate of 2 K/min with a single cantilever mode in the frequency range from 0.2 Hz to 20 Hz.
3. Results and discussion
Figures 2(a1) and 2(a2) exhibit the DSC curves of Ti50Au50-xCrxSMAs. Sharp heat flow peaks are observed during cooling and heating for Cr15 of which the Msis around 385 K,while the heat flow peaks disappear for Cr25. It means that 25 at.% of chromium is enough to suppress the martensitic transformation in Ti–Au SMAs. On the other hand,in Ti50Pt50-yFeySMAs, the doping of 25 at.% iron is still not high enough to lead to the suppression of the martensitic phase. As shown in Fig.2(b1), weak heat flow peaks are detected for Fe25(Ms=403 K),while figure 2(b2)shows that it requires 30 at.%of iron to completely suppress the formation of the martensitic phase.
Figure 3 exhibits the ER curves with different doping levels for these two systems respectively. Because the martensitic transformation is the first order phase transformation in thermodynamics, it always exhibits a thermal hysteresis loop in the ER curve during cooling and heating. As shown in Fig. 3(a1), a clear thermal hysteresis loop takes place in the ER curve of Cr15, while no hysteresis loop is observed for Cr25 in Fig. 3(a2). It means that the martensitic transformation still exists in Cr15,whereas there is no martensitic transformation in Cr25. A similar case is found in Ti50Pt50-yFeySMAs.The absence of hysteresis loop in the ER curve of Fe30 in Fig.3(b2)indicates that there is no martensitic transformation in Fe30 either.Thus,the ER curves are consistent with the DSC results. Both of them indicate that the martensitic transformations in the two HTSMAs can be completely suppressed by doping excess point defects.
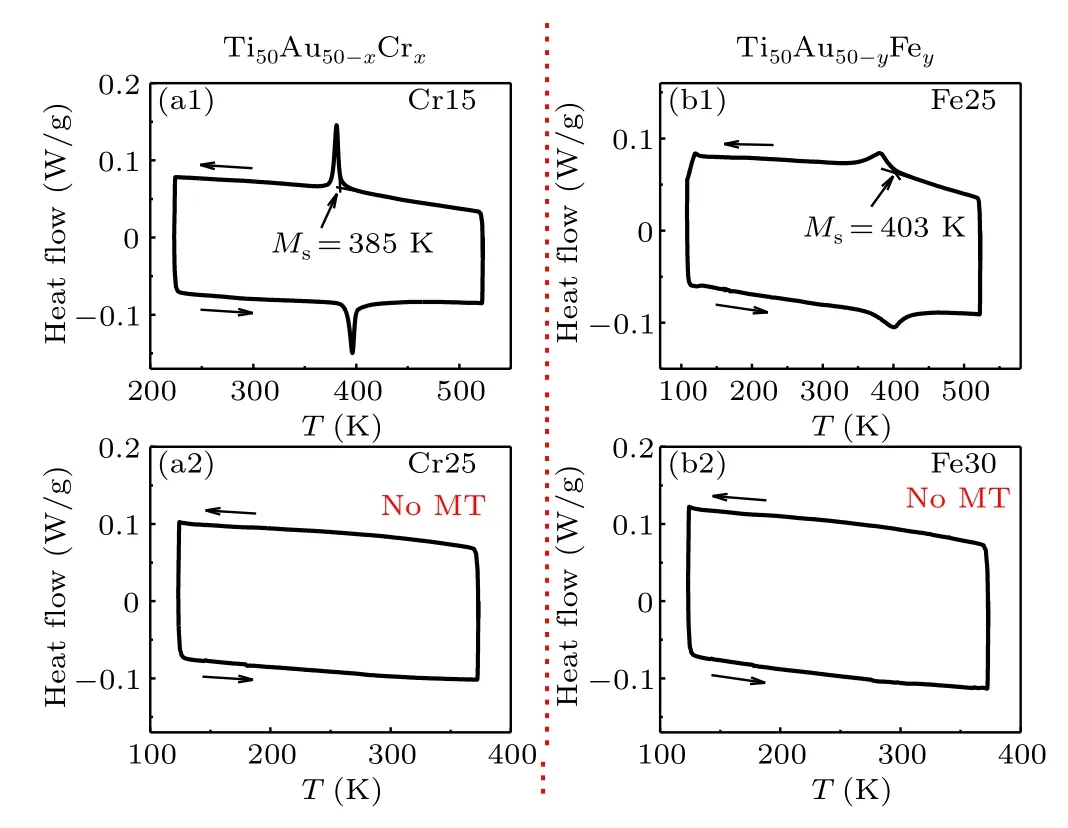
Fig. 2. DSC curves of Ti50Au50-xCrx and Ti50Pt50-yFey alloys. Heat flow peaks can be observed in(a1)Cr15 and(b1)Fe25, while there is no peak in(a2)Cr25 and(b2)Fe30.
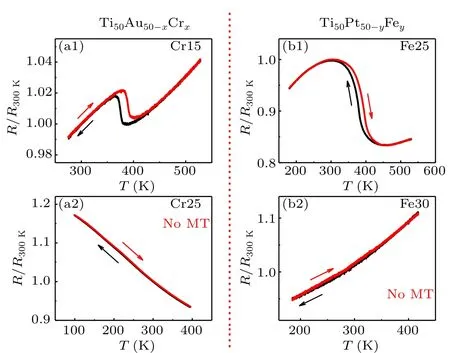
Fig.3. ER curves of Ti50Au50-xCrx and Ti50Pt50-yFey alloys. Thermal hysteresis loops can be observed in(a1)Cr15 and(b1)Fe25,while the hysteresis loop disappears in(a2)Cr25 and(b2)Fe30.
It is noted that the strain glass in Ti–Au–Cr alloys exhibits a negative temperature dependence of electrical resistivity in Fig. 3(a2), while the strain glass in Ti–Pt–Fe alloys shows a positive temperature dependence in Fig.3(b2). The electrical resistivity has been well known to be sensitive to the phase structure of the nanodomains in strain glass.[12,14–16]Thus,the difference in the temperature dependence of electrical resistivity suggests that the phase structure of the nanodomains in these two strain glasses is remarkably different,which is worthy to be investigated in the future.
The storage modulus and tanδ curves of Cr25 and Fe30 are shown in Fig. 4 respectively. In Fig. 4(a), there are two anomalies in the storage modulus curves of Cr25 upon cooling. The first anomaly appears around 300 K, and exhibits a frequency dependent behavior, namely, the dip temperatures in storage modulus decrease with frequency lowering. Corresponding to the dip in storage modulus, the tanδ exhibits a peak,and the peak temperatures show the same frequency dependent behavior. This frequency dependent behavior is a typical glass feature for strain glass as previously reported,which indicates the slowing-down of dynamics during the strain glass transition.[6,7]It thus corresponds to the primary α-relaxation in metallic glass, as shown in Fig. 1(a). The frequency dependence of the dip can be fitted by the Vogel–Fulcher(V–F)relation ω =ω0exp[-Ea/kB(Tg-T0)],[6,7]where ω is the oscillating frequency,ω0the frequency at infinitely high temperature,Eathe activation energy,kBthe Boltzmann constant,Tgthe strain glass transition temperature, and T0the ideal freezing temperature. For convenience, we use the T0to compare the glass transition temperatures of different systems below.According to the V–F relation, the ideal freezing temperature T0is about 251 K.
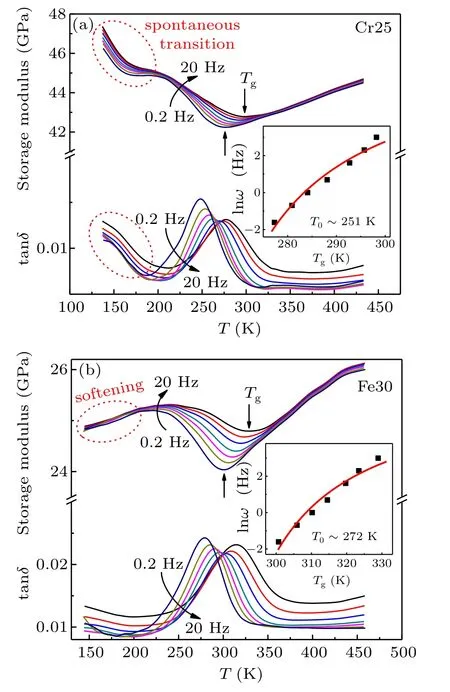
Fig. 4. (a) Storage modulus and tanδ curves of Ti50Au25Cr25 (Cr25).Two anomalies are detected in the curves. The anomaly around 290 K exhibits a frequency dependent behavior,corresponds to the strain glass transition. By fitting the V–F relation in the inset of(a),the ideal freezing temperature T0 is around 251 K.The other anomaly around 160 K in the storage modulus curve corresponds to a spontaneous transition from strain glass to martensite. (b) Storage modulus and tanδ curves of Ti50Pt20Fe30 (Fe30). The anomaly around 320 K corresponds to the strain glass transition. According to the V–F relation in the inset of(b),the T0 is around 272 K.Upon cooling,a modulus softening is observed at low temperatures.
With further cooling, another dip in the storage modulus curves of Cr25 appears around 150 K in Fig.4(a). Meanwhile,the intensity of tanδ increases correspondingly,but the peak cannot be detected. This second anomaly indicates that a spontaneous transition from the strain glass(the frozen local strain ordered state)to martensite(the ferroelastic phase with long-range strain ordering) takes place. Such a spontaneous transition has been widely found in strain glass alloys,[17–19]which suggests that the strain glass is not the ground state of the system at low temperatures.
The storage modulus and tanδ curves of Fe30 are shown in Fig.4(b). Only one anomaly is clearly found around 320 K,which exhibits the frequency dependent behavior of the dip temperatures in storage modulus and the corresponding peak temperatures in tanδ, the same as the first anomaly of Cr25.By fitting the V–F relation,T0is about 272 K.When the temperature further decreases,no second anomaly can be detected.Despite the absence of the second anomaly,the modulus softening is observed upon cooling below 230 K,which is known as a signal of the onset of the martensitic transition.[18]It suggests that the second anomaly actually exists, but locates at a low temperature below the lower limit of the DMA experiment. As a result, only the strain glass transition is clearly observed for Fe30 by the DMA experiment.

Fig. 5. Summary of the T0 of current main strain glass alloy systems.The data of Ti–Ni-based strain glasses come from Refs. [6,12,19,20],the data of Ti–Pd-based strain glasses are from Ref.[13], and the data of ferromagnetic strain glass alloys come from Refs.[10,20,21].
These two new strain glass systems exhibit a relatively high ideal freezing temperature T0, as compared with other systems. Figure 5 summarizes the T0of current main strain glass systems. In Ti–Ni-based strain glass alloys, T0is generally lower than 200 K.[6,12,19,20]Ti–Pd-based strain glass alloys exhibit a relatively high T0, which is around 250 K.[13]As for the ferromagnetic strain glass(FSTG)alloys,the highest T0is also around 250 K.[10,21,22]Thus, the highest T0of current strain glass systems is around 250 K. In comparison,the T0of the Ti50Au25Cr25strain glass alloy is about 251 K,which is comparable with the highest T0value,and that of the Ti50Pt20Fe30strain glass alloy is about 272 K, which is even higher than the T0maximum of the current main strain glass alloys.
Although the strain glass in the Ti50Pt20Fe30alloy exhibits the highest T0so far,it is not high enough as expected,given that the host alloy Ti50Pt50exhibits a quite high Ms(~1340 K).[2]Figure 6 compares the phase diagrams of several Ti-based alloys.[12,13]The composition dependence of the transformation behavior is similar for these four systems:there is a critical defect concentration separating the martensitic phase and strain glass. It is noted that as the Msof the host alloy increases, the critical defect concentration strongly increases,whereas the increase of the T0is limited. As a result,although the Ti–Pt-based alloys start from the pure Ti50Pt50host alloy with high Ms(~1340 K),much higher than the Msof the pure Ti50Pd50host alloy(~800 K)in Ti–Pd-based alloys,the T0of the strain glass in Ti–Pt-based alloys(~272 K)is only slightly higher than that of the strain glass in Ti–Pdbased alloys(~250 K).
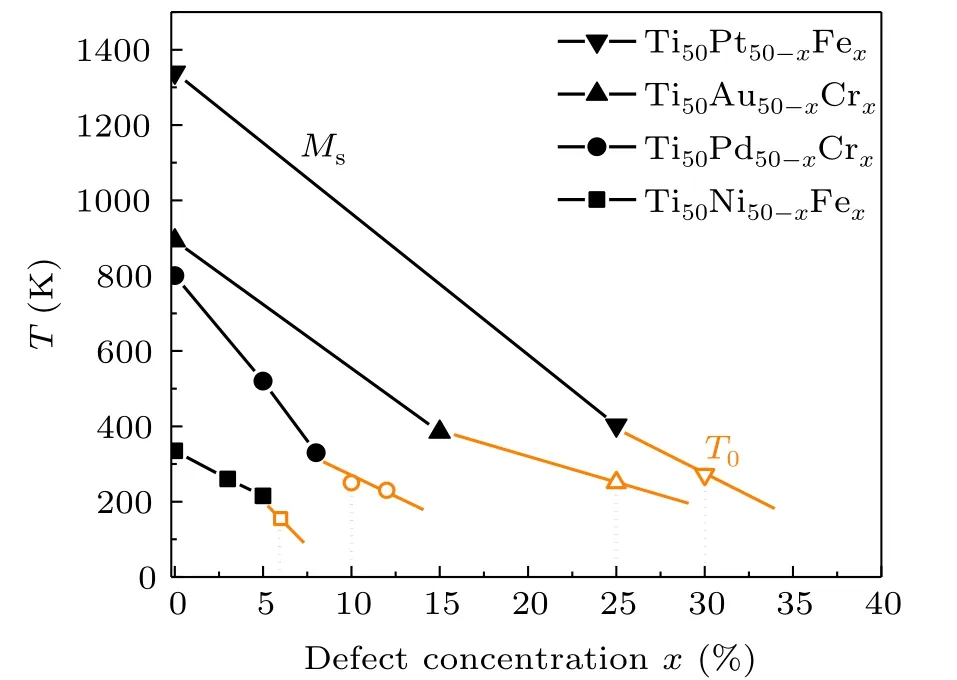
Fig.6. Comparison of the phase diagrams of Ti-based SMAs. The critical defect concentration for each system is labeled by the red dot line.The data of Ti50Ni50-xFex and Ti50Pd50-xCrx come from Refs.[12,13],and the data of Ti50Pt50 and Ti50Au50 are from Ref.[2].
Obviously, doping point defects is not an effective way to further increase the T0of strain glass above ambient temperature. According to the phenomenological model of strain glass,[23]point defects generally introduce two effects to the martensitic system: One is a global effect,which changes the global thermodynamic stability of martensite;the other is a local effect,which leads to a fluctuation in local thermodynamic stability of martensite. In most cases,the global effect of point defects is to decrease the Ms,which causes a strong transition temperature decrease before the system goes to the strain glass and thus results in a low T0.
Besides the point defects,some other crystallographic defects such as dislocations[24]and nanoprecipitates[25,26]have also been reported to be able to suppress the martensitic transformation and generate a frozen strain glass state. Moreover,it is reported that the dislocations and nanoprecipitates can maintain the T0of strain glass better than the point defects.[24]The reason is that the global effect of dislocations is negligible,while nanoprecipitates sometimes may lead to an opposite global effect as compared with point defects(for example,the Msof the B2-R martensitic transition in Ti–Ni SMAs increases due to the Ti3Ni4precipitation[5]). Thus, a potential solution to design high T0strain glass alloys is to choose a host alloy with high Msand introduce other defects such as dislocations and nanoprecipitates in it,which requires a further study in the future.
Moreover, in ferromagnetic shape memory alloys which are an important subgroup of SMAs,the global effect of point defects may vary due to the magnetoelastic coupling. For example, in Co-doped Ni–Mn–Ga ferromagnetic strain glass alloys, the Msfirst keeps constant rather than decreases with doping cobalt,and the T0in this system is actually comparable with that of strain glass in Ti–Pd-based SMAs.[21]Thus,ferromagnetic shape memory alloys are also a promising candidate to exhibit high T0,worthy to be further investigated.
4. Conclusion
We found high temperature strain glass in Ti–Au-based and Ti–Pt-based HTSMAs. The critical defect concentration for Ti50Au50-xCrxalloys is around x = 25, while that for Ti50Pt50-yFeyalloys is about y=30. The T0of strain glass in Ti–Au-based alloys is around 251 K,and that of strain glass in Ti–Pt-based alloys is around 272 K.Both of them are comparable with the highest T0value so far. This work suggests that doping point defects is not an effective way to increase the T0above the ambient temperature,some other methods are required to find the strain glass with higher T0.
猜你喜欢
杂志排行

Chinese Physics B的其它文章
- Two-dimensional finite element mesh generation algorithm for electromagnetic field calculation*
- Stable water droplets on composite structures formed by embedded water into fully hydroxylated β-cristobalite silica*
- Surface active agents stabilize nanodroplets and enhance haze formation*
- Synchronization mechanism of clapping rhythms in mutual interacting individuals*
- Theoretical study of the hyperfine interaction constants,Land´e g-factors,and electric quadrupole moments for the low-lying states of the 61Niq+(q=11,12,14,and 15)ions*
- Ultrafast photoionization of ions and molecules by orthogonally polarized intense laser pulses: Effects of the time delay*