57Fe M¨ossbauer spectrometry: A powerful technique to analyze the magnetic and phase characteristics in RE–Fe–B permanent magnets*
2021-01-21LizhongZhao赵利忠XuefengZhang张雪峰MiYan严密ZhongwuLiu刘仲武andJeanMarcGreneche
Lizhong Zhao(赵利忠), Xuefeng Zhang(张雪峰), Mi Yan(严密),Zhongwu Liu(刘仲武), and Jean-Marc Greneche
1Institute of Advanced Magnetic Materials,College of Materials&Environmental Engineering,Hangzhou Dianzi University,Hangzhou 310018,China
2State Key Laboratory of Silicon Materials,School of Materials Science and Engineering,Key Laboratory of Novel Materials for Information Technology of Zhejiang Province,Zhejiang University,Hangzhou 310027,China
3School of Materials Science and Engineering,South China University of Technology,Guangzhou 510640,China
4Institut des Mol´ecules et Mat´eriaux du Mans CNRS UMR-6283,Le Mans Universit´e,Le Mans F-72085,France
Keywords: 57Fe M¨ossbauer spectrometry, Nd–Fe–B-based permanent magnets, (Ce,Nd)2Fe14B phase, grain boundary phase
1. Introduction
The57Fe M¨ossbauer spectrometry is a high sensitivity local probe technique for studying solid materials containing Fe such as powders, fine and ultrafine particles, ribbons,thin films, and frozen ferrofluids. Indeed, it provides a diverse of useful information on the chemical, structural, electronic, magnetic structure of Fe nuclei, the Fe atomic moments, the second-order crystal fields, and the metallurgical phase composition of Fe-based alloys.[1,2]Nd–Fe–B-based magnets have been one of the most powerful permanent magnets since their discovery in the 1980s.[3,4]Therefore,numerous M¨ossbauer studies on the series of RE2Fe14B alloys(RE=rare-earth elements)have been reported during the 1980s and 1990s.[5–8]They have led to a deeper understanding of the relationships between the structural and magnetic properties as a function of temperature, the influence of the RE elements,the influence of the method of elaboration, and that of postsynthesis treatment mainly by annealing and the chemical and corrosion resistance. It is noted that some of these alloys have been studied by using other M¨ossbauer isotopes such as151Dy,155Gd,166Er, and174Yb,[9–12]which show two expected inequivalent RE sites and agree with the crystallographic structure. Thereafter, this technique was rarely used since the hyperfine structures of the RE2Fe14B phase were rather well understood. But recently, several interesting topics have been discussed and the57Fe M¨ossbauer spectrometry seems to be a powerful technique to provide relevant information on the problems involved.
Among these new topics,Ce,the most abundant rare earth(RE) element, has attracted increasing attention as a promising alternative to Nd/Pr in the 2:14:1-type permanent magnets because of its outstanding advantages of mitigating the RE criticality, reducing the material cost, and balancing the use of RE.[13–16]However, the phase constitution and microstructure of the Ce-containing magnets differ from those of traditional Pr–Nd-based magnets.[17,18]Furthermore, the hyperfine structures of Ce2Fe14B and Ce-containing RE2Fe14B phases have not been completely defined in the last decades as they have few applications. Therefore,the study of hyperfine structures can not only complement the hyperfine structures of the RE2Fe14B phases, but also reveal the phase constitution and microstructure of the Ce-contained RE–Fe–B magnets. Moreover, it is well established that the coercivity of Nd–Fe–B-based magnets is strongly correlated with the magnetism of the secondary phase,especially for the grain boundary(GB)phase.[19,20]Unfortunately,its influence on coercivity has not been well understood due to its relatively low content and small size. Most of the available structure characterization techniques, i.e., high-resolution transmission electron microscopy (HRTEM),[21]three-dimensional atom probe,[20]and electron holography,[22]have clearly demonstrated the local information of an individual GB phase. However, it is still necessary to interpret the whole information of the GB phases in the bulk magnet. As the magnetism of the GB phase is mostly originated from the Fe atoms, the57Fe M¨ossbauer spectrometry, which can identify the typical phase with the Fe content higher than about 2 at%,[23,24]is probably a suitable technique to reveal the global information of different Fecontaining phases, especially for the low fraction GB phase.But it is important to emphasize that modeling of the hyperfine structures is a crucial step in the interpretation of the M¨ossbauer spectra,since the hyperfine structure of the native Nd–Fe–B phase comprising six different Fe phases has already been difficult to describe.
After a reminder of some generalities about the hyperfine interactions observed in57Fe M¨ossbauer spectroscopy,this review will firstly introduce the fitting model of the 2:14:1 phases with different REs. Then, the hyperfine structures of the Ce-contained RE–Fe–B magnets are well defined to understand their phase constitution and microstructure. Thereafter,the hyperfine structures of the low-content secondary phases are analyzed to interpret their temperature,composition,structure, and process-dependent magnetism. At last, their influences on the magnetic properties are well revealed. Thus,this review may inspire more applications of the57Fe M¨ossbauer spectrometry in the area of Fe-based permanent magnets.
For the M¨ossbauer measurements, all samples including ribbons,cast rods,and bulk magnets mentioned in this review were hand-milled into fine powders with size <100 μm to reduce the effects of anisotropy on these results. All values of isomer shift are reported relative to that of α-iron foil at room temperature.
2. The hyperfine structures of the RE2Fe14B phase
2.1. Introduction to the hyperfine parameters observed by 57Fe Mo¨ssbauer spectroscopy
The interaction between the57Fe nucleus probe and its surrounding electronic environment is magnetic and/or electrostatic in nature and is known as the hyperfine interaction.The electrostatic interaction between the57Fe nucleus probe and its surrounding free electrons,as well as the bounded electrons of the surrounding atoms,causes the isomer shift δ and the quadrupole splitting ΔEQcharacteristic in the M¨ossbauer spectra. The interaction between the nuclear magnetic dipole moment and the magnetic induction created by the electrons at the nucleus, surrounding magnetic moments, and a possible external magnetic field results in the magnetic hyperfine splitting of the M¨ossbauer spectra. As shown in Fig.1(a),the M¨ossbauer atoms, located in the source and in the absorber,are generally presented in different chemical environments.Consequently, the M¨ossbauer absorption line shifts in proportional to the difference in the electron charge density at the nucleus in the absorber and in the source, which is defined as the isomer shift δ (mm/s), as shown in Fig. 1(b).The value of δ is highly dependent on the valence state of the57Fe atom in the absorber and decreases with increasing temperature. Specifically,δ of the metallic iron in RE2Fe14B phases should be in the range of -0.1 mm/s to 0.2 mm/s at 300 K. An asymmetric charge of the atomic surrounding the M¨ossbauer nucleus, combined with a non-spherical distribution of the charge within the nucleus, gives rise to a quadrupole interaction. In this case, the M¨ossbauer spectrum of a random powder sample results from a quadrupolar doublet composed of Lorentzian lines of the same intensity, and the corresponding hyperfine parameters are the isomer shift and the splitting between the two lines, which is defined as the quadrupole splitting ΔEQ(mm/s), as shown in Figs. 1(a)and 1(b). Figures 1(c) and 1(d) indicate that the magnetic hyperfine splitting from the magnetic Zeeman interaction has six possible transitions,resulting in the(Zeeman)sextet composed of six absorption lines with Lorentzian profile. In the case of α-iron, the room temperature magnetic splitting is 10.67 mm/s and corresponds to a magnetic induction or hyperfine field(Bhfin T)of 33 T.The line intensities are typically 3:x:1:1:x:3,where x=4sin2β/(2-sin2β)and β represents the angle between the hyperfine field held by the nucleus probe and the propagation direction of the γ-beam. In the case of a powdered sample, x=2, due to the randomly distributed orientations of the Fe magnetic moments. When the magnetic moments are oriented parallel(perpendicular)to the γ-beam, the intermediate lines disappear (increase), and we have 3:0:1:1:0:3(3:4:1:1:4:3); such configuration occurs in a perfect ferromagnetic or ferrimagnetic (antiferromagnetic)material submitted to an applied field parallel to the γ-beam which is sufficiently large to saturate the magnetization. The overall splitting of a sextet is proportional to the magnetic induction, which is defined as hyperfine field Bhf.Common situations combine monopolar,quadrupolar electric interaction and dipolar magnetic interaction; in such a case,one does consider whether or not the quadrupolar interaction prevails the magnetic interactions: when the quadrupolar interaction is small compared to the dipolar magnetic interaction, it is considered as a perturbation term giving rise to the quadrupolar shift (2ε in mm/s). Eventually, the typical hyperfine structure of the M¨ossbauer spectrum must consist of the superposition of elementary quadrupolar and/or magnetic components, where these components have the same number as the Fe sites and their relative absorption is related to the relative proportion of the respective Fe species.

Fig.1.Shift and splitting of nuclear levels of57Fe nucleus by the hyperfine interactions and expected corresponding M¨ossbauer spectra:electric quadrupole splitting ΔEQ (a)and the related doublet spectrum(b), magnetic hyperfine splitting that is a nuclear Zeeman splitting(c)and the related sextet spectrum(d). Bhf is the magnitude of the hyperfine magnetic field at nucleus,and δ is the isomer shift).
2.2. The fitting model for the RE2Fe14B phase
According to the crystal structure of the RE2Fe14B phase as shown in Fig.2(a),56 Fe atoms are contained in a single elementary cell,which are located at 6 sites,i.e.,16k1,16k2,8j1,8j2, 4e, and 4c.[25]The hyperfine interaction for these 6 sites is different from each other due to their chemical surroundings, so that the 6 sites correspond to 6 individual sextets in the M¨ossbauer spectra. Consequently, the spectrum obtained from the experiments is the superposition of these 6 sextets,as shown in Fig. 2(b), whose assignments are based on the Wigner–Seitz analysis of the crystal structure. To begin with,the relative absorption areas of the 6 sextets for 16k1, 16k2,8j1,8j2,4e,and 4c sites are constrained to the site populations,i.e.,16:16:8:8:4:4. In addition,the major contribution to the Bhfhyperfine field is due to the Fermi contact term. The transferred field from the iron near-neighbors depends on their number. The larger the number is, the larger the Bhfwill be.The largest Bhfbelongs to the 8j2site since it has 12 nearest neighboring Fe atoms, which corresponds to the widest sextet (pink) shown in Fig. 2(b). The 16k1and 16k2sites both have 10 nearest neighboring Fe atoms, but the Bhfof 16k1is smaller than that of 16k2due to its neighboring B atoms.After the assignment of 16k1,16k2sites,the assignment of 8j1and 8j2is easy just by considering its fixed proportion. Then, the numbers of the nearest neighboring Fe atoms for sites 4e and 4c are 9 and 8,respectively. Finally,the order of Bhffor the 6 sextets is defined as 8j2>16k2>16k1>4e>8j1>4c.
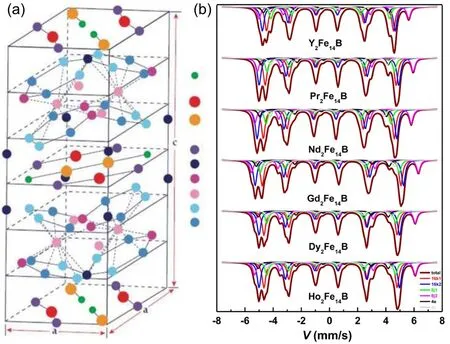
Fig. 2. (a) Crystal structure of the Nd2Fe14B phase; (b) 57Fe M¨ossbauer spectra of the RE2Fe14B phase at 295 K.[8]
Based on the above-mentioned order, the spectra of RE2Fe14B phases at room temperature have been well fitted by Long et al. for different RE elements, i.e., Y, Pr, Nd, Gd,Dy,and Ho,[8]with their corresponding hyperfine parameters of Bhf, 2ε, and δ listed in Table 1. The values of 2ε and δ exhibit a minor change with the different REs, since both are strongly correlated with the crystal structure.Whereas,the average value of Bhfincreases from Y to Gd first and decreases subsequently after reaching a peak for the Gd2Fe14B phase.Unfortunately, the hyperfine structures of Ce2Fe14B and Cecontained RE2Fe14B phases are absent in their work.
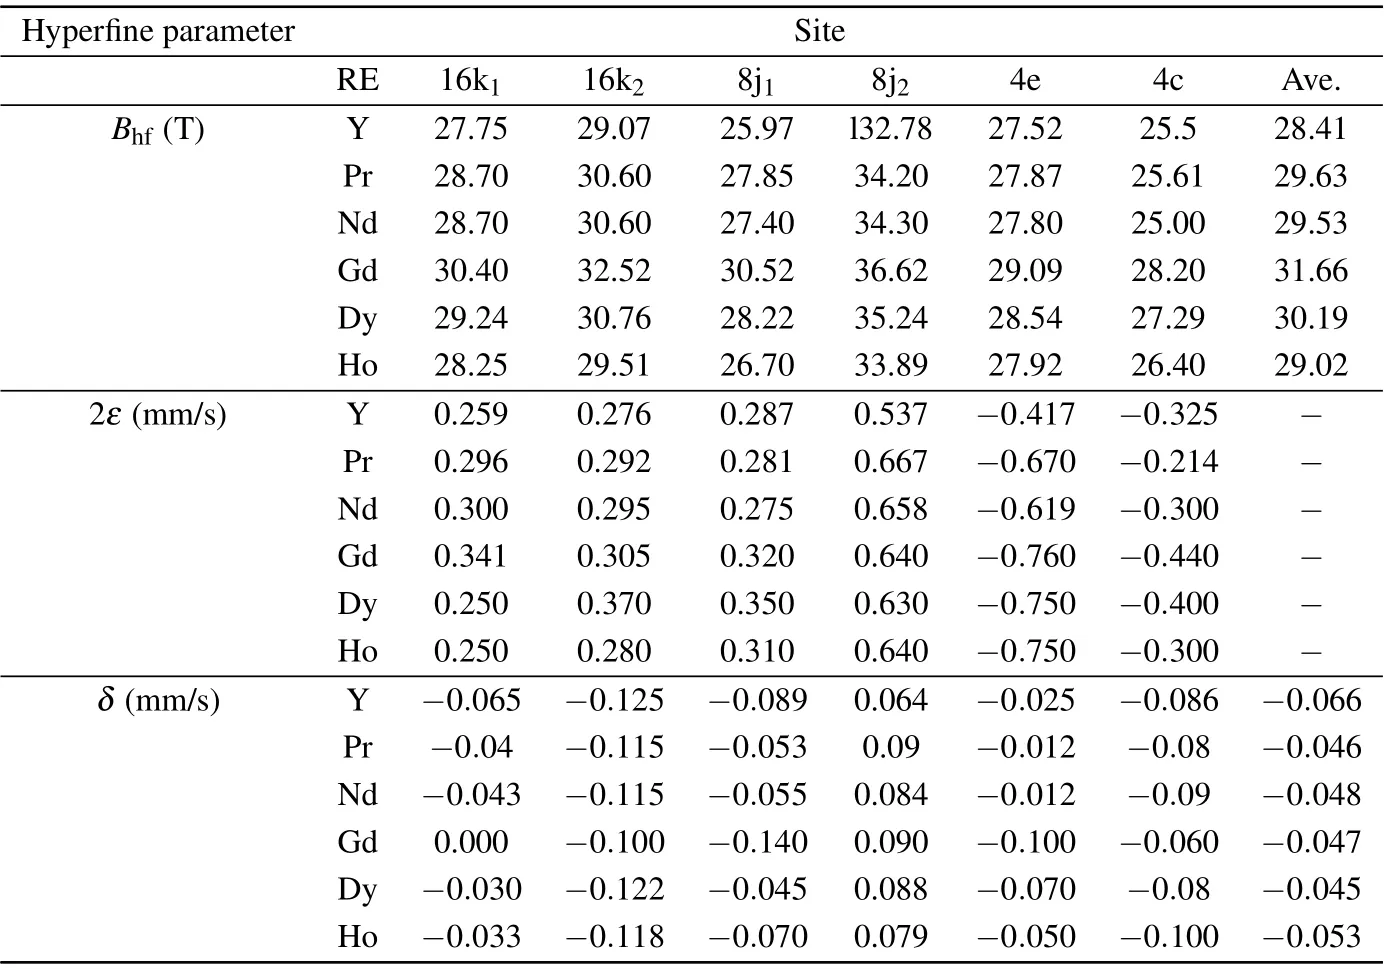
Table 1. Typical values of the hyperfine parameters of RE2Fe14B phases at 295 K.[8]
2.3. The spectra of Ce2Fe14B phase
The nanocrystalline ribbon Ce16Fe78B6is prepared by melt-spinning technique.[26]Its refined XRD patterns shown in Fig. 3 indicate that the alloy is well crystallized and composed of 85±1 wt.%Ce2Fe14B phase and 15±1 wt.%CeFe2phase.

Fig.3. Refined XRD pattern of the as-spun Ce16Fe78B6 sample.[26]
The57Fe M¨ossbauer spectrometry is used to study the hyperfine structure of the Ce2Fe14B phase,which is fitted based on the model described above. As reported in Fig.4,the fitted room temperature spectra of the Ce2Fe14B phase combined with six sextets corresponding to 6 different Fe sites are compared with those of Nd2Fe14B phases,and its refined hyperfine parameters are recorded in Table 2. It is clear that the overall shape of the Ce2Fe14B spectrum is very similar, but with the reduced spectrum width comparing with that of the Nd2Fe14B spectrum. The hyperfine fields at the six Fe sites(16k1,16k2,8j1, 8j2, 4e, and 4c) are estimated to be 22.5, 24.0, 21.1,28.1,22.2,and 18.8 T(±0.5 T),respectively,which are much smaller than those of 28.7, 30.6, 27.4, 34.3, 27.8, and 25.0 T for the Nd2Fe14B phase. Accordingly, by using the 15 T/μBrule, the magnetic moment of each site for the Ce2Fe14B phase can be calculated as 1.5, 1.6, 1.4, 1.9, 1.5 and 1.3 μB(±0.05 μB), and the total magnetic moment of Fe atoms in Ce2Fe14B is 22.4±1.0 μB. The total magnetic moment μf.u.of Ce2Fe14B at room temperature is calculated as 23.3 μBby using the saturation magnetization of Js=1.17 T, which is slightly larger than the total moment of Fe (22.4±1.0 μB).Therefore, the Ce atom also contributes to the total moment, and the moment could be estimated in the range of 0.5 μB, which is slightly larger than the reported value of 0.1 μBobtained from the soft x-ray magnetic circular dichroism measurement.[27]
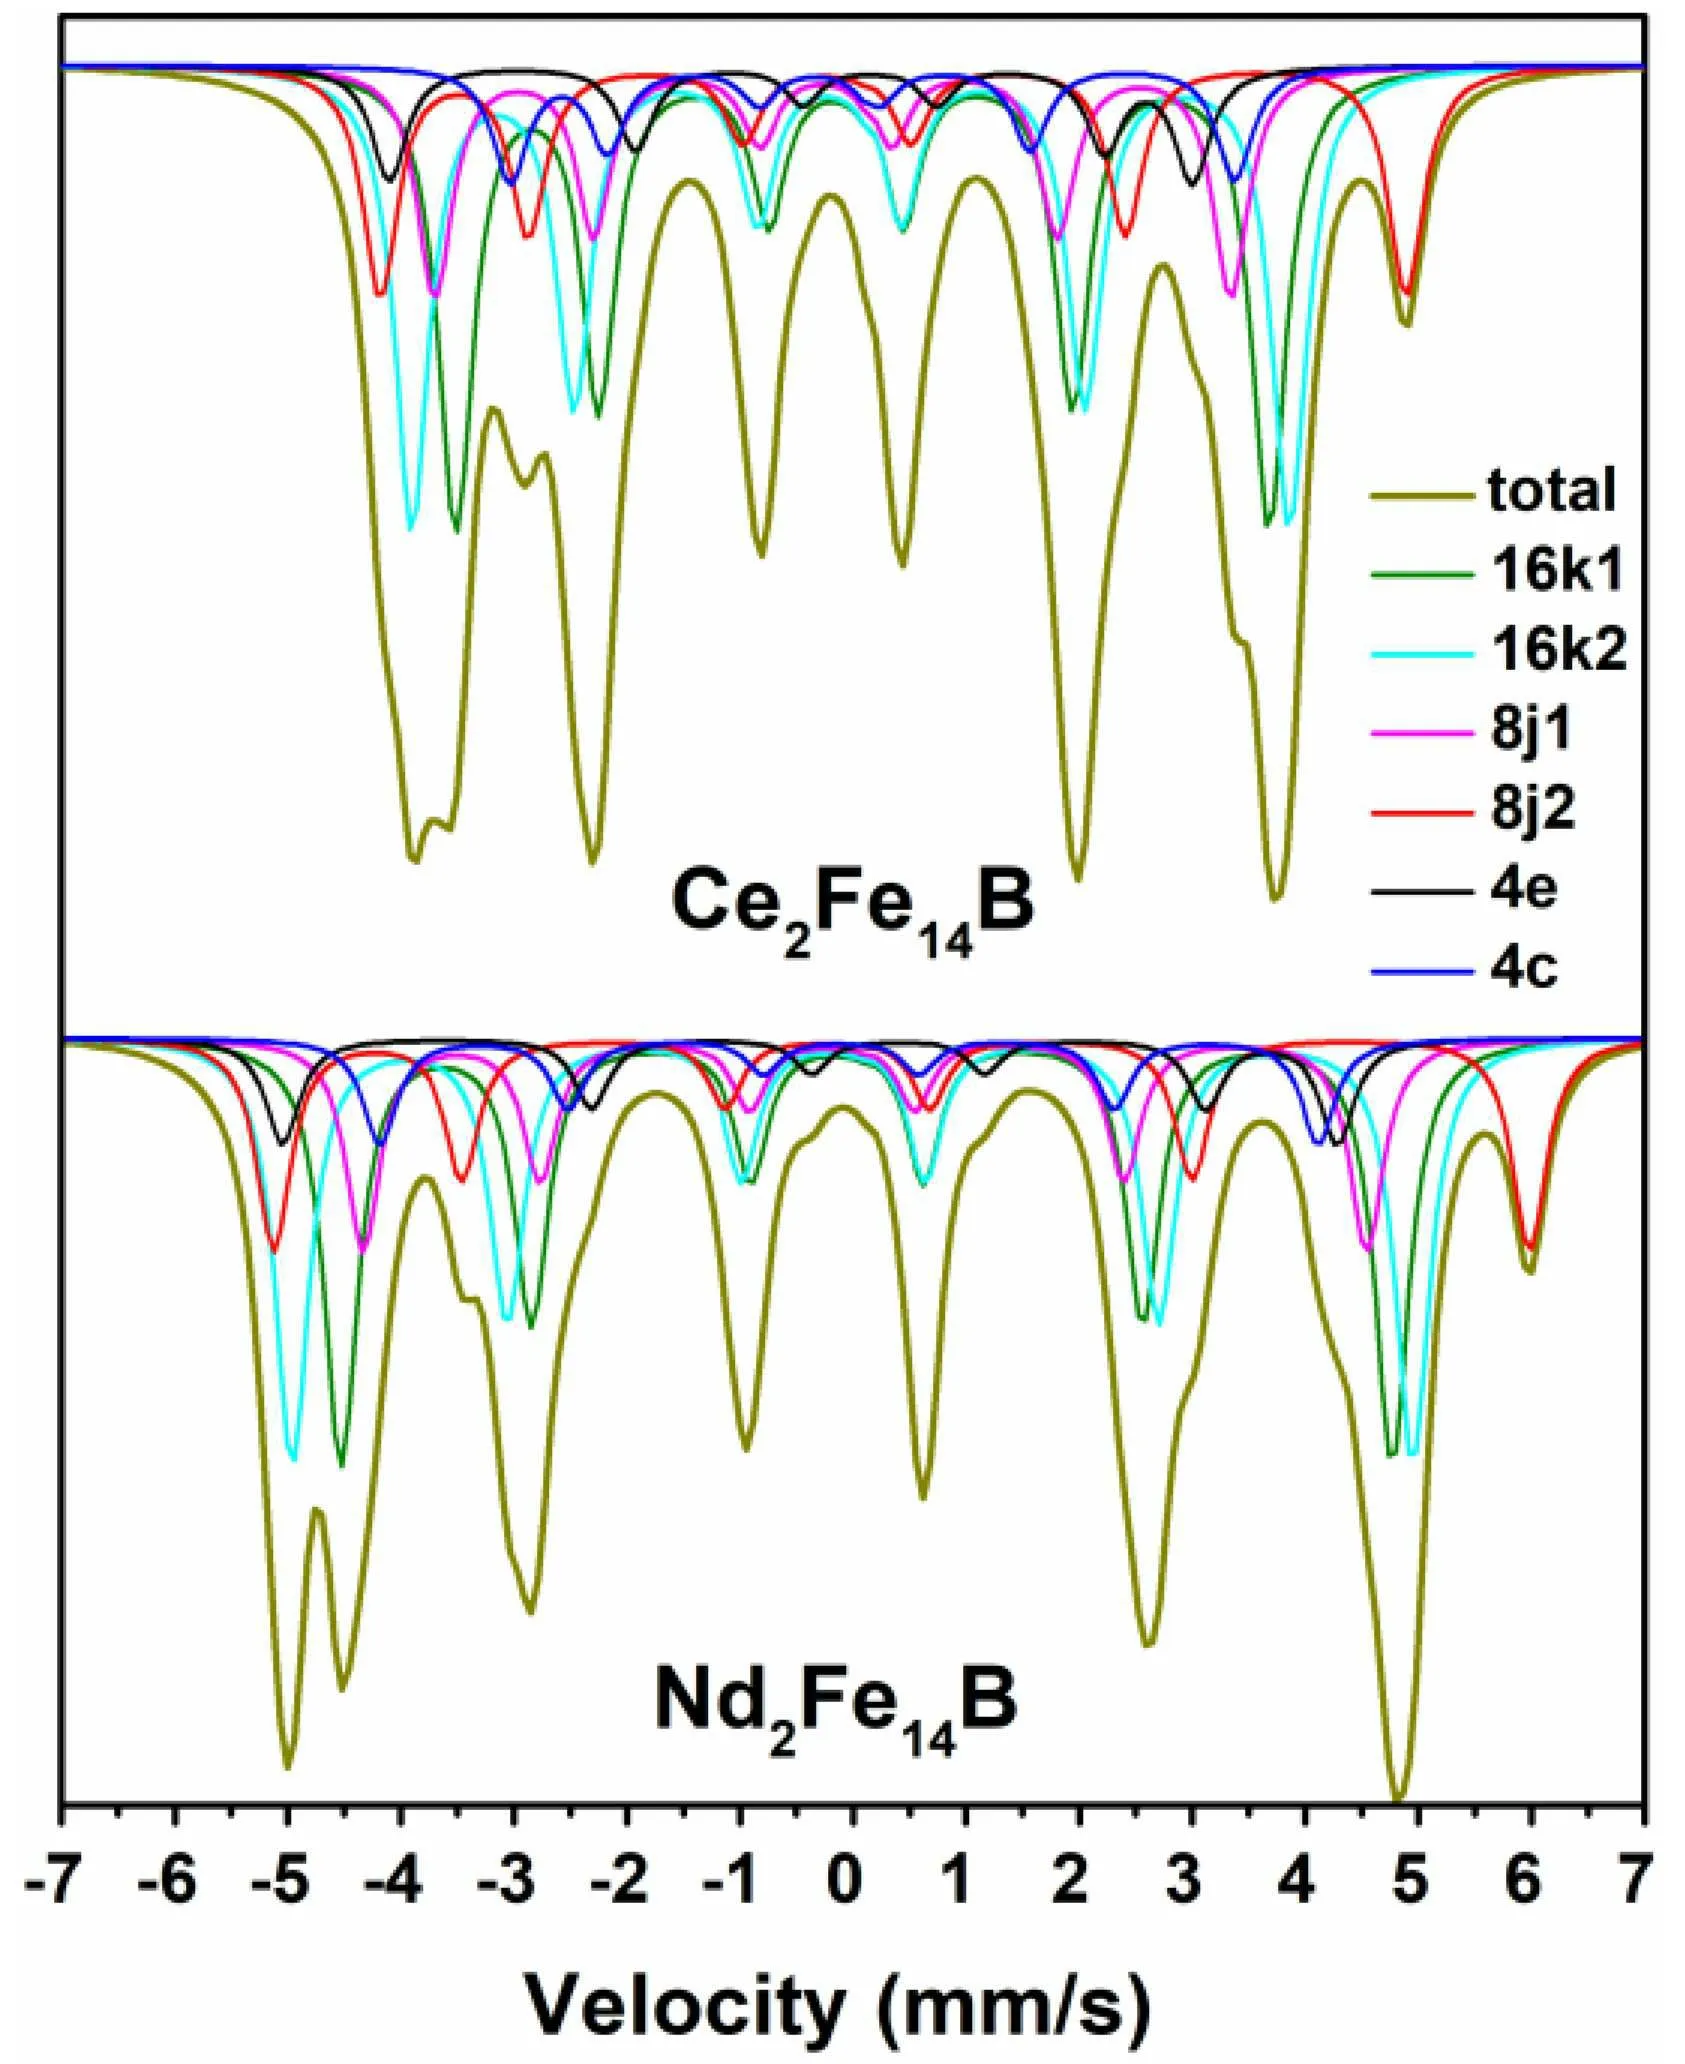
Fig. 4. M¨ossbauer spectra of the as-melt spun Ce16Fe78B6 alloy obtained at 300 K and 77 K.[26]
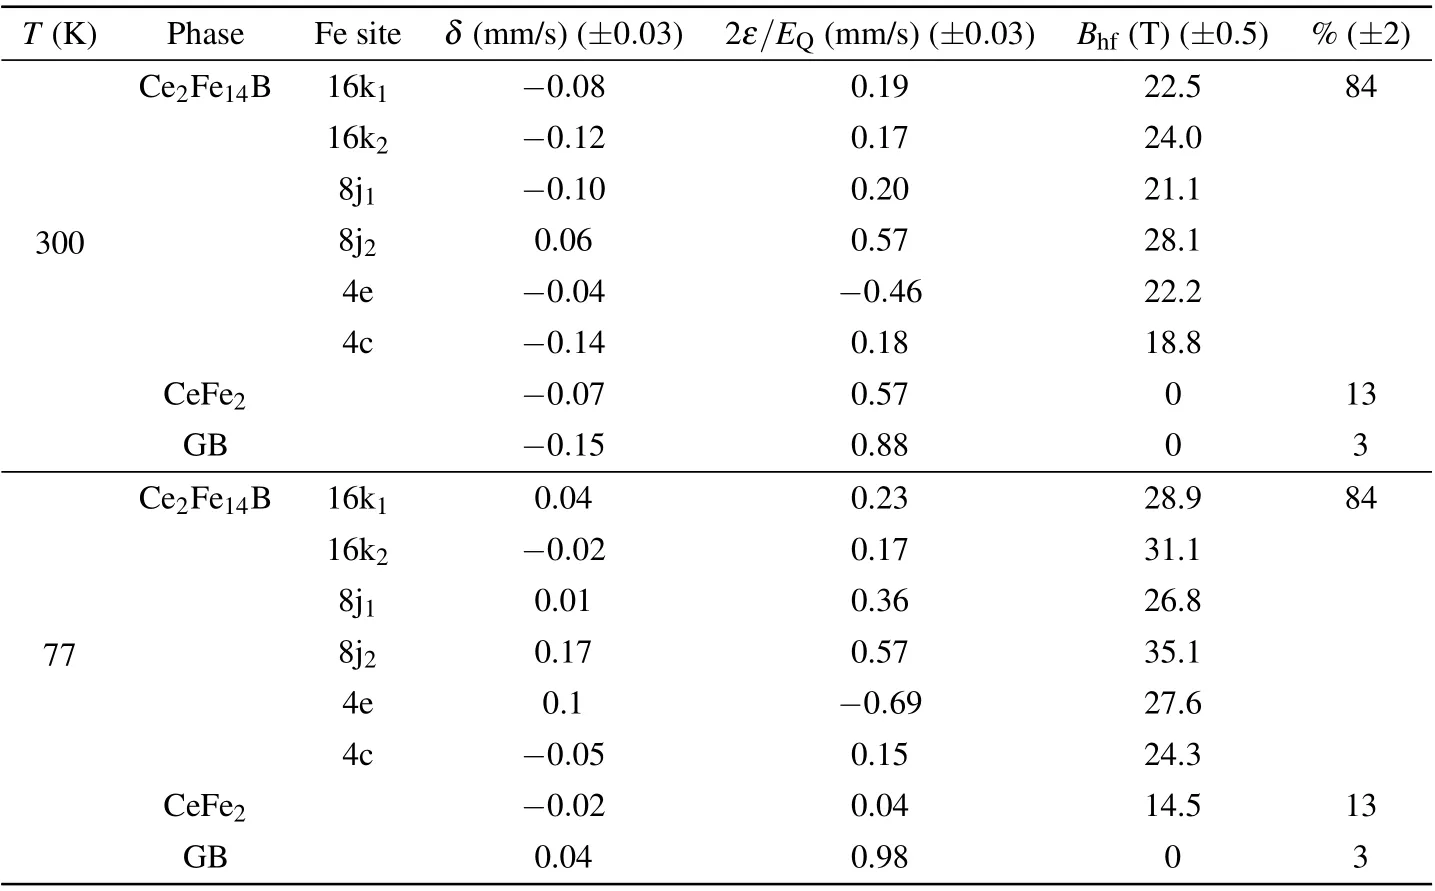
Table 2. Refined values of the hyperfine parameters of melt spun Ce16Fe78B6 alloy.[26]
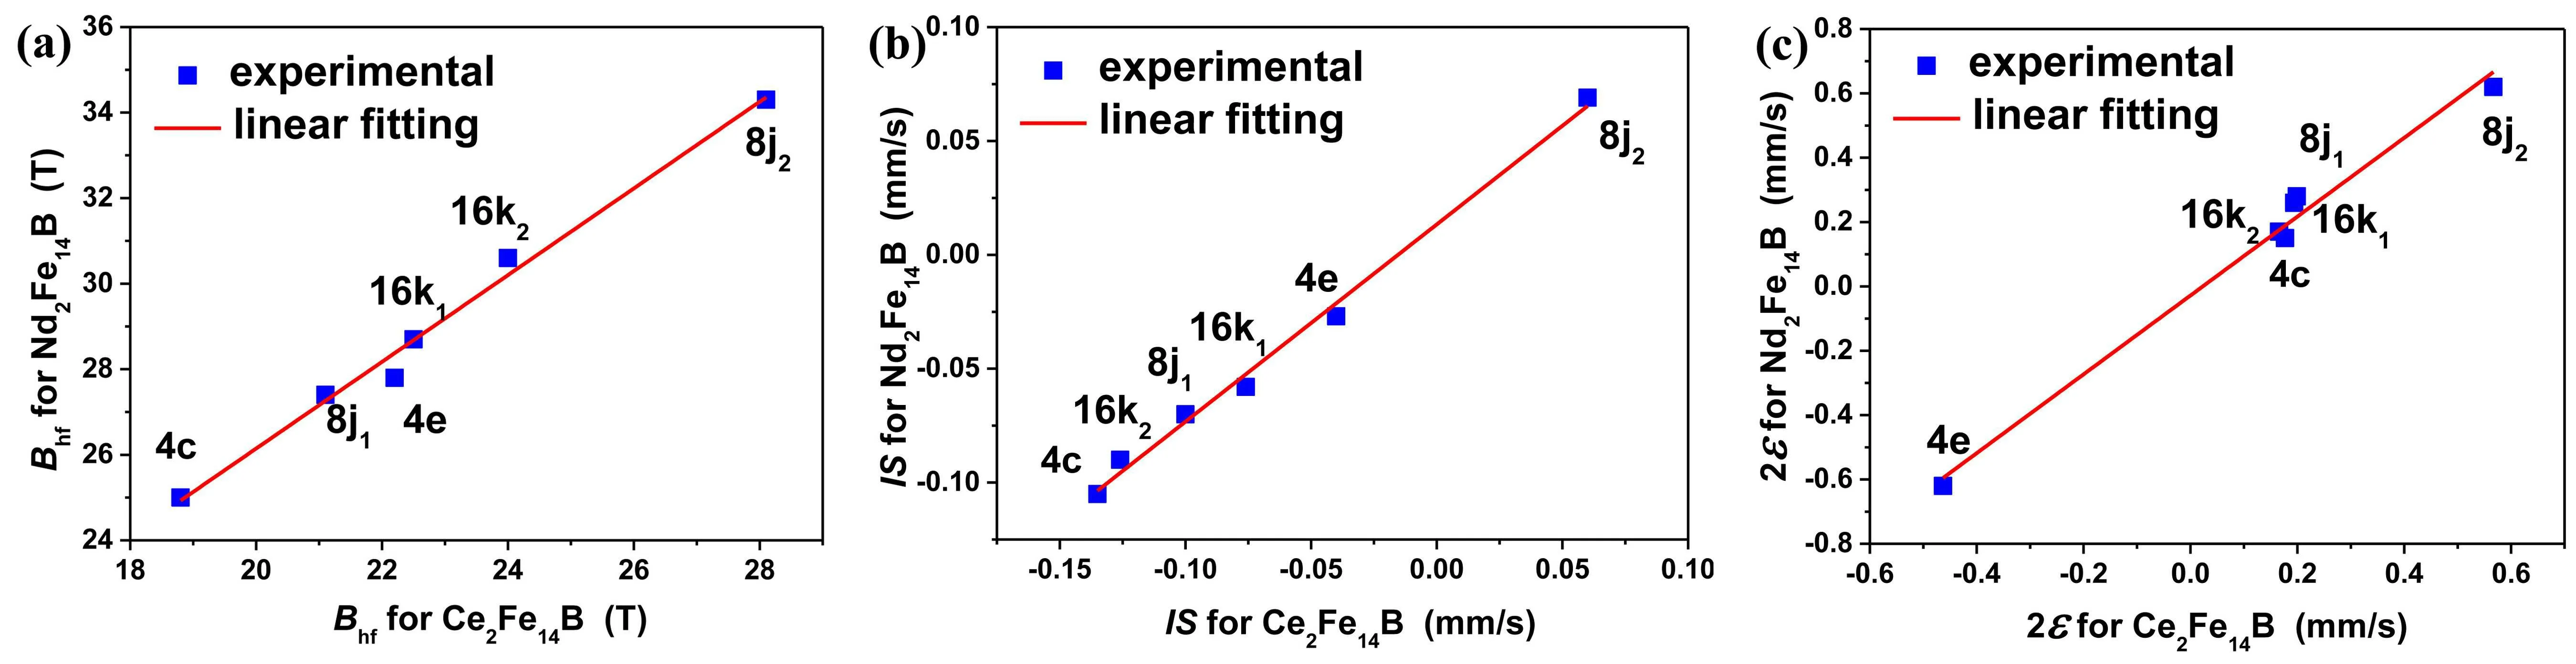
Fig. 5. The hyperfine parameters of Ce2Fe14B in this work versus those of Nd2Fe14B phase, (a) hyperfine field Bhf, (b) isomer shift δ,(c)quadrupolar shift 2ε.[26]
Since the refined hyperfine parameters Bhf,δ,and 2ε are fitted by the same model proposed by Long et al.[8]based on the Wigner–Seitz analysis,one would expect the hyperfine parameters of Ce2Fe14B here to correlate linearly with those of other RE2Fe14B phases, as all these phases have the same P42/mnm crystal structure. Similarly, a linear correlation of the hyperfine fields is also observed between the compounds Nd2Fe14B and Nd2Fe14C.[28]Thus, the hyperfine parameters Bhf, δ, and 2ε obtained at 300 K are plotted against those of Nd2Fe14B phase. Figure 5 shows a good linear correlation of the hyperfine parameters at each of the Fe sites of these two series of compounds: this indicates clearly that the replacement of Nd by Ce does not disrupt the symmetry of the structure and thus the hyperfine interactions remain qualitatively independent of the presence of Nd or Ce atoms. It also confirms that our fitting model results in physically reasonable values of the hyperfine parameters.
Figure 6 shows the experimental spectra of the Ce16Fe78B6alloy recorded at 300 K and 77 K.It indicates that,except for the six sextets of Ce2Fe14B phase, two quadrupolar doublets should be added to fit the 300 K spectrum and one sextet combined with a doublet is added to fit the 77 K

Fig.6. M¨ossbauer spectra of the melt spun Ce16Fe78B6 alloy obtained at 300 K and 77 K.
spectrum. CeFe2phase is paramagnetic at 300 K and magnetically ordered at 77 K,which corresponds to the blue doublet and sextet at 300 K and 77 K, respectively. The remaining 3%of Fe atoms can only be assigned to the GB phases as no additional phases were observed by the microstructure analysis. On this basis, the volume ratio of the Ce2Fe14B phase could be estimated to be 77±1%in the alloy considering the theoretical density of 7.7 g/cm3for the Ce2Fe14B phase and 8.6 g/cm3for the CeFe2phase and GB phase. Thus,the Jsof the sample comprising 77±1 vol%of Ce2Fe14B(Js=1.17 T at 300 K[29])can be estimated in the range 0.89–0.91 T,which matches well to the experimental value of 0.90 T. Consequently, the phase ratio estimated from the57Fe M¨ossbauer results is more accurate than that obtained from the XRD refinement.
2.4. The hyperfine structure of Nd–Ce–Fe–B-base alloys
Nanocrystalline (Ce1-xNdx)16Fe78B6(x=0–1.0) alloys were prepared by melt-spinning technique.[15,30]The refined XRD patterns for the selected alloys, as shown in Fig. 7,indicate that the alloys with x = 0–0.5 are composed of(NdCe)2Fe14B phase and(NdCe)Fe2phase(1:2),whereas,if x >0.5,the 1:2 phase will be replaced by the(CeNd)1+εFe4B4phase(1:4:4,P42/n space group).

Fig. 7. Refined XRD patterns of the selected as-spun(Ce1-xNdx)16Fe78B6 samples.[15]
All the as-spun (Ce1-xNdx)16Fe78B6alloys were subjected for M¨ossbauer measurement at 300 K, while the corresponding refined hyperfine parameters are listed in Table 3.The results indicate that the Fe atoms are located in three different phases for all alloys, the ferromagnetic 2:14:1 phase,paramagnetic 1:2 phase, and RE-rich GB phase for the x=0–0.5 alloys, and the ferromagnetic 2:14:1 , paramagnetic(NdCe)1+εFe4B4,and RE-rich GB phases for the x=0.6–1.0 alloys. The composition-dependent hyperfine parameters of the 2:14:1 phase are plotted in Fig. 8, indicating that the refined average values of δ and 2ε for the 2:14:1 phase remain approximately constant with the evolution of x. This could be attributed to that all (NdCe)2Fe14B phases with different Ce/Nd ratios have the same crystal structure, which proves that the electronic charge density at the57Fe nuclei and the asymmetric distribution of surrounding charges do not change significantly with the substitution of Nd in the(Nd,Ce)2Fe14B phase.[28]From the refined values of the hyperfine field Bhf,it can be concluded that the substitution of Ce by Nd gives rise to an increase in Bhfat57Fe, since the average hyperfine field for the Nd2Fe14B phase is 29.5 T,much higher than that of 23.3 T for Ce2Fe14B.[8]However, two exceptions are observed: (i) one is a higher average increase observed among x = 0.1–0.5 alloys compared to that of x = 0.5–1.0 alloys;(ii)the other is that the 28.3 T hyperfine field of alloy x=0.8 is lower than that of alloy x=0.7, indicating a lower Msof the 2:14:1 phase in alloy x=0.8. Since Bhfis proportional to the magnetic induction,which is an intrinsic magnetic parameter determined by the actual composition of the 2:14:1 phase.Therefore, the change of Nd content dependent Nd/RE % in the 2:14:1 phase may explain those abnormal changes.
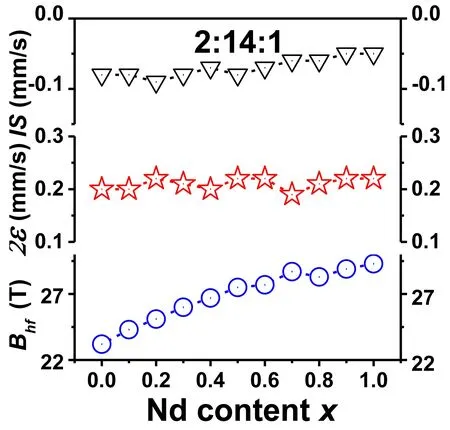
Fig.8. The Nd content dependent hyperfine parameters of 2:14:1 phase in the as-spun(Ce1-xNdx)16Fe78B6 samples.[15,30]
Figure 9 shows the evolution of Nd/RE%in 2:14:1 phase as a function of the Nd content in(Ce1-xNdx)16Fe78B6alloys.By focusing the evolution of Nd/RE%,an average increase of 11% is observed from 22% for the x=0.1 alloy to 67% for the x=0.5 alloy, while a much smaller average increase of 5% is observed from x=0.5 to 0.8. It can therefore be concluded that a two-stage change in element segregation exists in(Ce1-xNdx)16Fe78B6alloys,and causes a corresponding twostage change in Bhfsimultaneously. The Nd/RE%is 81%for alloy x=0.8, which is 3% higher than that for alloy x=0.7 and close to the nominal composition of 80%. However, the abnormal decrease in hyperfine field Bhfis also observed between alloys x=0.7 and x=0.8. Many researchers[14,31,32]have attributed this abnormal change to the phase separation.Here, our results demonstrate that this phase separation reduces element segregation and leads to a crystal shrinkage of 2:14:1 phase,resulting in a weaker ferromagnetic coupling between Fe–Fe atoms and the decreased Bhf.
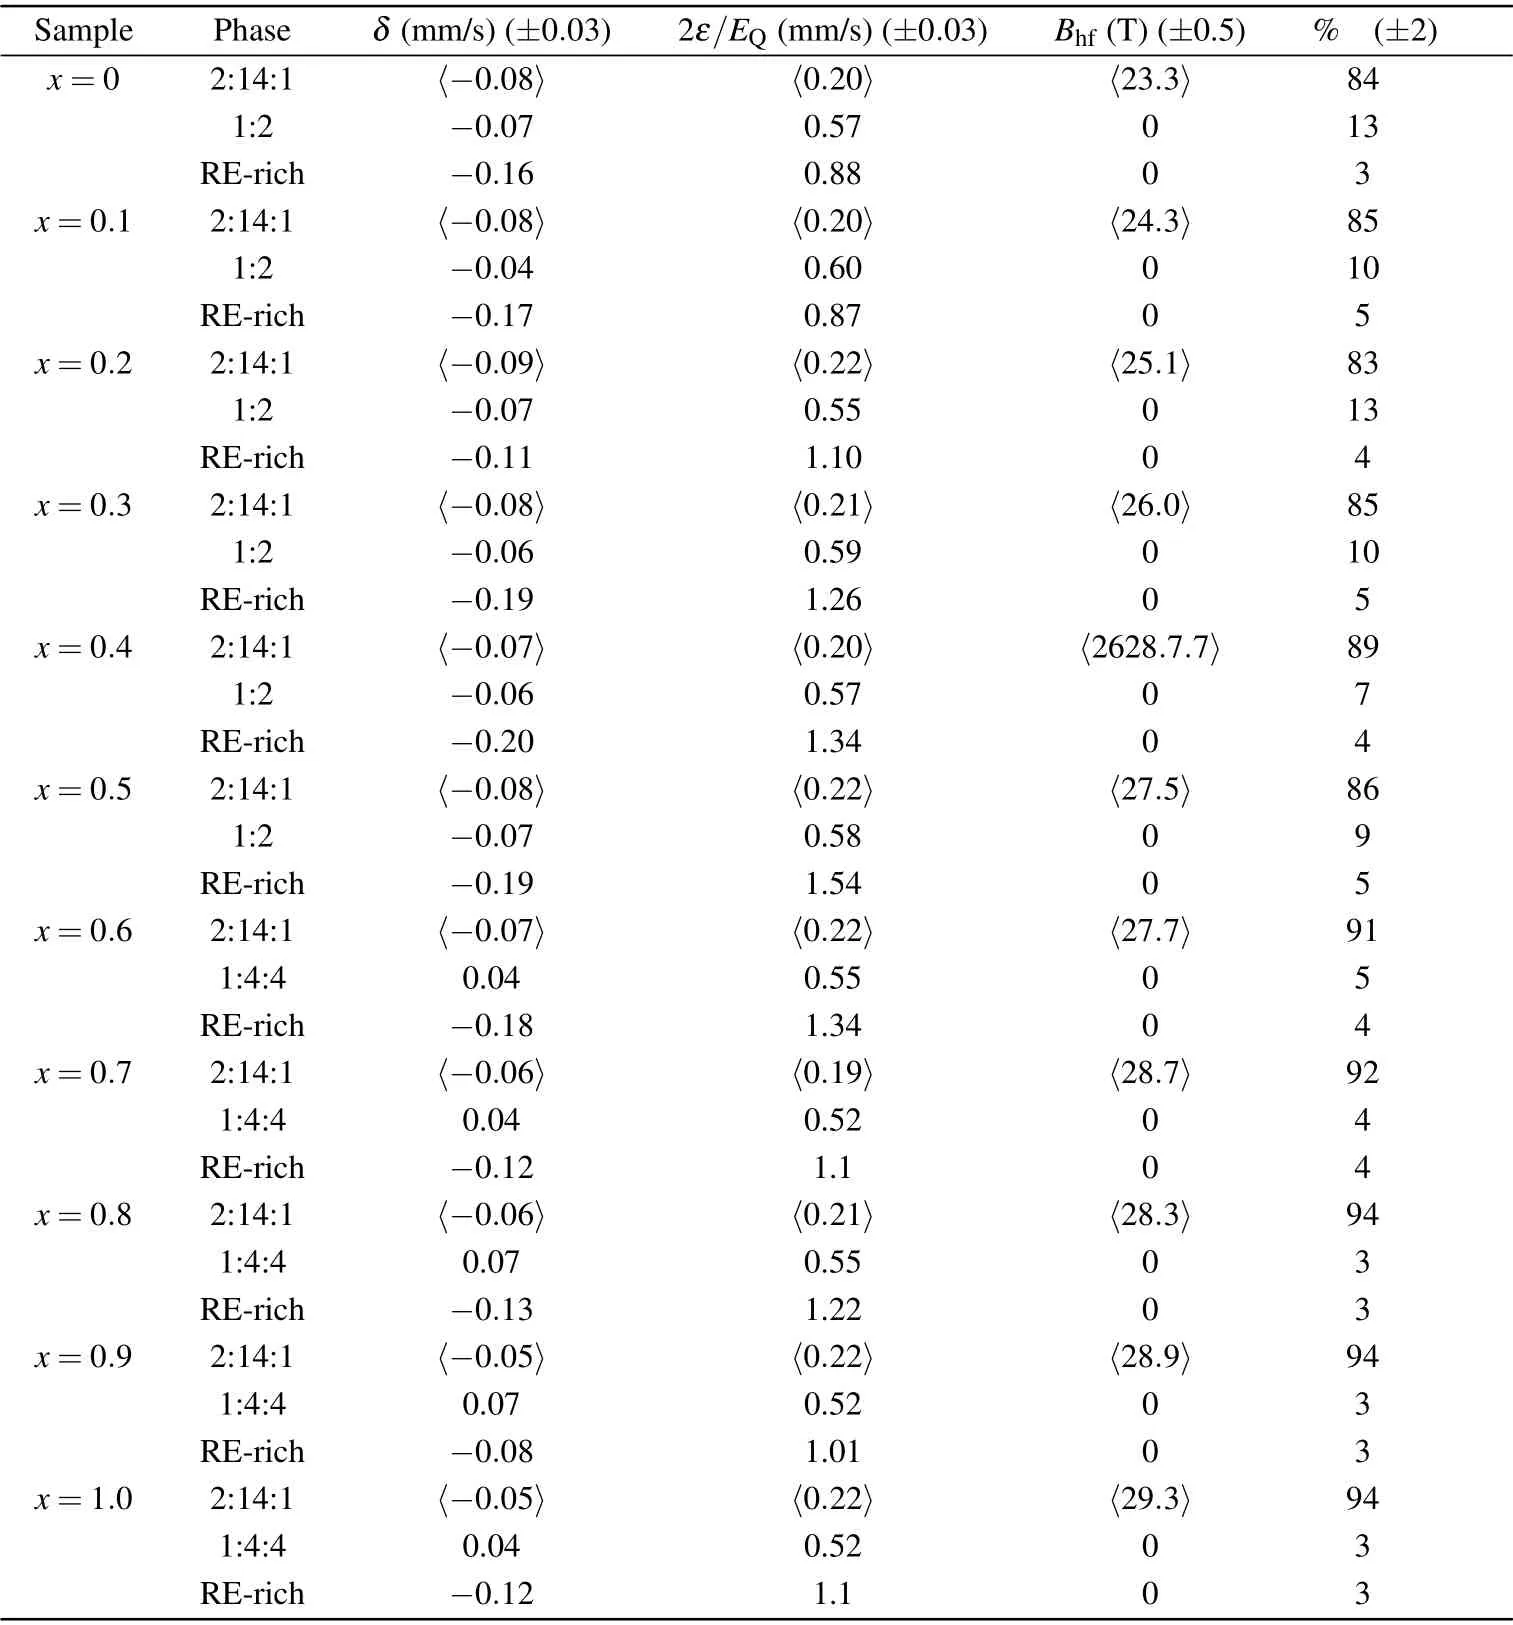
Table 3. Refined values of the hyperfine parameters for the as-spun(Ce1-xNdx)16Fe78B6 alloys at 300 K.[15,30]
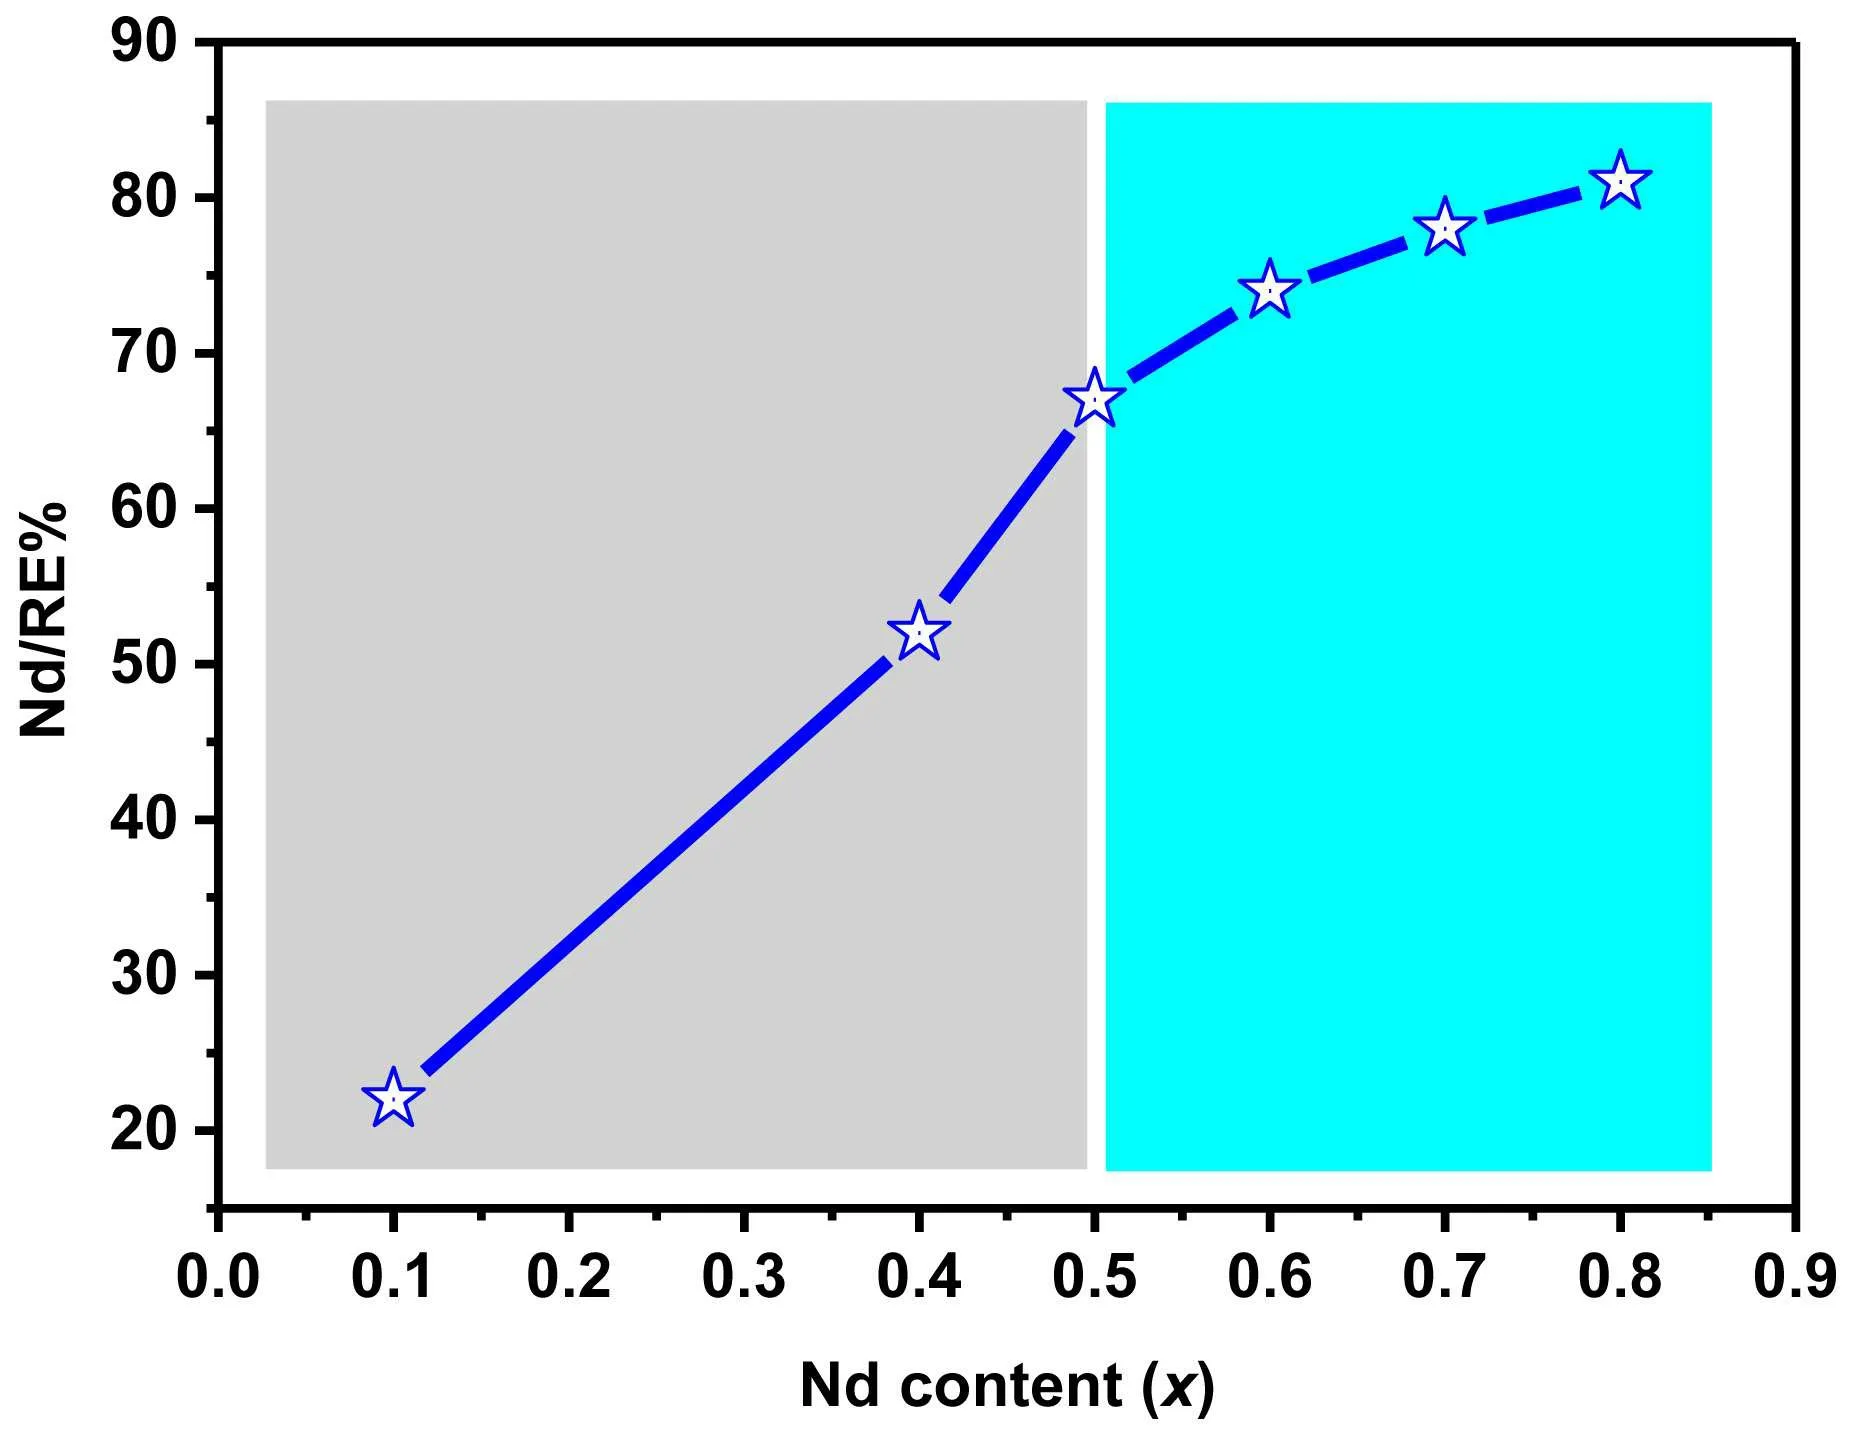
Fig.9. The Nd/RE%of the 2:14:1 phase in(Ce1-xNdx)16Fe78B6 alloys changes with Nd content x.[15]
2.5. The M¨ossbauer spectra of misch-metal–Fe–B alloy
La and Ce elements, which generally coexist with Pr and Nd as misch-metal (MM, La+Ce fraction is close to 80 wt.%) in mines,[14,33–35]are more abundant and cheaper by comparing with Pr and Nb. Thus, the direct use of MM to develop MM–Fe–B magnets will not only reduce the cost of the magnets,but also avoid the unbalanced use of RE and the environment pollution due to the separation of REs.[36,37]Figure 10 shows the M¨ossbauer spectrum obtained at 300 K of the melt-spun MM14(Fe0.85Co0.15)78B8Ga0.6alloy. The total spectrum can be described by means of six magnetic components for the 2:14:1 phase (combined as a red sextet) and two quadrupolar components for the 1:2 phase(blue doublet)and La–Pr–Ga-rich phase(green doublet),and the corresponding hyperfine parameters are listed in Table 4.Even though themultiple RE elements are contained in the 2:14:1 phase, the fitting model still works for the refinement. The average hyperfine field of the 2:14:1 phase is 26.3 T,which is much larger than 23.3 T of the Ce2Fe14B phase[26]and close to 26.7 T of the (Nd0.4Ce0.6)2Fe14B phase[30]reported in our previous work, indicating the strong ferromagnetic interaction in the MM2Fe14B natural phase and its potential for applications.[38]
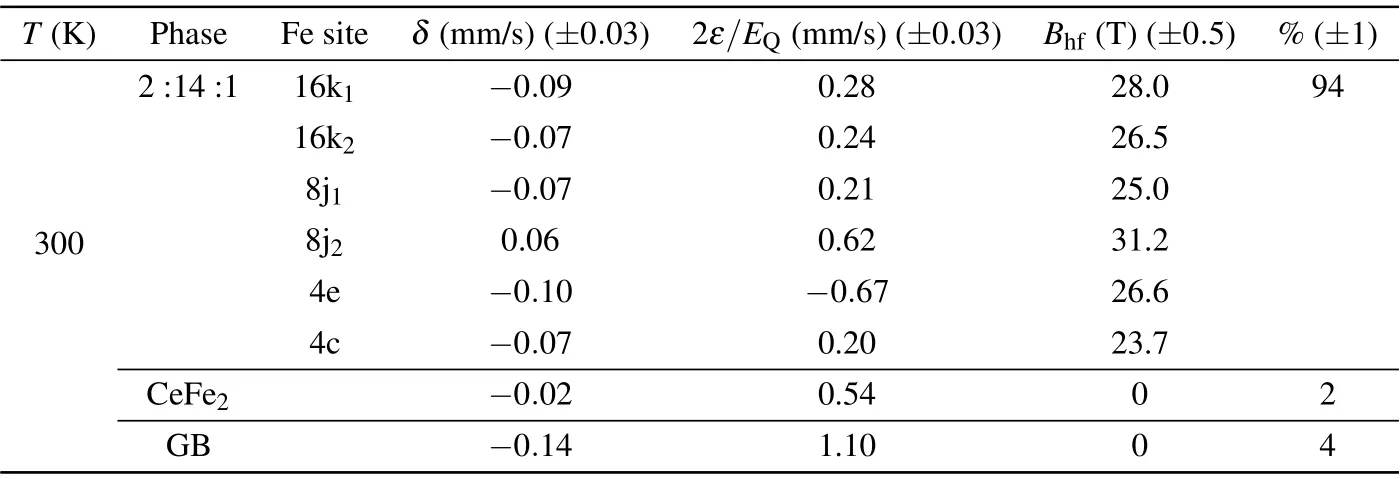
Table 4. Refined values of the hyperfine parameters of the melt-spun MM14(Fe0.85Co0.15)78B8Ga0.6 alloy.
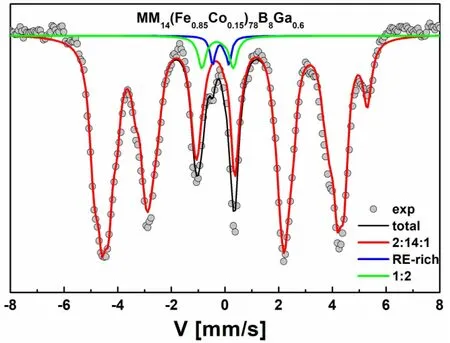
Fig.10. M¨ossbauer spectra of melt-spun MM14(Fe0.85Co0.15)78B8Ga0.6 alloy obtained at 300 K.
3. The hyperfine structures of the secondly phase in RE–Fe–B magnets
Massive research has concluded that the coercivity of Nd–Fe–B-based magnets is strongly correlated with the species,distribution, and magnetism of the grain boundary (GB)phase or secondary phase distributed around the 2:14:1 main phase.[19,20]Here,57Fe M¨ossbauer spectrometry is found to be a powerful technique to reveal the basic information of low Fe content secondary phase.
3.1. REFe2 phase
Nd–Ce–Fe–B magnets have unique characteristics which differ from those of Nd–Fe–B, such as the formation of the REFe2phase. A preliminary investigation has shown that the NdFe2phase could only form under a relatively high pressure in the Nd–Fe–B-based alloys, while it forms easily in Ce–Fe–B alloys due to the mixed valance state of Ce atom.[39]Therefore,the mass fraction of the REFe2phase increases to a high value with a high Ce substitution level in the Nd–Ce–Fe–B magents,[13,16,26,40]resulting in that the REFe2phase evolves gradually towards the dominant intergranular phase rather than the conventional RE-rich phase with Ce content increasing.[13,15,26]Up to now, the role of the 1:2 phase in Nd–Ce–Fe–B is still under debate. On the one hand, the CeFe2phase behaves as a paramagnetic phase at 300 K and a soft magnetic phase below 230 K.[41]Hence,its existence is considered as a dilute magnetic phase at room temperature,which is detrimental to the hard magnetic properties below 230 K. On the other hand, it also shows certain advantages in the Nd–Ce–Fe–B magnets for smoothing the grain boundaries during the sintering process,and enhancing the corrosion resistance.[42,43]Thus, understanding the content and magnetism of the REFe2phase and its role on the magnetic performance of Nd–Ce–Fe–B becomes a fundamental concern. As shown in Figs.4 and 10,the quadrupolar doublet of the paramagnetic 1:2 phase at 300 K is very easy to be distinguished in the M¨ossbauer spectra due to its unique assignment,which allows its content and magnetism to be clearly identified. Figure 11 presents the spectra of the CeFe2phase obtained at 300 K and 77 K.The hyperfine parameters of the CeFe2phase in its paramagnetic state at 300 K are IS=-0.07 mm/s and ΔEQ=0.57 mm/s, which are presented as a doublet. Then,the hyperfine parameters of the magnetic sextet at 77 K are IS=-0.02 mm/s, 2ε =0.14 mm/s, and Bhf=14.5 T. With the help of M¨ossbauer spectra, the basic information of the 1:2 phase in Nd–Ce–Fe–B magnet changing with the preparation process, composition, and temperature is well discussed as below.
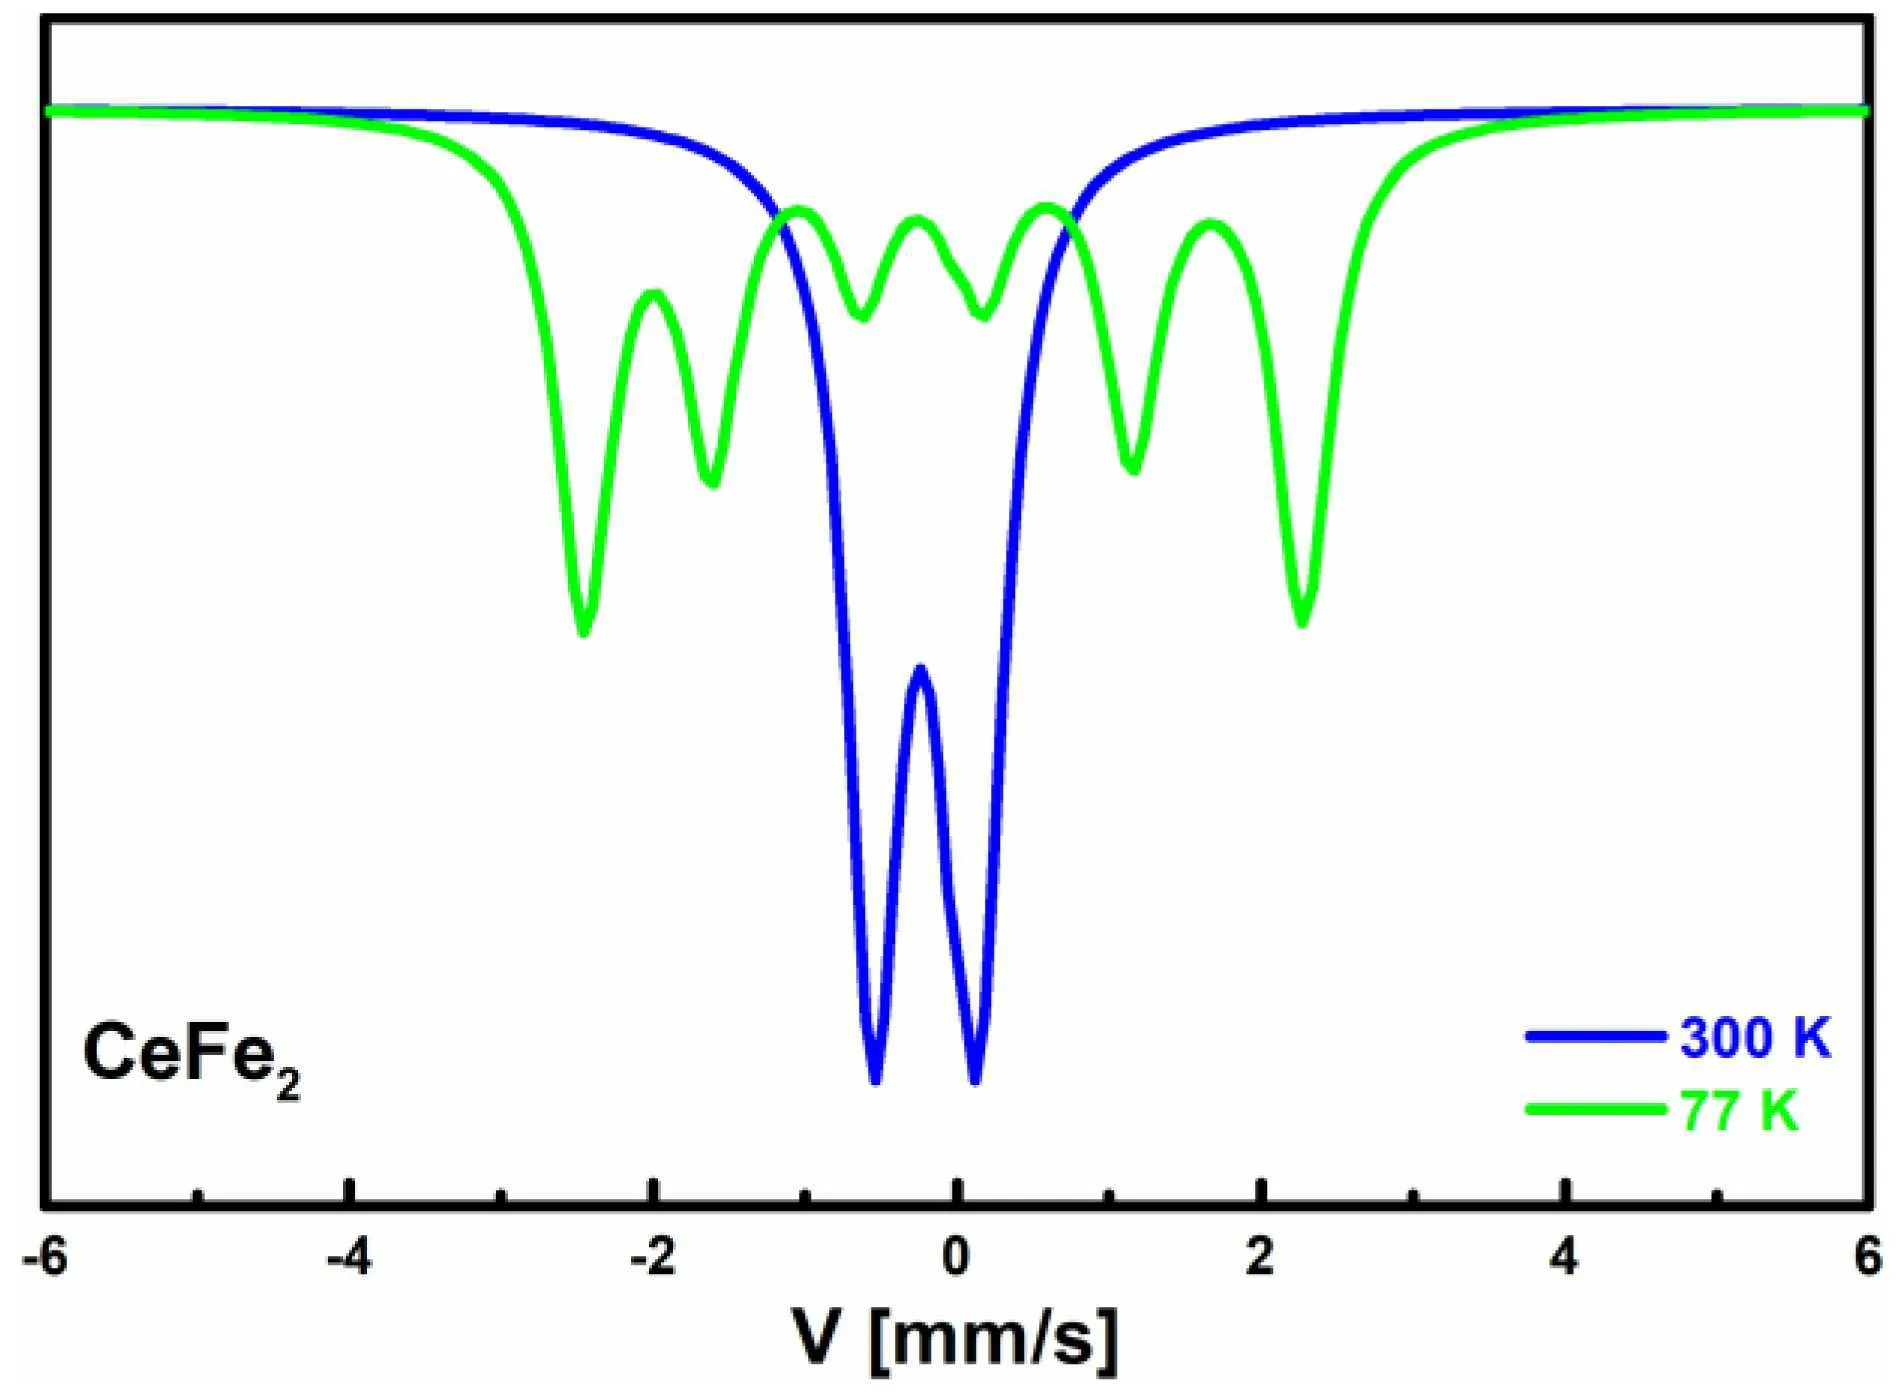
Fig.11. M¨ossbauer spectra of the CeFe2 phase obtained at 300 K and 77 K.

Table 5. Refined values of hyperfine parameters of the 1:2 phase in the selected mold-cast(Nd1-xCex)25Fe40Co20Al4B11 alloys.
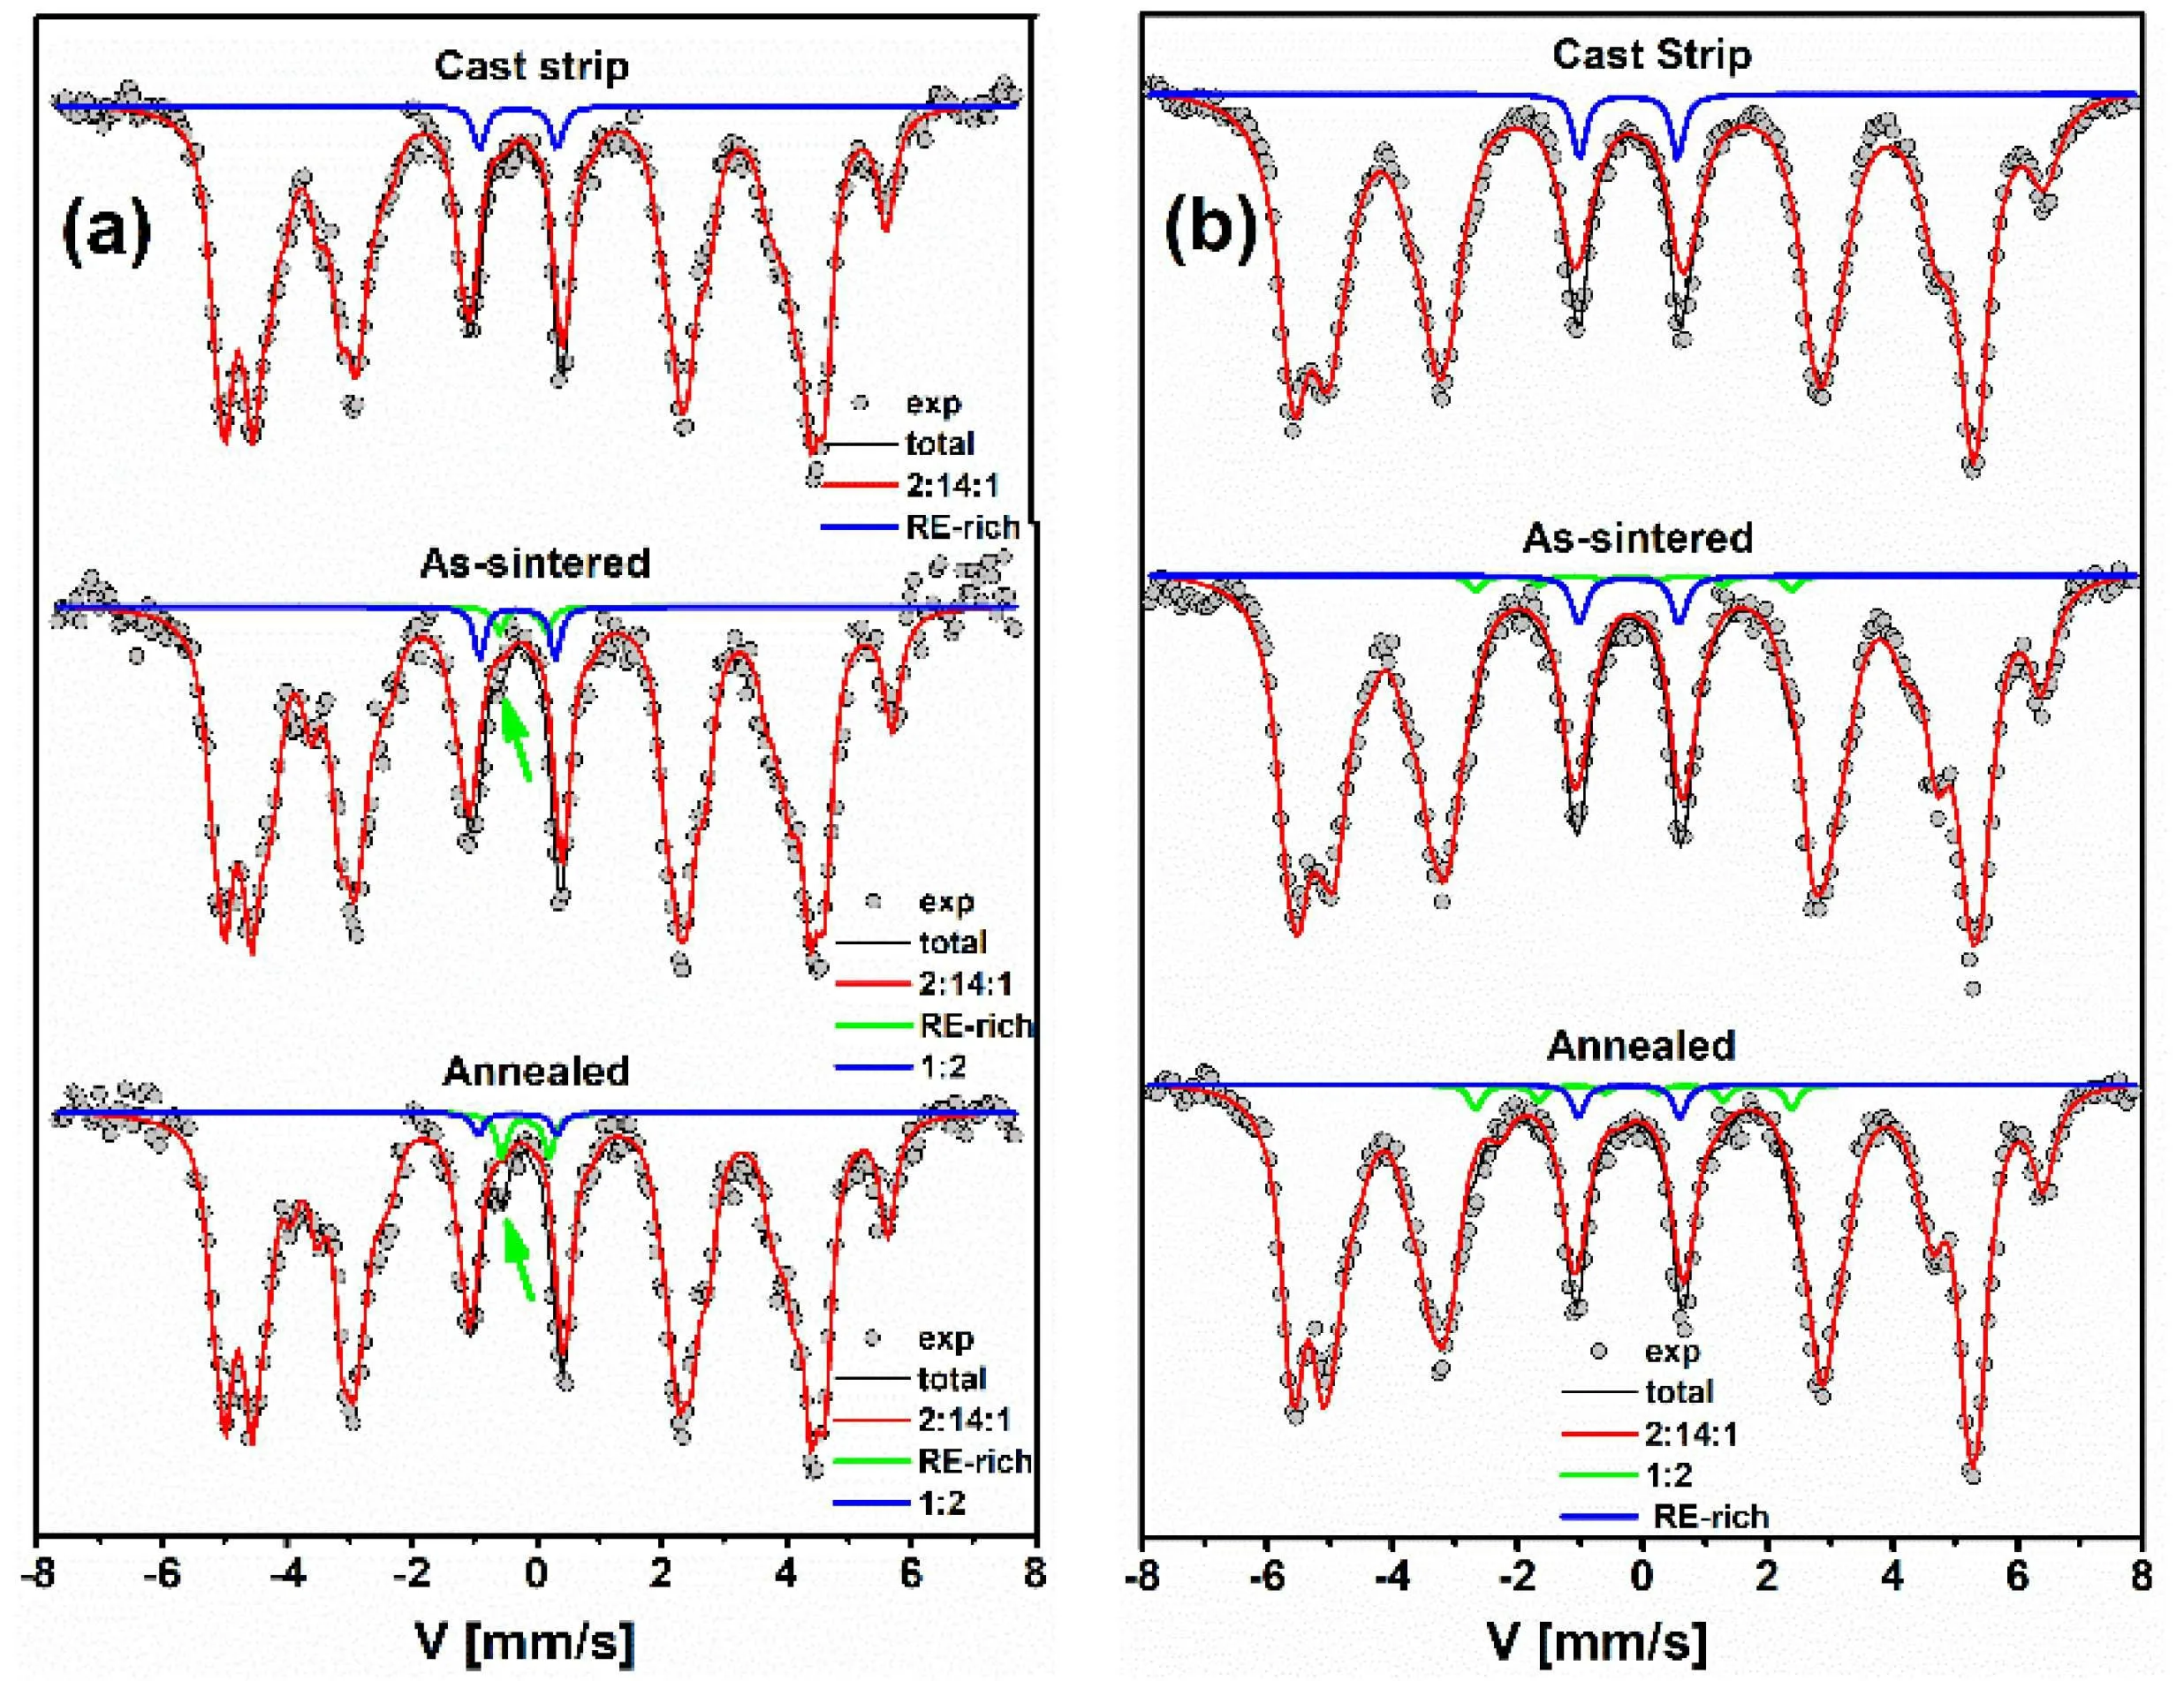
Fig.12.M¨ossbauer spectra of the cast strip,as-sintered,and annealed magnets with a composition of[(Nd,Pr)75Ce25]30.5FebalM1.3B1.0(wt.%)at 300 K(a)and(b)77 K.[44]
The bulk Nd–Ce–Fe–B-based magnets(both sintered and hot deformation magnets)are prepared by the method of powder metallurgy, which are subjected to several heat treatment processes. Hence, the formation of phase 1:2 is strongly related to those preparation processes. For instance, figures 12(a) and 12(b) show the M¨ossbauer spectra of the cast strip,as-sintered,and annealed magnets with a composition of[(Nd, Pr)75Ce25]30.5FebalM1.3B1.0(wt.%)at 300 K and 77 K,respectively. The spectra at 300 K confirm that, in addition to the coexisting ferromagnetic RE2Fe14B main phase(sextet with red color) and the RE-rich paramagnetic phase (doublet with blue color),an additional doublet component with green color(marked with an arrow)is required to fit the spectra of the as-sintered and annealed magnets, corresponding to the paramagnetic REFe2phase. The refined hyperfine parameters reveal that the Fe atomic content in the REFe2phase increases from 1%of the as-sintered magnet to 2%of the annealed magnet,verifying the increase of the REFe2fraction after annealing. These marked peaks are absent in the 77 K spectra and convert to a sextet(green in Fig.12(b)). These results indicate that the heat process is beneficial for the precipitation of 1:2 phase.[19]

Fig. 13. The 57Fe M¨ossbauer spectra of the selected mold-cast(Nd1-xCex)25Fe40Co20Al4B11 alloys.[45]
The Curie temperature of the NdFe2phase has been estimated to be 340 K by neutron measurements, thus the increasing Nd content in the 1:2 phase tends to change the Nd/Ce fraction in REFe2phase. To demonstrate this effect,2 mm (Nd1-xCex)25Fe40Co20Al4B11(x=0.1–0.5) rods with a high fraction of the 1:2 phase were prepared by mold casting method.[45]The corresponding room temperature M¨ossbauer spectra illustrated in Fig. 13 clearly show the presence of a quadrupolar component corresponding to the 1:2 phase(pink),indicating its paramagnetism.The refined values of the composition-dependent hyperfine parameters of the 1:2 phase are listed in Table 5. They show that even relatively high contents of Nd and Co elements are contained in the 1:2 phase,such as Nd26.0Ce6.4Fe27.3Co34.1Al6.2alloy for x=0.1, it still shows paramagnetism at 300 K. But both the δ and ΔEQdecrease with increasing Ce content in the 1:2 phase.
3.2. Amorphous grain boundary phase
Numerous studies focusing on the microstructure show that the RE-rich phases are distributed as thin amorphous layers among the 2:14:1 grains of RE–Fe–B magnets.[20,21,46,47]For example, figure 14 shows the microstructure of the nanocrystalline Ce16Fe78B6and(Ce0.9Nd0.1)16Fe78B6alloys.In Fig. 14(a), the interface between the grains of Ce2Fe14B,and the grains of Ce2Fe14B and CeFe2is rather rough. The relatively low RE-rich intergranular phase can be identified in the grain boundary, thus this structure should not be beneficial for improving the coercivity. For the alloy x=0.1,a RErich phase of 2–3 nm exists between the grains 2:14:1,which may decouple the magnetic grains and increase the coercivity.Here,the57Fe M¨ossbauer spectrometry is applied to determine the content and magnetism of the nanometer GB phase,given in Table 3. They show that the content of the RE-rich phase for x=0.1 is 5%,which is apparently higher than the 3%content of the Nd-free alloy. While such a low content of a disordered phase containing Fe can hardly be observed in the xray diffraction pattern due to the presence of broadened peaks,it can be detected from the hyperfine structure, providing an Fe content greater than about 2 at%.[23]Therefore,M¨ossbauer spectrometry appears to be a suitable technique for the determination of the phase ratios and magnetism in the GB phase.
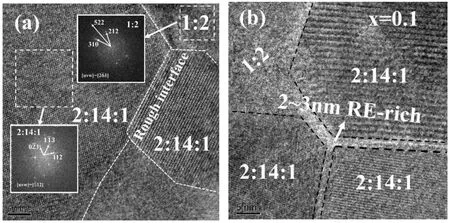
Fig.14. TEM images of(a)Ce16Fe78B6 and(b)(Ce0.9Nd0.1)16Fe78B6 alloys.[15]
Furthermore,the content and magnetism of the GB phase also change with the preparation process. For instance, highvelocity compaction (HVC) has been proposed as an alternative method to prepare the precursor of the hot-deformed(HD) magnet.[48,49]Unfortunately, the low density of the reported HVC magnets leads to an aggregation of the amorphous grain boundary phase(GB aggregation)with a composition of Nd37Fe63(at%) in the hot-deformed magnet. Low-meltingpoint Nd70Cu30powders were chosen to compensate for the disadvantages of low density.[50]Here, the phase content and magnetism of the different types of GB phases changing with the preparation process in the MQ powder, hot deformation(HD)magnet,and the Nd70Cu30-added hot deformation magnet (NdCu HD) were investigated by57Fe M¨ossbauer spectrometry. The fitted spectra are depicted in Fig. 15(a) while the corresponding mean values of the hyperfine parameters are listed in Table 6. For the MQ powders, the microstructure could be described as fine grains with a uniformly distributed Nd-rich GB phase.Consequently,part of the Fe atoms are located in the GB phase. As listed in Table 6, the refined MS results confirm that around 3% of Fe is contained in the paramagnetic GB phase. This paramagnetic GB phase decoupled the 2:14:1 phase is the reason for the high coercivity of the MQ powder (19.7 kOe). For the HD magnet, the spectra show some differences. Apparently, the relative intensity of the marked peak for the HD magnet has increased compared to that of the MQ powder, which could be originated from a new magnetic Fe-containing component rather than the 2:14:1 phase. Therefore,an additional magnetic component must be added to fit the spectra of the HD magnet. The refined results given in Table 6 show that 9% of the total Fe is contained in this new magnetic phase with a high value of hyperfine field(28.3 T). The broadening of lines suggests some atomic disorder around the Fe sites,which could indicate the disordered state of the GB phase. The same sample was also subjected to MS measurements at 77 K and 473 K,which are compared to the 300 K spectrum in Fig.15(b). The overall splitting of the magnetic spectra increases with temperature decreasing due to increased Fe–Fe magnetic coupling. The additional magnetic coupling component (blue line) is observed in all spectra,corresponding to the magnetic GB aggregation,while the content decreases by 9% from 77 K and 300 K to 6% from 473 K, at the expense of the non-magnetic component. The reason is that some of the ferromagnetic GB phases reach their Curie temperature and change gradually to the paramagnetic state at 473 K. Using the rule of 15 T/μBfor α-Fe (300 K,Bhf=33.0 T,and μ =2.2 μB),the average magnetic moment for the Fe atom in the GB phase can be estimated to be 1.86 μBat 300 K and the saturation magnetization of the GB phase can be calculated approximately as 1 T.Due to its amorphous structure,the absence of magnetocrystalline anisotropy makes this GB phase magnetically soft and results in the low coercivity of the HD magnet. As shown in Fig.15,the addition of NdCu reduces the Fe content in the GB aggregation,resulting in a difference in the role of the GB phase of the magnetism.The M¨ossbauer spectra of the NdCu HD magnet depicted in Fig. 15(b) indicate that not all Fe moments in the GB phase are magnetically coupled,which may be the reason for its high coercivity.

Table 6. Refined values of the hyperfine parameters for MQ powder, HD magnet, and NdCu HD magnet recorded at different temperatures.[50]
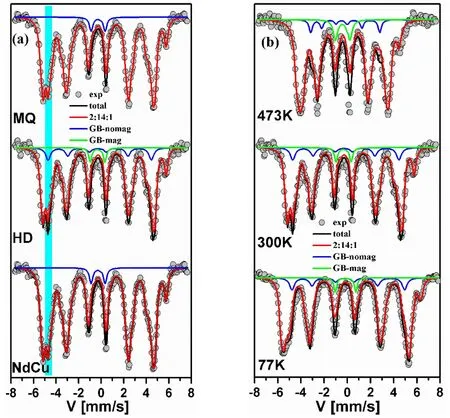
Fig.15. (a)M¨ossbauer spectra of the MQ powders,HD magnet,and NdCu HD magnet measured at 300 K.(b)M¨ossbauer spectra of HD magnet measured at 77 K,300 K,and 473 K.[50]
3.3. A worm-like amorphous phase distributed in 2:14:1 grains
With the exception of the amorphous GB phase mentioned above, a worm-like amorphous phase was also observed inside the 2:14:1 grain in the mold cast Nd11Fe60Co10Ti2.5Nb0.5C0.5B15.5alloy and its magnetism was investigated by57Fe M¨ossbauer spectrometry.[23]The microstructure of the alloy is shown in Fig. 16. Both the SEM(Fig.16(a))and TEM(Fig.16(b))images reveal the microstructure of submicron sized 2:14:1 particles separated by uniformly distributed interfacial phases. It is very interesting that a peculiar internal structure of the 2:14:1 particle is observed here. Figure 16(b) offers the evidence that a single micrometer sized particle is formed by the aggregation of a large amount of nanosized grains. The image of selected area electron diffraction(SADP)(Fig.16(b)left inset)for the single particle (region 2) shows that a single crystal diffraction pattern and a diffusion halo ring coexist, suggesting that the micrometer-sized grain is a single crystal, while some amorphous structure remains inside the grain, which is clearer in Fig.16(c).The HRTEM image of the typical area in Fig.16(c)is illustrated in Fig.16(d). It clearly shows that the 2:14:1 particle is a single crystal broken by an amorphous zone (bright area in Fig. 16(d)), with long-range ordered atom structure.The amorphous residents have a thickness of less than 10 nm,and are discontinuously distributed. Thus, the results lead to the conclusion that each 2:14:1 particle is a poorly crystallized single grain and that the amorphous phase remains in each grain. According to the composition results(Ndatom=12.2%,Featom=74.0%, and Coatom=13.8% (±0.5%) detected by energy dispersiv x-ray spectrometry(EDS),the Re:TM of the worm-like amorphous phase is close to 1:7, and this Fe-rich composition is possible to be a soft magnetic phase.

Fig. 16. Microstructure of directly cast Nd11Fe60Co10Ti2.5Nb0.5C0.5B15.5 alloy: (a) back-scattered SEM graph; (b) TEM graph with SDAPs for selected areas 1 and 2; (c) TEM graph for area 2 in (b), which is inside a single particle;and(d)HRTEM graph for the typical area in(c).[23]

Fig.17. M¨ossbauer spectra of directly cast Nd11Fe60Co10Ti2.5Nb0.5C0.5B15.5 alloy obtained at 300 K and 473 K.[23]
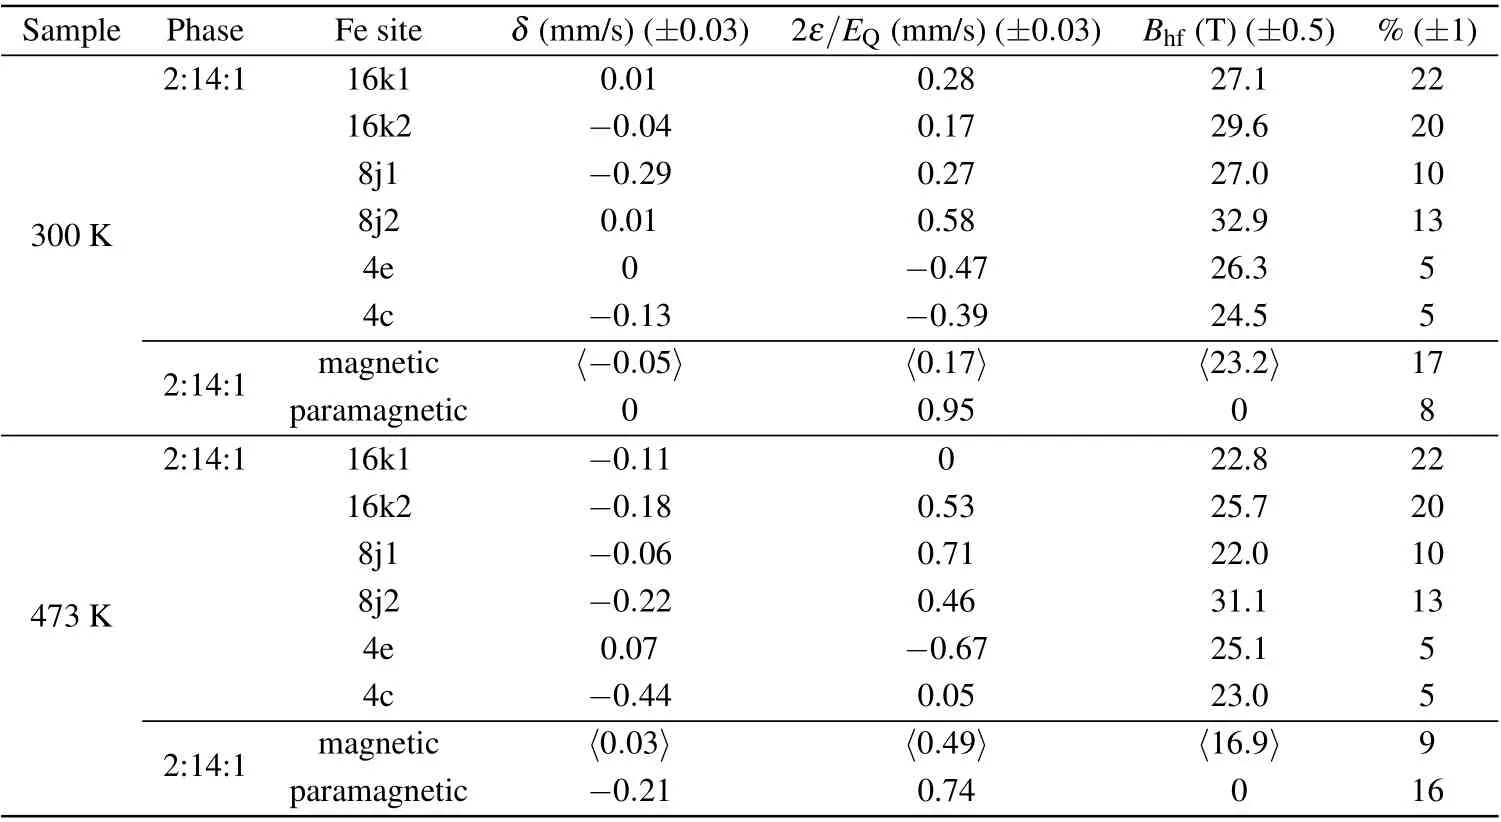
Table 7 Refined values of the hyperfine parameters of directly cast Nd11Fe60Co10Ti2.5Nb0.5C0.5B15.5 alloy.[23]
To reveal the magnetic behavior, the M¨ossbauer spectra recorded at 300 K and 473 K under vacuum (using a homemade cryofurnace)are shown in Fig.17,and the corresponding refined values of the hyperfine parameters are listed in Table 7.The hyperfine structure at both temperatures must be described by at least three main components:six elementary sextets to describe the 2:14:1 phase,a sextet with broadened lines attributed to the magnetic amorphous phase,and a quadrupolar feature assigned to the paramagnetic amorphous phase. Both spectra confirm that around 75% of Fe species are located in the 2:14:1 phase, and 25% in the amorphous phase. By increasing the measuring temperature from 300 K to 473 K,the paramagnetic amorphous phase increases from 8% up to 16%,because a part of the magnetic amorphous phases reach their Curie temperature and transfer into paramagnetic phase,which is consistent with the previous results.[51]Similarly,the hyperfine fields for both the 2:14:1 phase and the magnetic amorphous phase decrease with increasing temperature. At 300 K, the average value of the hyperfine field characteristic of the magnetic Fe-containing amorphous phase is estimated to be about 23 T,and then it decreases to about 17 T at 473 K.Using the hypothesis of 15 T/μBfor magnetic coupled iron,the magnetic moment for each Fe site can be estimated to be 1.53±0.05 μBat 300 K and 1.13±0.05 μBat 473 K. Due to the amorphous structure, the absence of the magnetocrystalline anisotropy makes the amorphous phase a soft magnetic phase. The M¨ossbauer results indicate the existence of the novel nanocomposite structure by revealing the magnetic behavior of the different phases.
4. Conclusions
This review demonstrates the57Fe M¨ossbauer spectrometry as a powerful and relevant technique not only for analyzing the hyperfine structures of the Ce-containing RE2Fe14B phase,but also for revealing the content and magnetic behavior of the low content secondary phase in the RE–Fe–B magnets. Due to the advances of this technique, the spectra of the Ce-containing RE2Fe14B phases are well fitted by the typical model based on the Wigner–Seitz analysis of the 2:14:1 phase. The Bhfof the 2:14:1 phase in(Ce1-xNdx)16Fe78B6alloys increases approximately with the increasing Nd content while the values are influenced by the elemental segregation and phase separation. Room temperature paramagnetism of the REFe2phase is proved to be hardly affected by its composition and the Ce segregation in the REFe2phase leads to the increase of the Bhfof 2:14:1 phase. Meanwhile, the thin GB phases in the ribbons,hot deformed,and sintered Nd–Ce–Fe–B magnets are assumed to be paramagnetic,which can decouple the 2:14:1 grains and increase the coercivity.It is noted that the GB aggregation in the HD magnets prepared from the lowdensity precursor and the worm-like amorphous phase in the cast Nd11Fe60Co10Ti2.5Nb0.5C0.5B15.5alloy are ferromagnetic with a Bhfof 28.3 T and 23.0 T,respectively,which in turn decreases the coercivity but improves exchange coupling. This review could inspire further applications of57Fe M¨ossbauer spectrometry in other Fe-based permanent magnets.
猜你喜欢
杂志排行

Chinese Physics B的其它文章
- Two-dimensional finite element mesh generation algorithm for electromagnetic field calculation*
- Stable water droplets on composite structures formed by embedded water into fully hydroxylated β-cristobalite silica*
- Surface active agents stabilize nanodroplets and enhance haze formation*
- Synchronization mechanism of clapping rhythms in mutual interacting individuals*
- Theoretical study of the hyperfine interaction constants,Land´e g-factors,and electric quadrupole moments for the low-lying states of the 61Niq+(q=11,12,14,and 15)ions*
- Ultrafast photoionization of ions and molecules by orthogonally polarized intense laser pulses: Effects of the time delay*