基于便携式三波段作物生长监测仪的水稻长势监测
2020-12-25林维潘李怀民蒋小平
林维潘,李怀民,倪 军,蒋小平,朱 艳
·农业信息与电气技术·
基于便携式三波段作物生长监测仪的水稻长势监测
林维潘,李怀民,倪 军,蒋小平,朱 艳※
(1. 南京农业大学农学院,南京 210095;2. 国家信息农业工程技术中心,南京 210095;3. 教育部智慧农业工程研究中心,南京 210095;4. 江苏省物联网技术与应用协同创新中心,南京 210095)
针对现有两波段光谱仪在实际应用中存在的植被指数单一、生长指标反演精度低等问题,该研究研发了一款便携式三波段作物生长监测仪CGMD303(Crop-Growth Monitoring and Diagnosis,CGMD)并于2018年7—9月开展了水稻田间试验研究。结果表明,CGMD303获取的植被指数与商用仪器ASD FieldSpec HandHeld2呈良好的线性相关关系,同时基于CGMD303构建的水稻生长监测模型可以有效预测叶面积指数、叶片干质量、叶片氮质量分数和叶片氮积累量,决定系数分别为0.85、0.72、0.45和0.68,相对均方根误差分别为0.21、0.32、0.13和0.39。CGMD303可以有效获取冠层光谱反射率,构建的水稻指标监测模型可以精确预测叶面积指数、生物量和氮素指标,可为水稻田间栽培工作提供决策依据。
水稻;监测;光谱;模型;生长参数;便携式监测仪
0 引 言
水稻是中国重要的主粮作物,提高水稻生产水平对保障国家粮食安全和农民经济收入至关重要[1]。随着农业栽培技术的发展和农业机械化水平的提高,水稻的生产管理也逐渐走向精确化、智能化,而有效获取水稻的生长信息是精准农业的重要前提[2]。传统的实验室分析方法虽然可以准确地获取水稻的生长指标及各项农学参数,但需要破坏性取样,操作繁琐,耗时较长,污染环境且在时空尺度上很难满足实时、快速、无损的要求,无法适用于现代农业生产。近年来,光谱监测技术的发展使实时、快速、无损地获取水稻生长信息成为可能[3]。
不同的地物目标对不同波长(或频率)的电磁波的吸收、反射和透射特性均存在差异,而细胞结构、生物化学成分和形态学特征共同决定了作物的光谱反射特性,绿色植物在350~2 500 nm范围内具有典型的反射光谱特征[4]。国内外学者针对作物生长指标与光谱反射率的定量关系展开了一系列研究。李映雪等[5]指出,810 nm附近近红外波段反射率是作物叶面积指数的最敏感波段。姚霞等[6]研究发现,小麦的叶片氮质量分数监测最佳波段位于红边和近红外波段。冯伟等[7]和Zhang等[8]指出,红光波段和近红外波段是生物量指标的重要敏感波段。Zhu等[9]和Chu等[10]研究发现,近红外(810 nm)和红光波段(660 nm)组合的植被指数对水稻和小麦的氮积累量的监测效果最好。此外,已有研究表明,三波段植被指数对一些生长指标的监测效果要优于两波段植被指数,适当增加光谱仪波段数有利于提高监测精度[11-13]。因此,同时配置可见光、红边和近红外波段的多波段作物生长监测设备更加符合作物生长监测的需要。综合考虑各生长指标对应的敏感波段,课题组开发了一款便携式三波段作物生长监测仪CGMD303,该光谱仪可同时获取660、730和815 nm的波段反射率,针对不同作物的生长指标建模需要,可选择适宜的植被指数,在实际应用中更具灵活性[14-16]。
本研究通过水稻大田小区试验,利用CGMD303作物生长监测诊断仪获取了不同品种、不同生育期水稻冠层反射光谱,并同步采集水稻相应部位叶面积指数,通过分析不同波段下水稻冠层反射光谱的变化特征,探讨构建的光谱植被指数与叶面积指数(Leaf Area Index,LAI)、叶片干质量(Leaf Dry Weight,LDW)、叶片氮质量分数(Leaf Nitrogen Content,LNC)和叶片氮积累量(Leaf Nitrogen Accumulation,LNA)的定量关系,建立基于CGMD303的水稻光谱监测模型。本研究在此基础上评价了CGMD303作物生长监测诊断仪在水稻田间生产实际中的性能,为水稻生长的实时监测提供参考依据。
1 材料与方法
1.1 田间试验
于2018年7—9月在江苏省如皋市国家信息农业工程技术试验示范基地(32°27′N,120°77′E)开展水稻田间试验。试验设置了2个水稻品种,分别为Ⅱ优 728和淮稻5号,旱地育秧后移栽;3个氮肥水平,分别为N0(0 kg/hm2)、N1(150 kg/hm2)、N2(360 kg/hm2),按基肥40%、分蘖肥20%、促花肥20%、保花肥20%施入,施基肥时搭配施入P2O5135 kg/hm2和K2O 220 kg/hm2;2个密度处理,分别为D1(行距×株距为 30 cm×15 cm)和D2(行距×株距为50 cm×15 cm)。试验采用裂区设计,以品种为主区,氮肥水平和密度处理为副区,12种处理,3次重复,共计36个小区。小区的长和宽分别为6 和5 m,小区面积为30 m2。小区梗上覆盖塑料薄膜,每个小区独立排灌。其他栽培管理措施同一般高产田。
1.2 便携式三波段作物生长监测仪
CGMD303由三波段传感器、传感器支架、水平仪等部件组成。其中,多光谱作物生传感器在结构上分为上行光传感器和下行光传感器。上行光传感器可以接收太阳光在660、730和815 nm波段处的辐射信息;下行光传感器用于接收作物冠层在对应波段的反射辐射信息,通过对上下行光传感器的辐射信息处理获取660、730和815 nm波段的水稻冠层反射率。CGMD303质量较轻,携带方便,适合于田间操作,如图1所示。

1.三波段传感器 2.传感器支架 3.处理器 4.屏蔽电缆线 5.水平仪
1.3 数据获取方法
1.3.1 光谱数据
选择无风无云的正午进行水稻冠层光谱数据测试,测试的物候期为水稻拔节期、孕穗期、抽穗期,获取660、730和815 nm 3个波段处的冠层反射光谱。试验使用高光谱仪(Analytical Spectral Devices FieldSpec HandHeld 2,ASD)同步获取作物冠层反射光谱用于对比。每个小区选择3个点进行监测,最终结果取每个小区监测结果的平均值。
1.3.2 生长指标
在光谱数据测定同期破坏性取样获取水稻的生长指标。每个小区选择50 cm具有代表性的水稻植株,在实验室按照植株器官进行分样。取样时使用冠层分析仪LAI-2200C同步获取叶面积指数(Leaf Area Index,LAI),每个小区选取3个点进行监测,取每个小区监测结果的平均值。样品在105 ℃下杀青30 min,再于80 ℃条件下将植株烘干至恒质量,称取叶片干质量(Leaf Dry Weight,LDW,g/m2)。样品粉碎后用凯氏定氮法测定叶片氮质量分数(Leaf Nitrogen Content,LNC,%)。叶片氮积累量(Leaf Nitrogen Accumulation,LNA,g/m2),如式(1)所示
LNA=LNC∙LDW (1)
1.4 数据分析方法
1.4.1 植被指数计算
本研究参考了常见的归一化植被指数(Normalized Difference Vegetation Index,NDVI)和差值植被指数(Difference Vegetation Index,DVI)的构建形式,在原植被指数的基础上增加一个波段,使其保留物理特性的同时增加信息量[17]。其中,三波段植被指数-1(Three-band Vegetation Index-1,TVI-1)的构建借鉴了NDVI 的构建原理及形式,以(red+red-edge)代替NDVI中的红光波段,并将近红外波段乘以2使其在数值上与(red+red-edge)相当。三波段植被指数-2(Three-band Vegetation Index-2,TVI-2)的构建借鉴了DVI的构建原理及形式,同样以(red+red-edge)代替DVI中的红光波段,将近红外波段乘以2使其在数值上与(red+red-edge)相当。上述植被指数如式(2)和式(3)所示
TVI-1(2∙R1-R2-R3)/(2∙R1+R2+R3)(2)
TVI-22∙R1-R2-R3(3)
式中R1、R2、R3分别为3种波长的冠层反射率。
1.4.2 数据分析
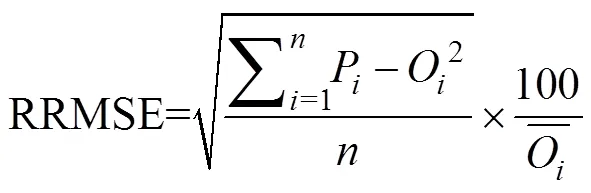
使用EXCEL2016软件进行数据处理和图表制作。将获取的作物冠层光谱信息构建的植被指数与农学参数进行拟合,通过回归分析构建作物生长监测模型。采用决定系数(coefficient of determination,2)和相对均方根误差(Relative Root Mean Square Error,RRMSE)来综合评价模型的性能。数据分析如式(4)和式(5)所示
2=SSR/SST (4)

2 结果与分析
2.1 便携式三波段作物生长监测仪获取水稻植被指数的性能评价
为评价CGMD303获取水稻植被指数的性能,将CGMD303和ASD获取的植被指数进行回归分析。如图 2所示,CGMD303获取的TVI-1和TVI-2与商用仪器ASD获取的对应值的拟合结果均呈线性关系,但不同植被指数的拟合精度存在一定差异。TVI-1的拟合结果优于TVI-2,趋势线接近1∶1线,R达到0.70,RRMSE为0.20,而TVI-2的相关性较低,R为0.25,RRMSE为0.49。该结果反映出CGMD303获取的660、730和815 nm反射率数值与ASD存在一定差异,因此两者获取的TVI-2性质差异也较大,而TVI-1在TVI-2的基础上除以(2815-730-660),一定程度上抵消了两者数值上的差异,因此TVI-1的拟合相关性更高。需要注意的是,尽管CGMD303和ASD获取的TVI-2的性质存在差异,但并不意味着TVI-2的稳定性较差,植被指数的性能仍需要与水稻生长指标进行拟合并验证。

图2 便携式三通道作物生长监测仪与便携式地物高光谱仪的植被指数测定值拟合关系
2.2 植被指数与生长指标的拟合结果
将CGMD303获取的三波段植被指数TVI-1和TVI-2分别与水稻生长指标LAI、LDW、LNC和LNA进行拟合构建监测模型。张洪程等[18]研究表明,水稻籼粳亚种之间在冠层结构、生理生化指标等方面均存在较大差异。因此,本研究将籼稻品种Ⅱ优728和粳稻品种淮稻5号独立构建监测模型,结果如图3所示。
植被指数与水稻LAI的拟合结果较高,TVI-1和TVI-2与各品种呈指数关系,而相同植被指数下Ⅱ优728的LAI数值大于淮稻5号。2种植被指数与LAI的拟合结果相近,其中TVI-1与籼、粳亚种LAI拟合的2分别为0.90、0.74,RRMSE分别为0.12、0.21,而TVI-2 的2分别为0.90、0.71,RRMSE分别为0.12、0.21。植被指数与LDW的拟合关系与LAI类似,也表现为Ⅱ优728的LAI数值大于淮稻5号。其中,TVI-1与淮稻5号LDW的拟合结果较好,2为0.62,RRMSE为0.21,而TVI-2与Ⅱ优728的拟合结果优于TVI-1,2为0.74,RRMSE为0.17。不同亚种水稻LNC的性质与LAI和LDW存在较大差异,淮稻5号的数值大于Ⅱ优728,TVI-1对两者的监测效果均优于TVI-2,2分别为0.70、0.38,RRMSE分别为0.11、0.16。LNA为LDW和LNC相乘获取的生长指标,同时包含了生物量和氮素的信息,因此籼粳亚种间的差异相比相比其他生长指标较小。其中,TVI-1与两种品种的拟合相关性均较高,2分别为0.79、0.59,RRMSE分别为0.22、0.31。上述结果表明,籼稻的生物量和LAI指标大于粳稻,而粳稻的氮素指标则大于籼稻,因此独立建模有利于提高模型的预测精度。
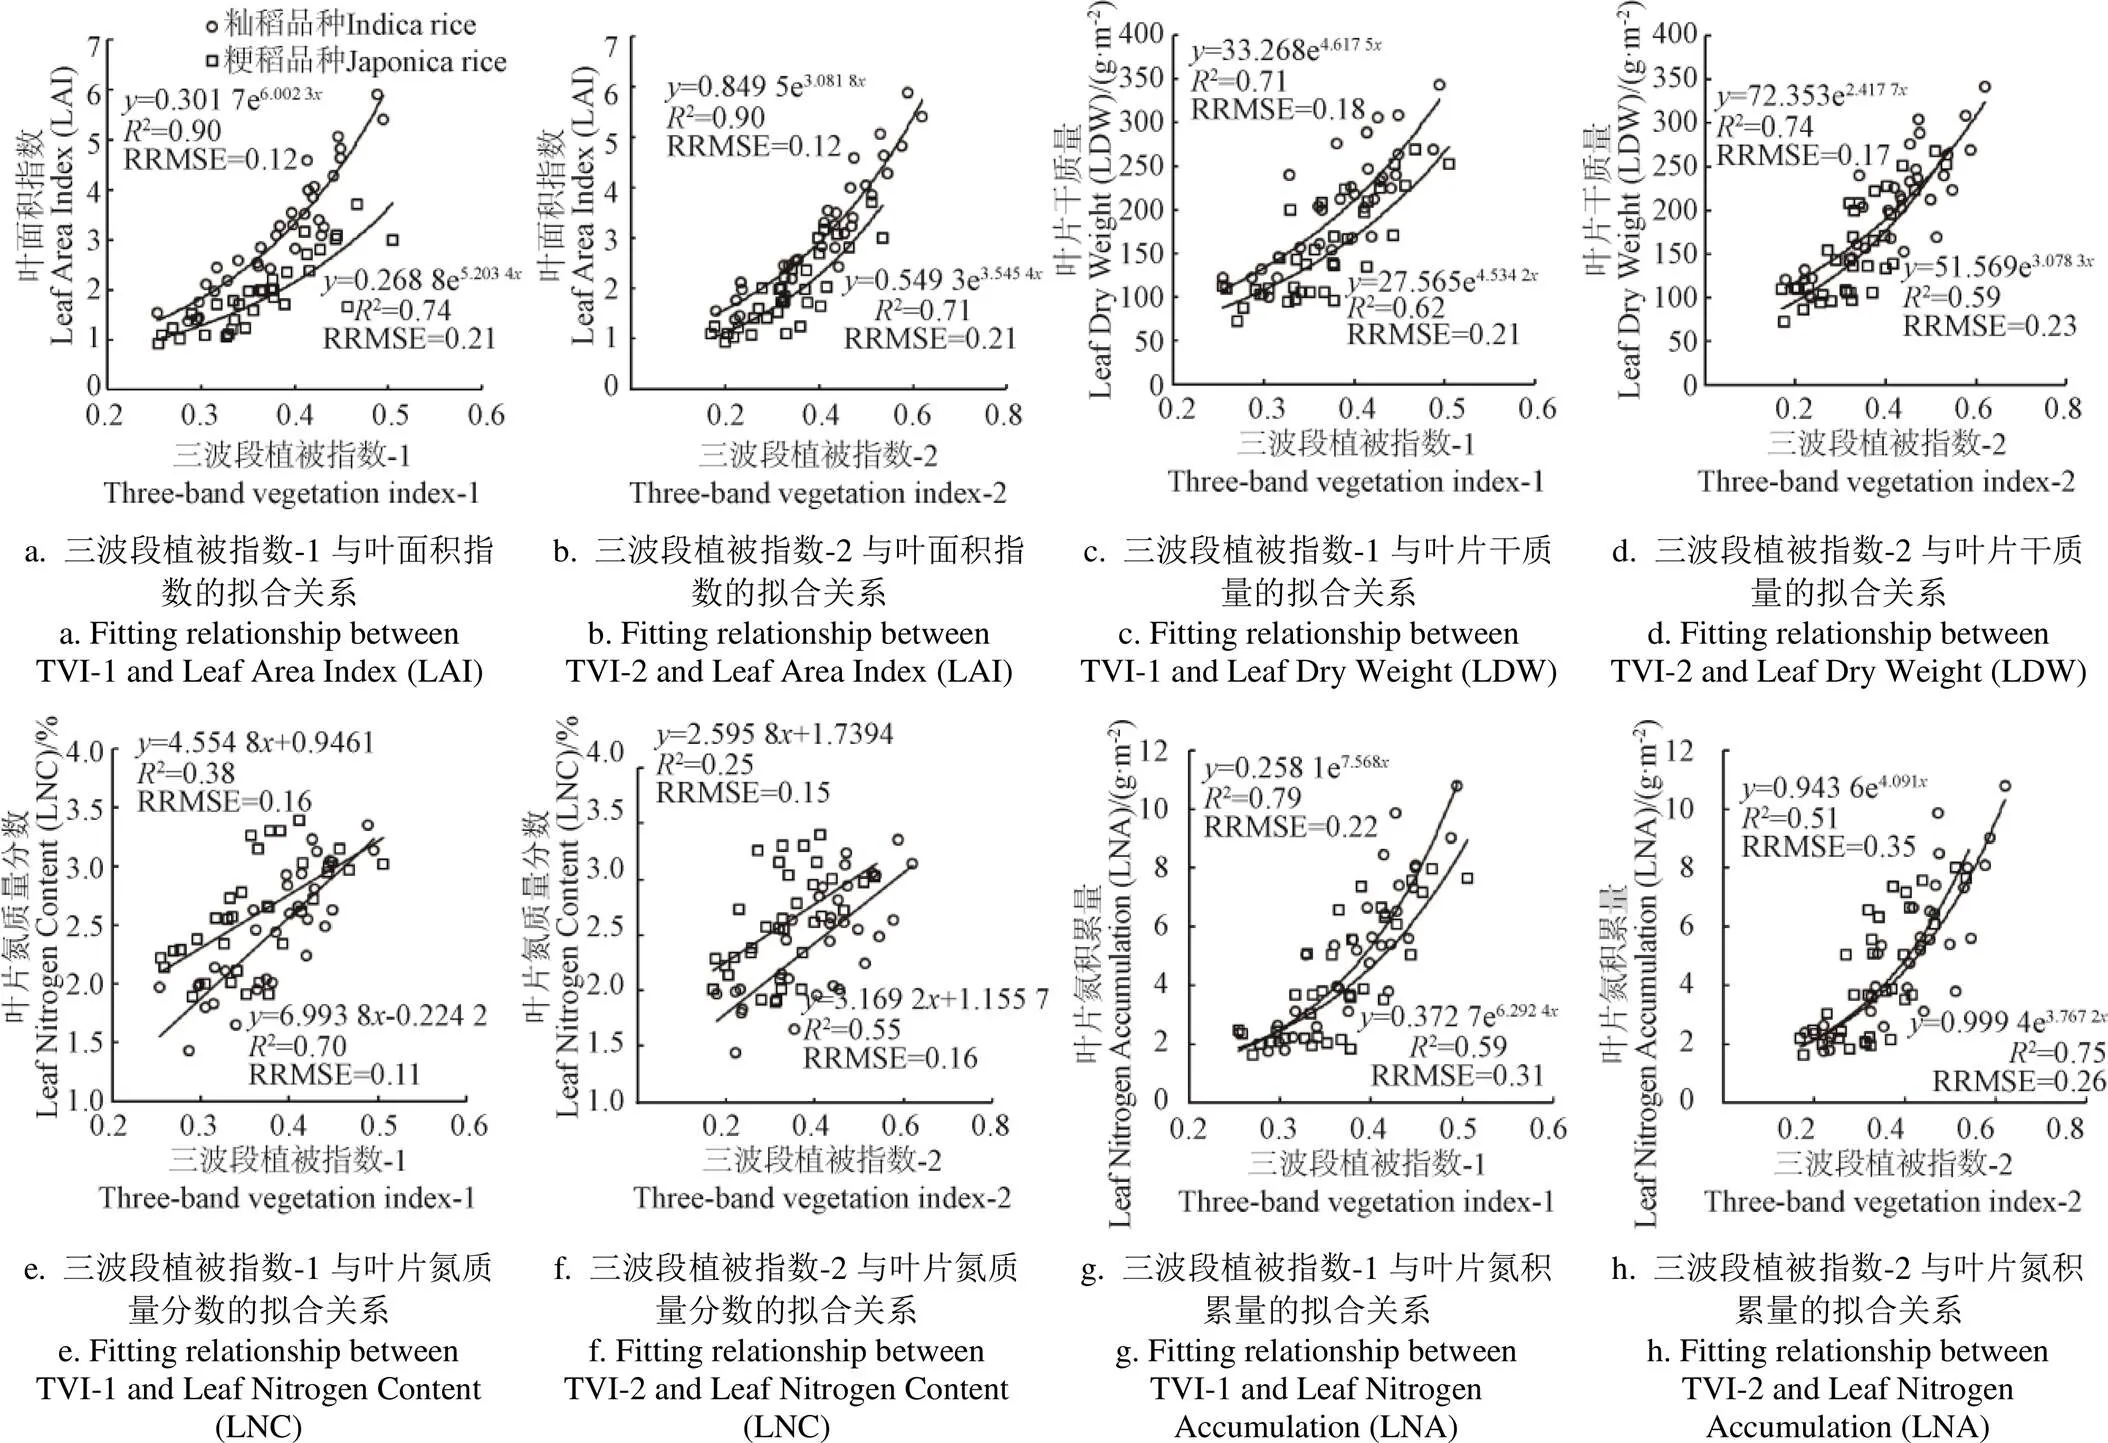
图3 植被指数与水稻生长指标的拟合关系
对构建的水稻生长指标监测模型的预测效果进行验证,各生长指标的实测值与预测值的拟合关系如图4所示。TVI-2对LAI、LDW、LNA的预测效果较好,2分别为0.85、0.72、0.68,RRMSE分别为0.21、0.32、0.39,而TVI-1则对LNC的预测效果优于TVI-2,2为0.45,RRMSE为0.13。该结果说明,TVI-1更适用于氮素指标的监测,而TVI-2则对LAI和生物量等指标更加敏感。
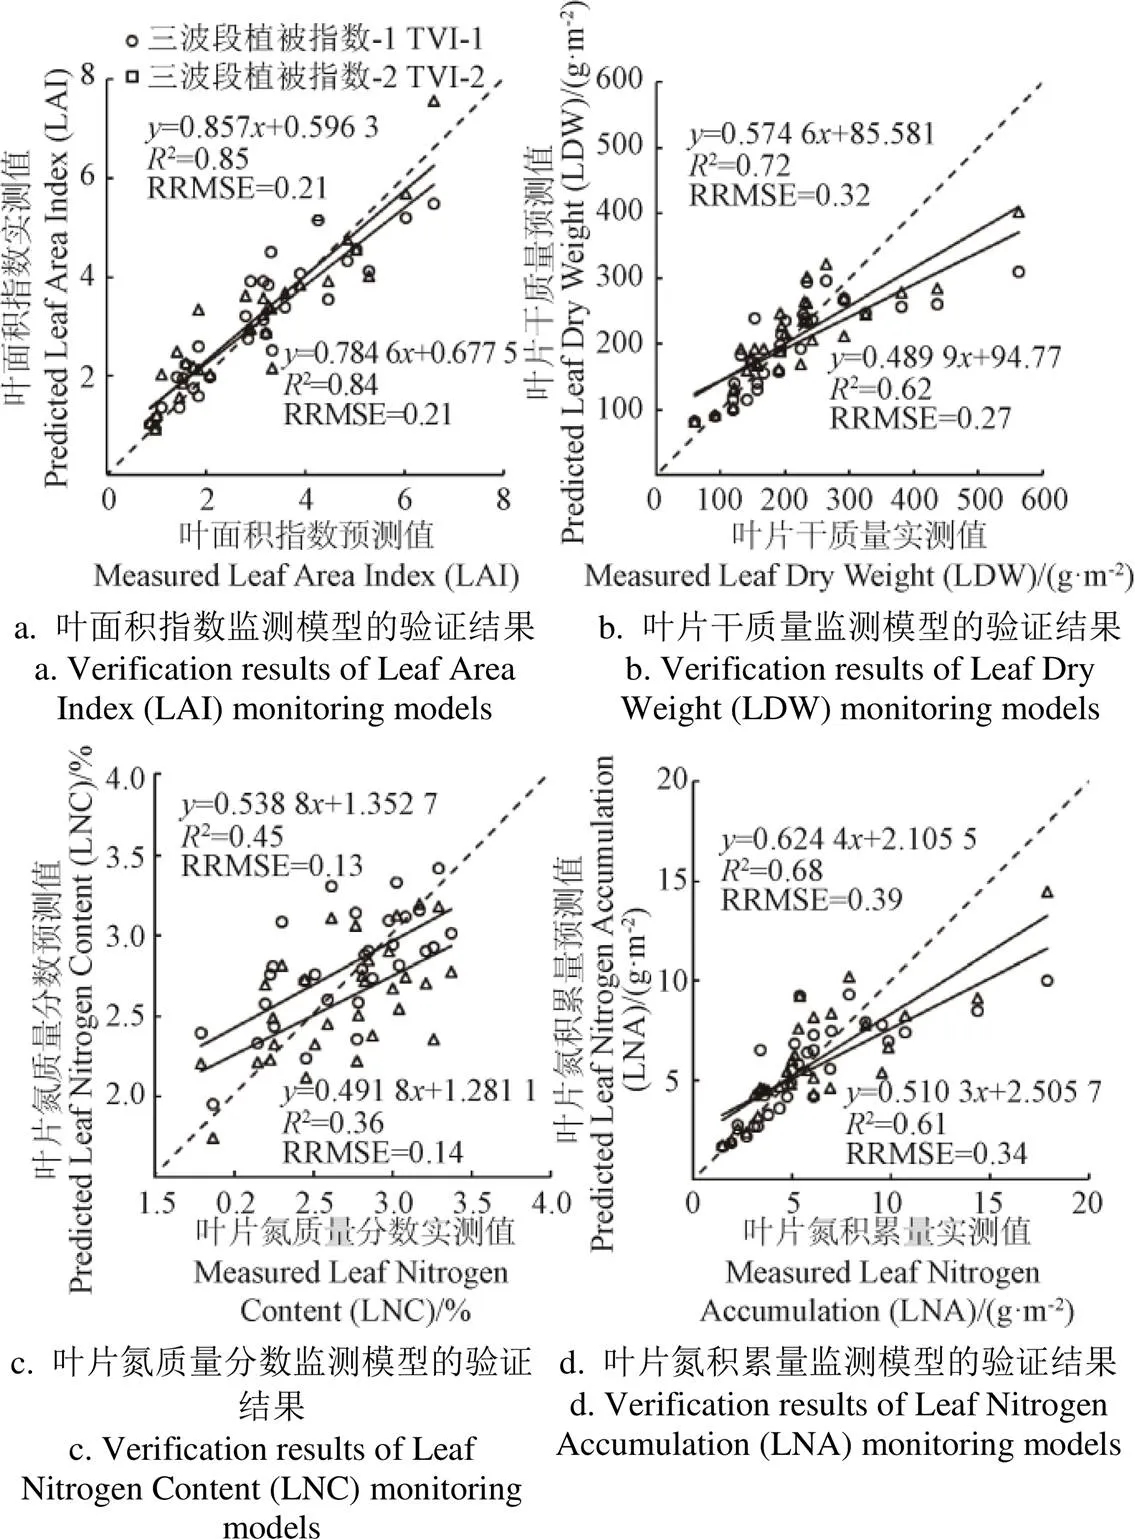
图4 水稻生长指标监测模型验证结果
3 讨 论
国内外研究机构基于作物光谱监测技术开发了一系列作物生长监测设备[19-20]。与GreenSeeker等两波段光谱仪相比,CGMD303丰富的信息量可以选择对应的最佳植被指数。尽管ASD FieldSpec等高光谱仪可以获取更多的植被指数,但这些设备获取的数据冗余过大且操作复杂,因此很难投入实际应用。CGMD303的3个波段经过前人研究筛选,对多种生长指标敏感,操作更加方便,更适合投入到田间实际应用中。
籼稻品种Ⅱ优728和粳稻品种淮稻5号在冠层结构和叶片氮质量分数方面均有较大差异。籼稻的植株高大,LAI和生物量指标相对较大,而粳稻叶色更深,LNC等氮素指标更大。Jacquemoud等[21]和Knyazikhin等[22]的研究表明,冠层反射率受叶片生理生化指标和冠层结构2个方面影响。叶片生理生化指标为叶绿素、氮素、钾素、含水量等指标,而冠层结构指标包括叶面积指数、覆盖度、叶倾角、叶方位角等指标,这些指标均会对光谱反射率造成不同程度的影响[23-24]。因此,在对水稻LNC进行监测的同时难免会受到来自冠层结构的影响,而仅依靠光谱仪无法分辨不同因素对信号的影响,从而形成“同物异谱”和“同谱异物”的现象[25-26]。因此,本研究将水稻品种作为一种先验信息有效地将目标群体分类从而提升了模型精度,在以后的研究中可以考虑通过先验信息对不同种植密度、生育期的群体进行进一步分类,降低冠层结构对光谱监测的干扰,这要求操作者具备一定农学知识或者在监测过程中使用其他传感器获取除光谱外的辅助数据[27-28]。
CGMD303对水稻LNC的监测能力始终低于其他生长指标。Verstraete等[29]指出,最佳植被指数应当与目标指标敏感性较高,而与其他指标敏感性较低。本研究所构建的植被指数与冠层群体大小指标敏感性较高,在进行LNC监测时难免会受到冠层群体大小的影响。薛利红等[30]指出绿光波段与蓝光波段组合构建的比值和归一化植被指数与水稻叶片氮质量分数呈显著负相关,预测精度达到80.09%。Tian等[31-32]使用蓝光和绿光波段对水稻进行监测,发现绿光新型比值植被指数SR(545,538)估测LNC的2达到0.73,而对LAI的敏感性较低,一定程度上消除了冠层大小对LNC预测的影响;蓝光波段构建的三波段植被指数434/(496+401)预测水稻LNC的2达到0.84,普适性也较好。因此,未来多光谱作物生长传感器的开发可以考虑选择绿光、蓝光等更多波段组合的传感器。
4 结 论
1)本研究使用便携式三波段作物生长监测仪CGMD303(Crop-Growth Monitoring and Diagnosis,CGMD)获取了拔节期、孕穗期和抽穗期的水稻冠层植被指数并与商用高光谱仪(Analytical Spectral Devices FieldSpec HandHeld 2,ASD)进行了拟合,结果表明,CGMD303与ASD获取的植被指数呈线性关系,其中TVI-1的拟合结果更好,决定系数(coefficient of determination,2)达到0.70,相对均方根误差(Relative Root Mean Square Error,RRMSE)为0.20。CGMD303可以有效获取水稻冠层光谱数据,数据获取精确、稳定。
2)利用CGMD303获取的三波段植被指数TVI-1和TVI-2可以实现对水稻叶面积指数(Leaf Area Index,LAI)、叶片干质量(Leaf Dry Weight,LDW)、叶片氮质量分数(Leaf Nitrogen Content,LNC)、叶片氮积累量(Leaf Nitrogen Accumulation,LNA)的有效预测,2分别为0.85、0.72、0.45和0.68,RRMSE分别为0.21、0.32、0.13和0.39。CGMD303监测精度高、操作简单、性价比高,可用于水稻田间栽培指导工作。
[1] 朱德峰,程式华,张玉屏,等. 全球水稻生产现状与制约因素分析[J]. 中国农业科学,2010,43(3):474-479. Zhu Defeng, Cheng Shihua, Zhang Yuping, et al. Analysis of status and constraints of rice production in the world[J]. 2010, 43(3): 474-479. (in Chinese with English abstract)
[2] 凌启鸿,张洪程,丁艳锋,等. 水稻高产技术的新发展:精确定量栽培[J]. 中国稻米,2005,11(1):3-7. Ling Qihong, Zhang Hongcheng, Ding Yanfeng, et al. Development of rice high-yielding techniques: Precisely fixed quantity planting[J]. 2005, 11(1): 3-7. (in Chinese with English abstract)
[3] 曹卫星,朱艳,田永超,等. 作物精确栽培技术的构建与实现[J]. 中国农业科学,2011,44(19):3955-3969. Cao Weixing, Zhu Yan, Tian Yongchao, et al. Development and implementation of crop precision cultivation technology[J]. Scientia Agricultura Sinica, 2011, 44(19): 3955-3969. (in Chinese with English abstract)
[4] 姚霞. 小麦冠层和单叶氮素营养指标的高光谱监测研究[D].南京:南京农业大学,2009. Yao Xia. Monitoring Nitrogen Status at Canopy and Leaf Scales with Hyperspectral Sensing in Wheat[D]. Nanjing: Nanjing Agricultural University, 2009. (in Chinese with English abstract)
[5] 李映雪,朱艳,戴廷波,等. 小麦叶面积指数与冠层反射光谱的定量关系[J]. 应用生态学报,2006,17(8):1443-1447. Li Yingxue, Zhu Yan, Dai Tingbo, et al. Quantitative relationships between leaf area index and canopy reflectance spectra of wheat[J]. Chinese Journal of Applied Ecology, 2006, 17(8): 1443-1447. (in Chinese with English abstract)
[6] 姚霞,朱艳,田永超,等. 小麦叶层氮含量估测的最佳高光谱参数研究[J]. 中国农业科学,2009,42(8):2716-2725. Yao Xia, Zhu Yan, Tian Yongchao, et al. Research of the optimum hyperspectral vegetation indices on monitoring the nitrogen content in wheat leaves[J]. Scientia Agricultura Sinica, 2009, 42(8): 2716-2725. (in Chinese with English abstract)
[7] 冯伟,朱艳,姚霞,等. 基于高光谱遥感的小麦叶干重和叶面积指数监测[J]. 植物生态学报,2009,33(1):34-44. Feng Wei, Zhu Yan, Yao Xia, et al. Monitoring leaf dry weight and leaf area index in wheat with hyperspectral remote sensing[J]. Chinese Journal of Plant Ecology, 2009, 33(1): 34-44. (in Chinese with English abstract)
[8] Zhang Jiayi, Liu Xia, Liang Yan, et al. Using a portable active sensor to monitor growth parameters and predict grain yield of winter wheat[J]. Sensors, 2019, 19(5): 1108-1125.
[9] Zhu Yan, Yao Xia, Tian Yongchao, et al. Analysis of common canopy vegetation indices for indicating leaf nitrogen accumulations in wheat and rice[J]. International Journal of Applied Earth Observation and Geoinformation, 2008, 10(1): 1-10.
[10] Chu Xu, Guo Yongjiu, He Jiaoyang, et al. Comparison of different hyperspectral vegetation indices for estimating canopy leaf nitrogen accumulation in rice[J]. Agronomy Journal, 2014, 106(5): 1911-1920.
[11] Datt B. A new reflectance index for remote sensing of chlorophyll content in higher plants: Tests using eucalyptus leaves[J]. Journal of Plant Physiology, 1999, 154(1): 30-36.
[12] Rodriguez D, Fitzgerald G J, Belford R, et al. Detection of nitrogen deficiency in wheat from spectral reflectance indices and basic crop eco-physiological concepts[J]. Australian Journal of Agricultural Research, 2006, 57(7): 781-789.
[13] Wang Wei, Yao Xia, Yao Xinfeng, et al. Estimating leaf nitrogen concentration with three-band vegetation indices in rice and wheat[J]. Field Crops Research, 2012, 129: 90-98.
[14] 杨建宁,张井超,朱艳,等. 便携式作物生长监测诊断仪性能试验[J]. 农业机械学报,2013,44(4):208-212,201. Yang Jianning, Chao Jingchao, Zhu Yan, et al. Experiments on performance of portable plant growth monitoring diagnostic instrument[J]. Transactions of the Chinese Society for Agricultural Machinery, 2013, 44(4): 208-212, 201. (in Chinese with English abstract)
[15] 倪军,姚霞,田永超,等. 便携式作物生长监测诊断仪的设计与试验[J]. 农业工程学报,2013,29(6):150-156. Ni Jun, Yao Xia, Tian Yongchao, et al. Design and experiments of portable apparatus for plant growth monitoring and diagnosis[J]. Transactions of the Chinese Society of Agricultural Engineering (Transactions of the CSAE), 2013, 29(6): 150-156. (in Chinese with English abstract)
[16] Ni Jun, Zhang Jingchao, Wu Rusong, et al. Development of an apparatus for crop-growth monitoring and diagnosis[J]. Sensors, 2018, 18(9): 3129-3149.
[17] 田永超. 基于高光谱遥感的水稻氮素营养参数监测研究[D].南京:南京农业大学,2008. Tian Yongchao. Monitoring Nitrogen Nutrition Parameters with Hyperspectral Remote Sensing in Rice[D]. Nanjing: Nanjing Agricultural University, 2008. (in Chinese with English abstract)
[18] 张洪程,许轲,张军,等. 双季晚粳生产力及相关生态生理特征[J]. 作物学报,2014,40(2):283-300. Zhang Hongcheng, Xu Ke, Zhang Jun, et al. Productivity and eco-physiological characteristics of late Japonica rice in double-cropping system[J]. Acta Agronomica Sinica, 2014, 40(2): 283-300. (in Chinese with English abstract)
[19] Erdle K, Mistele B, Schmidhalter U. Comparison of active and passive spectral sensors in discriminating biomass parameters and nitrogen status in wheat cultivars[J]. Field Crops Research, 2011, 124(1): 74-84.
[20] Hansen P M, Schjoerring J K. Reflectance measurement of canopy biomass and nitrogen status in wheat crops using normalized difference vegetation indices and partial least squares regression[J]. Remote Sensing of Environment, 2003, 86(4): 542-553.
[21] Jacquemoud S, Baret F. PROSPECT: A model of leaf optical properties spectra[J]. Remote Sensing of Environment, 1990, 34(2): 75-91.
[22] Knyazikhin Y, Schull M A, Stenberg P, et al. Hyperspectral remote sensing of foliar nitrogen content[J]. Proceedings of the National Academy of Sciences of the United States of America, 2013, 110(3): 811-812.
[23] Jia Min, Li Wei, Wang Kangkang, et al. A newly developed method to extract the optimal hyperspectral feature for monitoring leaf biomass in wheat[J]. Computers and Electronics in Agriculture, 2019, 165(1): 104942-104948.
[24] Vanderbilt V C, Grant L. Plant canopy specular reflectance model[J]. IEEE Transactions on Geoscience and Remote Sensing, 1985, 23(5): 722-730.
[25] Ustin S L. Remote sensing of canopy chemistry[J]. Proceedings of the National Academy of Sciences, 2013, 110(3): 804-805.
[26] Townsend P A, Serbin S P, Kruger E L, et al. Disentangling the contribution of biological and physical properties of leaves and canopies in imaging spectroscopy data[J/OL]. Proceedings of the National Academy of Sciences, 2013, 110(12), [2013-03-19], https: //doi. org/10. 1073/pnas. 1300952110.
[27] Darvishzadeh R, Skidmore A, Atzberger C, et al. Estimation of vegetation LAI from hyperspectral reflectance data: Effects of soil type and plant architecture[J]. International Journal of Applied Earth Observation and Geoinformation, 2008, 10(3): 358-373.
[28] Peng Yi, Nguy-Robertson A, Arkebauer T, et al. Assessment of canopy chlorophyll content retrieval in maize and soybean: Implications of hysteresis on the development of generic algorithms[J]. Remote sensing, 2017, 9(3): 226-241.
[29] Verstraete M M, Pinty B. Designing optimal spectral indexes for remote sensing applications[J]. IEEE Transactions on Geoscience and Remote Sensing, 1996, 34(5): 1254-1265.
[30] 薛利红,杨林章,范小晖. 基于碳氮代谢的水稻氮含量及碳氮比光谱估测[J]. 作物学报,2006,32(3):430-435. Xue Lihong, Yang Linzhang, Fan Xiaohui. Estimation of nitrogen content and C/N in rice leaves and plant with canopy reflectance spectra[J]. Acta Agronomica Sinica, 2006, 32(3): 430-435. (in Chinese with English abstract)
[31] Tian Yongchao, Yao Xia, Yang Jie, et al. Assessing newly developed and published vegetation indices for estimating rice leaf nitrogen concentration with ground- and space-based hyperspectral reflectance[J]. Field Crops Research, 2011, 120(2): 299-310.
[32] Tian Yongchao, Gu Kaijian, Chu Xu, et al. Comparison of different hyperspectral vegetation indices for canopy leaf nitrogen concentration estimation in rice[J]. Plant and Soil, 2014, 376(1/2): 193-209.
Monitoring rice growth based on a portable three-band instrument for crop growth monitoring and diagnosis
Lin Weipan, Li Huaimin, Ni Jun, Jiang Xiaoping, Zhu Yan※
(1.,,210095,; 2.,210095,; 3.,,210095,; 4.,210095,)
The development of instruments for monitoring and diagnosing crop growth quickly and non-destructively obtain crop growth information, which is very helpful for the production and management of crop fields.Aimed at the problems with the existing two-band instrument used for crop growth monitoring and diagnosis, such as relying on a single vegetation index and low accuracy of growth index retrieval, this study developed a portable three-band instrument for crop-growth monitoring and diagnosis CGMD303 (Crop-Growth Monitoring and Diagnosis, CGMD).The CGMD303 instrument consisted of a multi-spectral crop growth sensor, processor system, sensor holder, level, shielded cable, and other components. Multi-spectral crop sensors were divided into upward light sensors and downward light sensors in structure. The upward light sensor could receive solar radiation information in the 660, 730, and 815 nm bands; the downward light sensor consisted of three detector lenses, which were used to detect the characteristic wavelengths of 660, 730, and 815 nm, respectively. The radiation information would be processed after being converted to electrical signals through the photoelectric detector. To test the monitoring performance of CGMD303 on rice growth, rice field experiments were conducted from July 2018 to September 2018 at the demonstration base of the National Engineering and Technology Center for Information Agriculture in Rugao City, Jiangsu Province, China (32°27′N, 120°77′E), and 2 varieties (Liangyou 728 and Huaidao NO.5), 3 nitrogen levels (0, 150 and 360 kg/hm2) and 2 planting density levels (30 cm×15 cm and 50 cm×15 cm) were set in the rice experiments. The canopy spectral reflectance of 660, 730, and 815 nm was obtained at the jointing stage, booting stage, and heading stage of rice and 2 new three-band vegetation indices were constructed. Fitting results of the vegetation indices obtained by CGMD303 and the commercial instrument ASD FieldSpec HandHeld2 showed a good linear correlation, indicating that CGMD303 effectively obtained rice canopy reflectance. Two three-band vegetation indices obtained by CGMD303 and rice growth parameters were fitted to construct rice growth monitoring models. The highest coefficient of determination values of the three-band vegetation indices and leaf area index, leaf dry weight, leaf nitrogen content, and leaf nitrogen accumulation of indica rice were 0.90, 0.74, 0.70, 0.79, respectively, and the relative root mean square error was 0.12, 0.17, 0.11, 0.22, respectively;the highest coefficient of determination values of the three-band vegetation indices and corresponding growth indices of Japonica rice were 0.74, 0.62, 0.38, 0.59, respectively, and the relative root mean square error was 0.21, 0.21, 0.16, 0.31, respectively. The prediction accuracy of the rice growth monitoring models based on CGMD303 for each growth parameters was tested and the coefficient of determination of leaf area index, leaf dry weight, leaf nitrogen content, and leaf nitrogen accumulation of rice were 0.85, 0.72, 0.45, 0.68, respectively, and the relative root mean square error were 0.21, 0.32, 0.13, 0.39, respectively.Verification results showed that CGMD303 could accurately predict leaf area index, biomass, and nitrogen indices of rice.CGMD303 had the advantages of accurate and stable data acquisition, simple operation, high-cost performance, etc. It was suitable for field operations and had high application potential.
rice; monitoring; spectra; models; growth parameters; portable monitor
林维潘,李怀民,倪军,等. 基于便携式三波段作物生长监测仪的水稻长势监测[J]. 农业工程学报,2020,36(20):203-208.doi:10.11975/j.issn.1002-6819.2020.20.024 http://www.tcsae.org
Lin Weipan, Li Huaimin, Ni Jun, et al. Monitoring rice growth based on a portable three-band instrument for crop growth monitoring and diagnosis[J]. Transactions of the Chinese Society of Agricultural Engineering (Transactions of the CSAE), 2020, 36(20): 203-208. (in Chinese with English abstract) doi:10.11975/j.issn.1002-6819.2020.20.024 http://www.tcsae.org
2020-07-01
2020-09-06
国家重点研发计划(2017YFD0201501);江苏省六大人才高峰项目(XYDXX-049);江苏省重点研发计划(BE2018399)
林维潘,主要从事农学信息工程领域的研究。Email:2018814037@njau.edu.cn
朱艳,教授,博士生导师,主要从事农业信息技术领域的研究。Email:yanzhu@njau.edu.cn
10.11975/j.issn.1002-6819.2020.20.024
S237,TP73
A
1002-6819(2020)-20-0203-06