Constitutive modeling of f ow behavior and processing maps of Mg-8.1 Gd-4.5Y-0.3Zr alloy
2020-12-18XiangshngXiaKuiZhangMinglongMaTingLi
Xiangshng Xia,Kui Zhang,Minglong Ma,Ting Li
a State Key Laboratory of Non-Ferrous Metals and Processes,GRINM Co.,Ltd.,Beijing 100088,China
b GRIMAT Engineering Institute Co.,Ltd,Beijing 101400,China
cGeneral Research Institute for Non-Ferrous Metals,Beijing 100088,China
d Southwest Technology and Engineering Research Institute,Chongqing 400039,China
e National Center of Analysis and Testing for Nonferrous Metals and Electronic Materials,China United Test & Certificatio Co.,Ltd.,GRINM Group Co.,Ltd,Beijing 100088,China
Received 16 August 2019;received in revised form 26 December 2019;accepted 10 February 2020 Available online 26 June 2020
Abstract High temperature deformation behavior and workability of Mg-8.1Gd-4.5Y-0.3Zr alloy were studied by compression tests.Arrhenius equation with strain compensation and processing maps were established.The results show that the activation energy Q,structure factorα,n and ln A varies with the strain,its relationship f t well by f fth order polynomial.The fl w stresses predicted by the extracted model are in good agreement with the experimental results.There are f ve typical domains in the processing map,and the deformation mechanisms in different domains were determined by microstructure analysis.The feasible processing window of the alloy is in the areas of 400-500°C/0.001-0.1 s−1.© 2020 Published by Elsevier B.V.on behalf of Chongqing University.This is an open access article under the CC BY-NC-ND license.(http://creativecommons.org/licenses/by-nc-nd/4.0/)Peer review under responsibility of Chongqing University
Keywords:Mg-Gd-Y-Zr alloy;Workability;Strain compensation;Processing map.
1.Introduction
Magnesium alloys,which are known to be the lightweight metal material,are attractive for use in automobile,aeronautics,astronautics and electronics field[1].Some commercial magnesium alloys(AZ31,ZK60,etal)have been developed until now.However,the applications in those field are still very limited due to the low strength and poor thermal stability.To overcome this disadvantage,some efforts have been conducted to develop high strength magnesium alloys to extend their applications into high-load-bearing areas.The magnesium alloys with RE elements addition have excellent strength and high creep resistance[2].Socjusz-Podosek et al.[3]and Zhang et al.[4]reported the mechanical properties increase obviously by incorporation of Y increases due to solution and precipitation hardening.Among Mg-RE magnesium alloys,the Mg-Gd-Y systems have been received much attention.Yu et al.[5]reported that the UTS,YS and elongation of the Mg-11.5Gd-4.5Y-0.3Zr alloy after extrusion reach to 402MPa,336MPa and 7.6%,respectively.The UTS and YS reached to 483MPa and 423MPa after T5 treatment.Li et al.[6]obtained Mg-12Gd-3Y-0.6Zr alloy with UTS of 446MPa after secondary extrusion and ageing.Yu et al.[7]reported a high-strength Mg-8.12Gd-1.82Y-0.35Zr alloy exhibited the UTS of 456MPa and YS of 426MPa.Gao et al.[8]studied the microstructure and mechanical property of Mg-8.57Gd-3.72Y-0.54Zr alloy after forging and ageing and found that the extruded-T5 alloy exhibited the UTS of 441MPa and YS of 338MPa.The excellent mechanical performance of the Mg-Gd-Y-Zr alloy mainly associated with grain refinement solution strengthening andβ′precipitation in Mg matrix.
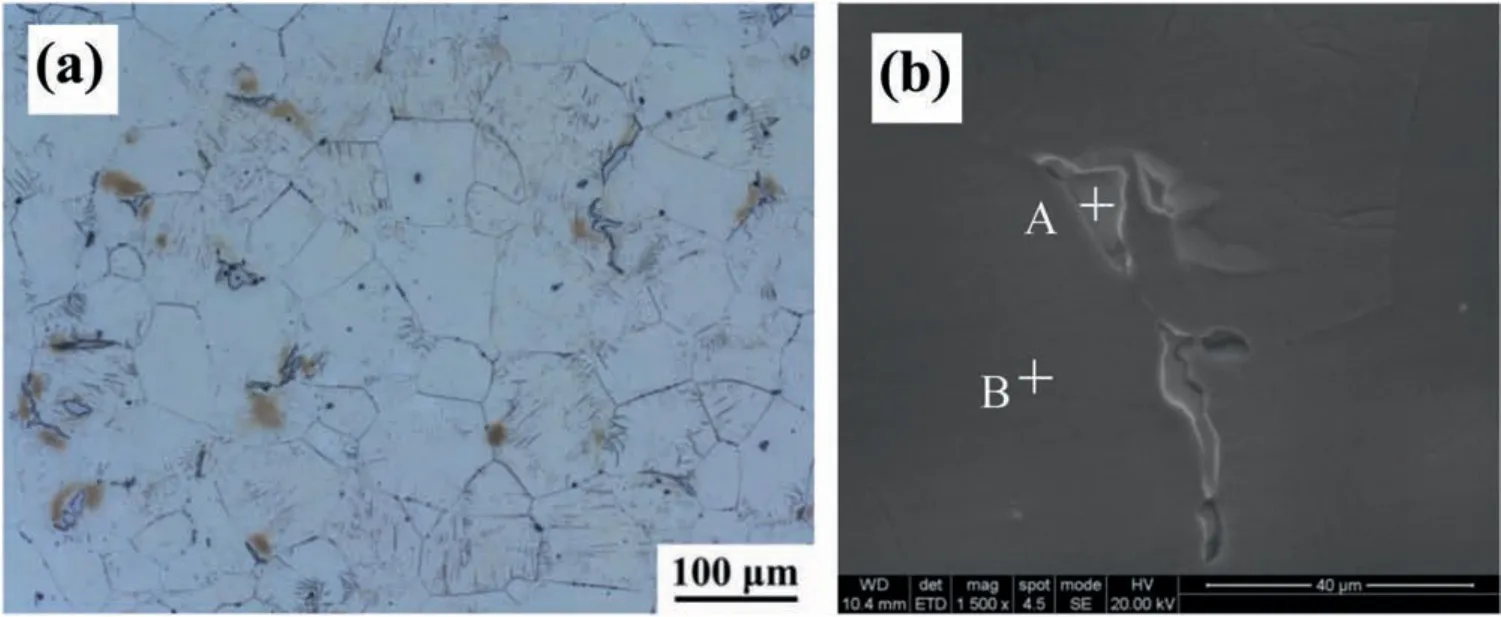
Fig.1.OM and SEM microstructures of the as-cast alloy.
For the magnesium alloys,the fina mechanical property is deeply affected by the deformation conditions[9].The different deformation mechanisms dominate the change of microstructure under different hot deforming conditions,resulting in the different mechanical property.The processing map base on the dynamic material model is widely used to study the optimum deformation parameters in some previous studies[10-12].For example,Li et al.[10]and Tahreen et al.[11]determined the optimum hot working conditions of Mg-Gd-Y-Zn-Zr alloy and Mg-Zn-Mn-Y magnesium alloy using hot processing maps.Hadadzadeh et al.[12]investigated the influenc of initial texture and microstructure on the hot deformation behavior and found that deformation mechanism of radial direction and extrusion direction sample is very close from processing map,however the activation energy of extrusion direction sample is higher than that of the radial direction samples,and the fina texture was strongly dependent on the deformation direction.
In order to obtain the deformation mechanisms and optimum hot working condition,high temperature deformation behavior and workability of Mg-8.1Gd-4.5Y-0.3Zr alloy was studied by compression tests in this paper.Arrhenius equation with strain compensation was used to describe the fl w behavior.Meanwhile,the processing maps based on DMM model were established,and the microstructures in different domains in processing map also carried out to correlate the deformation mechanism.
2.Materials and experimental procedures
The Mg-8.1wt% Gd-4.5wt% Y-0.3wt.%Zr alloy withΦ165 mm×4000mm was fabricated using semi-continuous casting.The cylindrical samples withΦ8 mm×12mm were prepared from the cast ingot.The temperature and strain rate were 300-500°C and 0.001-1 s−1.The maximum strain was 0.9.Gleeble 3500 simulator was used to conduct the hot compression tests.The heating rate was 5°C/s and the samples were held for 2min at set temperature.Graphite sheets were used to minimize friction.The samples were quenched into water after hot deformation.The surfaces for OM observationwere etched using 4% HNO3with ethanol solution.Tensile testing was performed on a MTS material testing machine.

Table 1EDS results of micro-constitution in Fig.1(b)(wt%).
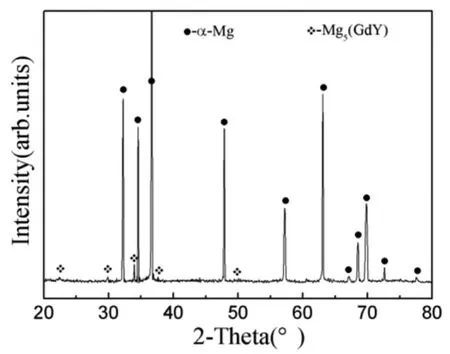
Fig.2.XRD pattern of the as-cast alloy.
3.Results and discussion
3.1.Initial microstructure
Fig.1 shows the microstructure of as-cast Mg-8.1Gd-4.5Y-0.3Zr alloy.From Fig.1a,the as-cast alloy consist ofα-Mg matrix and second phase,and the compositions of second phase(marked A)andα-Mg matrix(marked B)in Fig.1b were examined by EDS,as shown in Table 1,together with the result of the XRD in Fig.2,the second phase is Mg5(GdY).
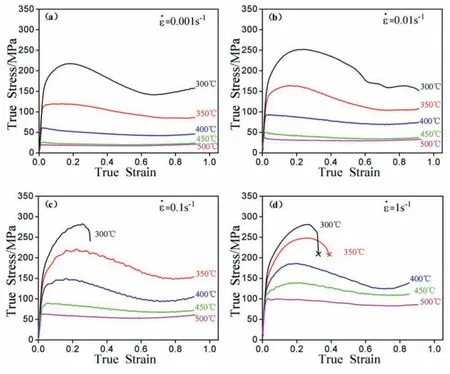
Fig.3.True stress-true strain curves of the alloy obtained from the compression tests at(a)˙ε=0.001s−1,(b)˙ε=0.01s−1,(c)˙ε=0.1s−1,(d)˙ε=1s−1.
3.2.Flow behavior
Fig.3 shows the f ow curves obtained at different conditions.On the whole,the stress rises rapidly with strain to the maximum stress,after that,the stress decreases gradually.Further increase the strain,the stress shows a different variation trend.When the samples deformed at 350 °C/0.1 s−1and 400 °C/0.1 s−1and 1 s−1,the stress increases gradually with strain increase and the second strain hardening can be observed.When the samples deformed at other conditions,the stress almost has no change with the stain increase.It also can be seen that the samples show early failures when deformed at 300 °C/0.1 s−1and 1 s−1and 350 °C/1 s−1.Fig.4 shows the relationship between the peak stresses and temperature at strain of 0.3.At a given deformation temperature,the stress decreases when the strain rate decrease,and the stress increases as temperature decrease at a given strain rate.The shapes of fl w curves are the response of hot deformation mechanisms.In the early stage of deformation,the deformation process is dominated by the work hardening,resulting in the rapidly increase of stress.After that,the stress reaches the maximum value due to the interaction of work hardening and softening[13],and state stress is observed when they reach a dynamic equilibrium.However,only from the fl w curves cannot determine the hot workability,for example,dynamic recrystallization or superplasticity can result in the steady state f ow curve.
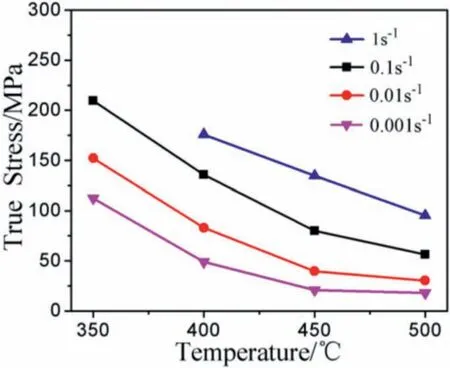
Fig.4.Variation of f ow stress with temperature at a strain of 0.3.
3.3.Constitutive equation
Many types of constitutive equation were developed so far,the most commonly used one is proposed by Sellars and McTegart and can be express as[14]

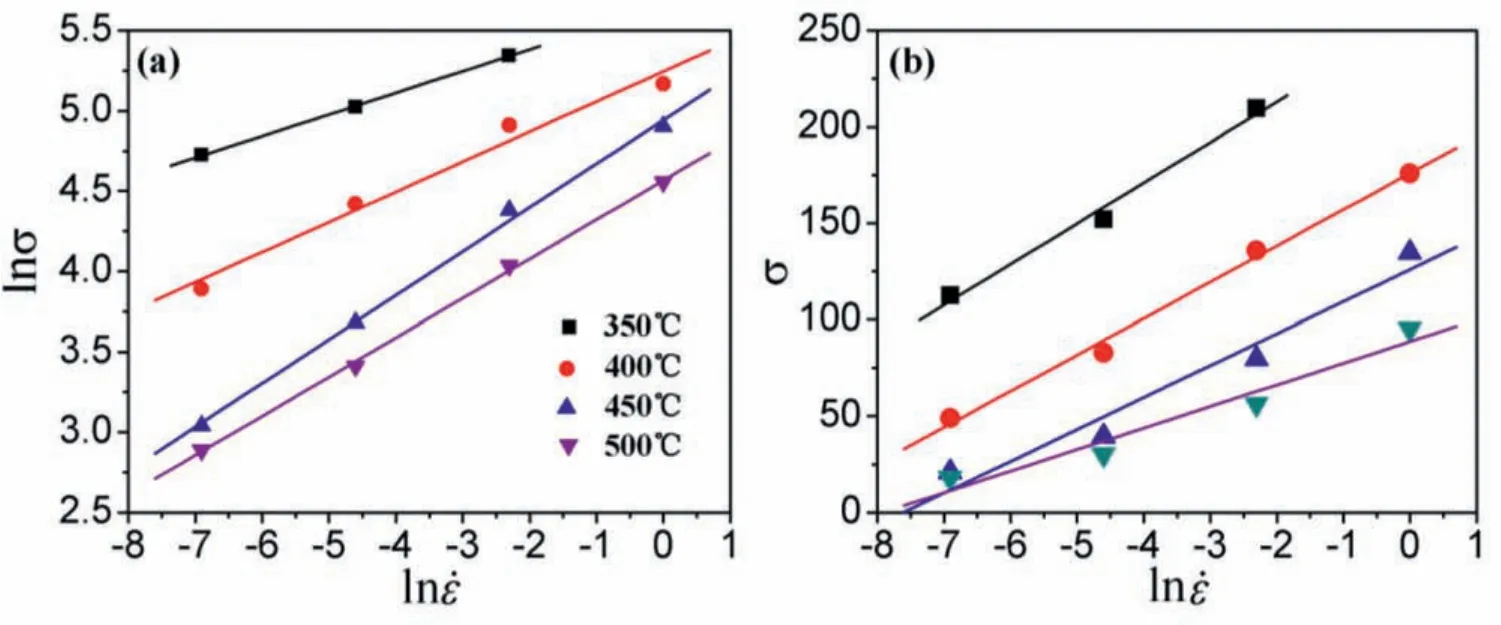
Fig.5.Relationship between ln˙εand(a)lnσand(b)σ.
whereA,A1,A2(s−1)α,β,nandn1are the structure factor,α=β/n1;σis the f ow stress(MPa),which always choose as the static stress or peak stress;Qis activation energy used to reflec the ease of plastic deformation(KJ/mol);Ris the gas constant.In Eq.(1),the power law is conventionally employed for low-stress level(ασ<0.8),and exponential law is appropriate for high stress(ασ>0.8),whereas the hyperbolic sine-type equation can be used in broad range of stresses[15].The stress obtained at different deformation condition is used to determine the material constants.In the present investigation,the strain of 0.3 was chosen.
The power and exponential law in Eq.(1)can be written as

To simplify the above equations,taking natural logarithmic gives:

From the above equations,n1=dln˙ε/dlnσ,β=dln˙ε/dσ,therefore,then1andβis the slope of lnσ−ln˙εandσ−ln˙εplot,respectively.Fig.5 shows the linear relationships of lnσ−ln˙εandσ−ln˙εplot.The averagen1andβare obtained as 4.760 and 0.0591 by the linear fittin method,and the stress multiplierαcould be calculated asα=β/n1=0.012.
For all the stress level,taking natural logarithms of the hyperbolic sine-type equation in Eq.(1)yields

If˙εis a constant,Eq.(6)can be described as

According to Eq.(7),then′is the slope of ln˙ε−ln[sinh(ασ)]plot,and theSis the slope of ln[sinh(ασ)]−1/Tplot.From Fig.6,the averagen′andSare obtained as 3.437 and 6.739,and the averageQcould be calculated as 192.568KJ/mol.
Eq.(1)can be written as the form including Zener-Hollomon parameter as follow[16]:

Taking natural logarithmic of Eq.(8)gives:

According to Eq.(9),n=dlnZ/dln[sinh(ασ)],therefore,thenis the slope of lnZ-ln[sinh(ασ)]plot.From Fig.7,thenis calculated as 3.319.The intercept is accepted as lnA,then lnA=28.869,of whichAvalue is obtained as 3.448×10¹²s−1.
According to the obtained parameters,the constitutive equation can be expressed as

The stress is a key parameter for the process design,From Eq.(10),it is clear that the stress only relies on temperature and strain rate,the effect of strain is not considered.However,many recent reports showed that the material constants changed with the strain[17,18].Therefore,the strain should be introduced to the constitutive equation so that the fl w stress can be predicted more accurately.According to the aforementioned calculation method,the values ofQ,α,nand lnAwere calculated in the strain range of 0.1-0.8 and fitte using a f fth order polynomial,as shown in Fig.8.The fift order polynomial is as shown below.

From Fig.8,it illustrates that the value ofαdecreases firs to 0.01196 and then increases to about 0.01529 with strain increase,further increase the strain,the value ofαhas a decrease trend.With the strain increase,the value ofndecreases firs and then increases.The variation ofQand lnAexhibits a similar characteristic,which decrease gradually to about 166.3174 and 24.27071 with strain increase,respectively.The polynomial f tting coefficient in Fig.8 are provided in Table 2.
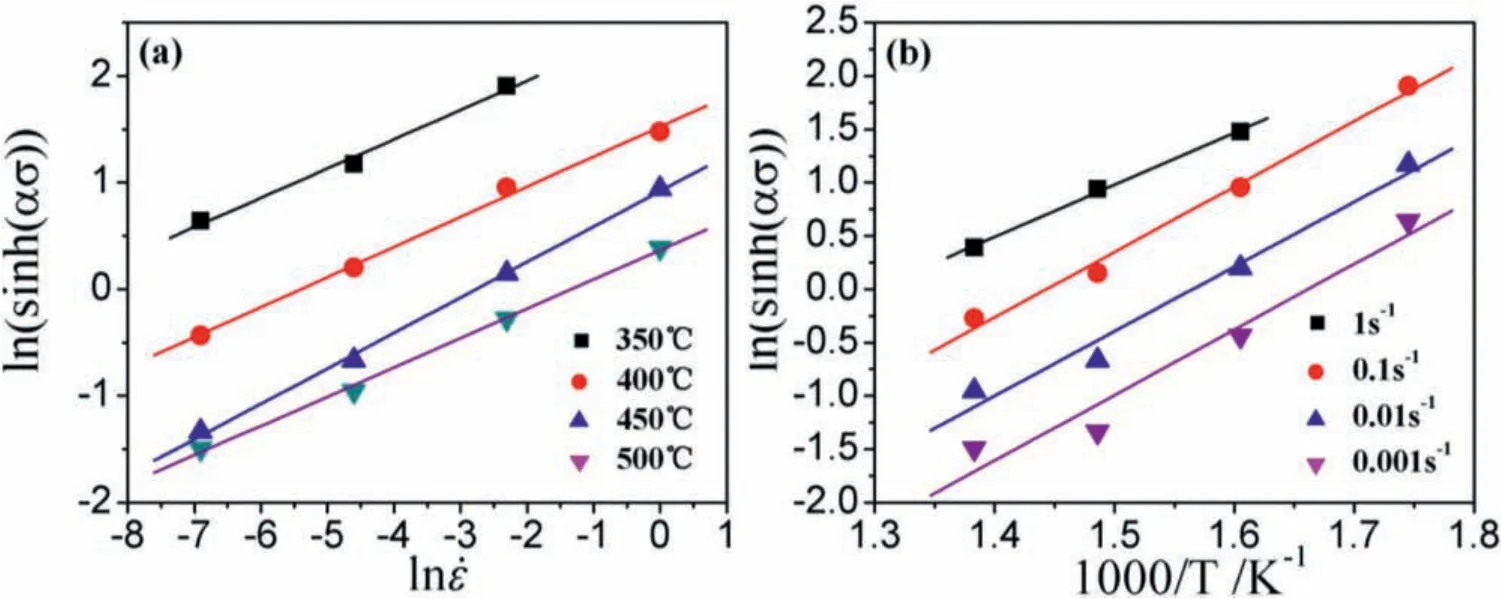
Fig.6.Relationship between ln˙εand(a)ln[sinh(ασ)]and(b)1/T.
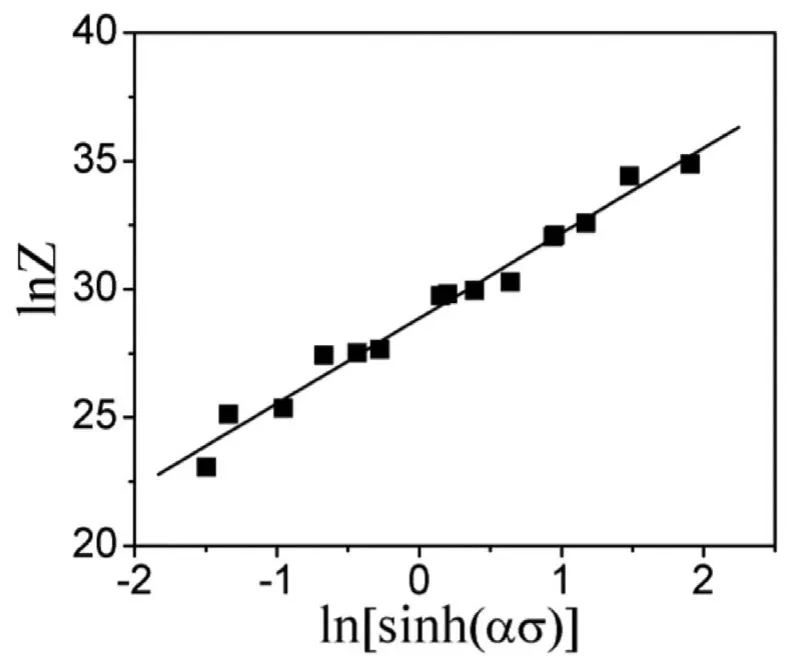
Fig.7.Relationship between lnZ and ln[sinh(ασ)].

Table 2Coefficient of the polynomial forα,n,Q and ln A.
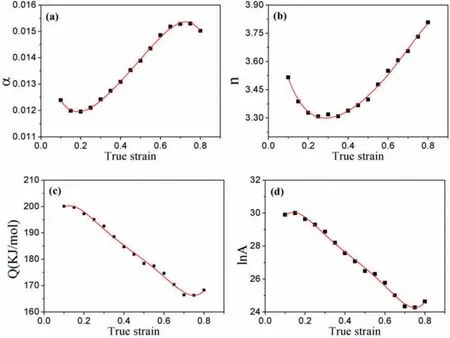
Fig.8.Variations of(a)α,(b)n,(c)Q and(d)ln A with strain.
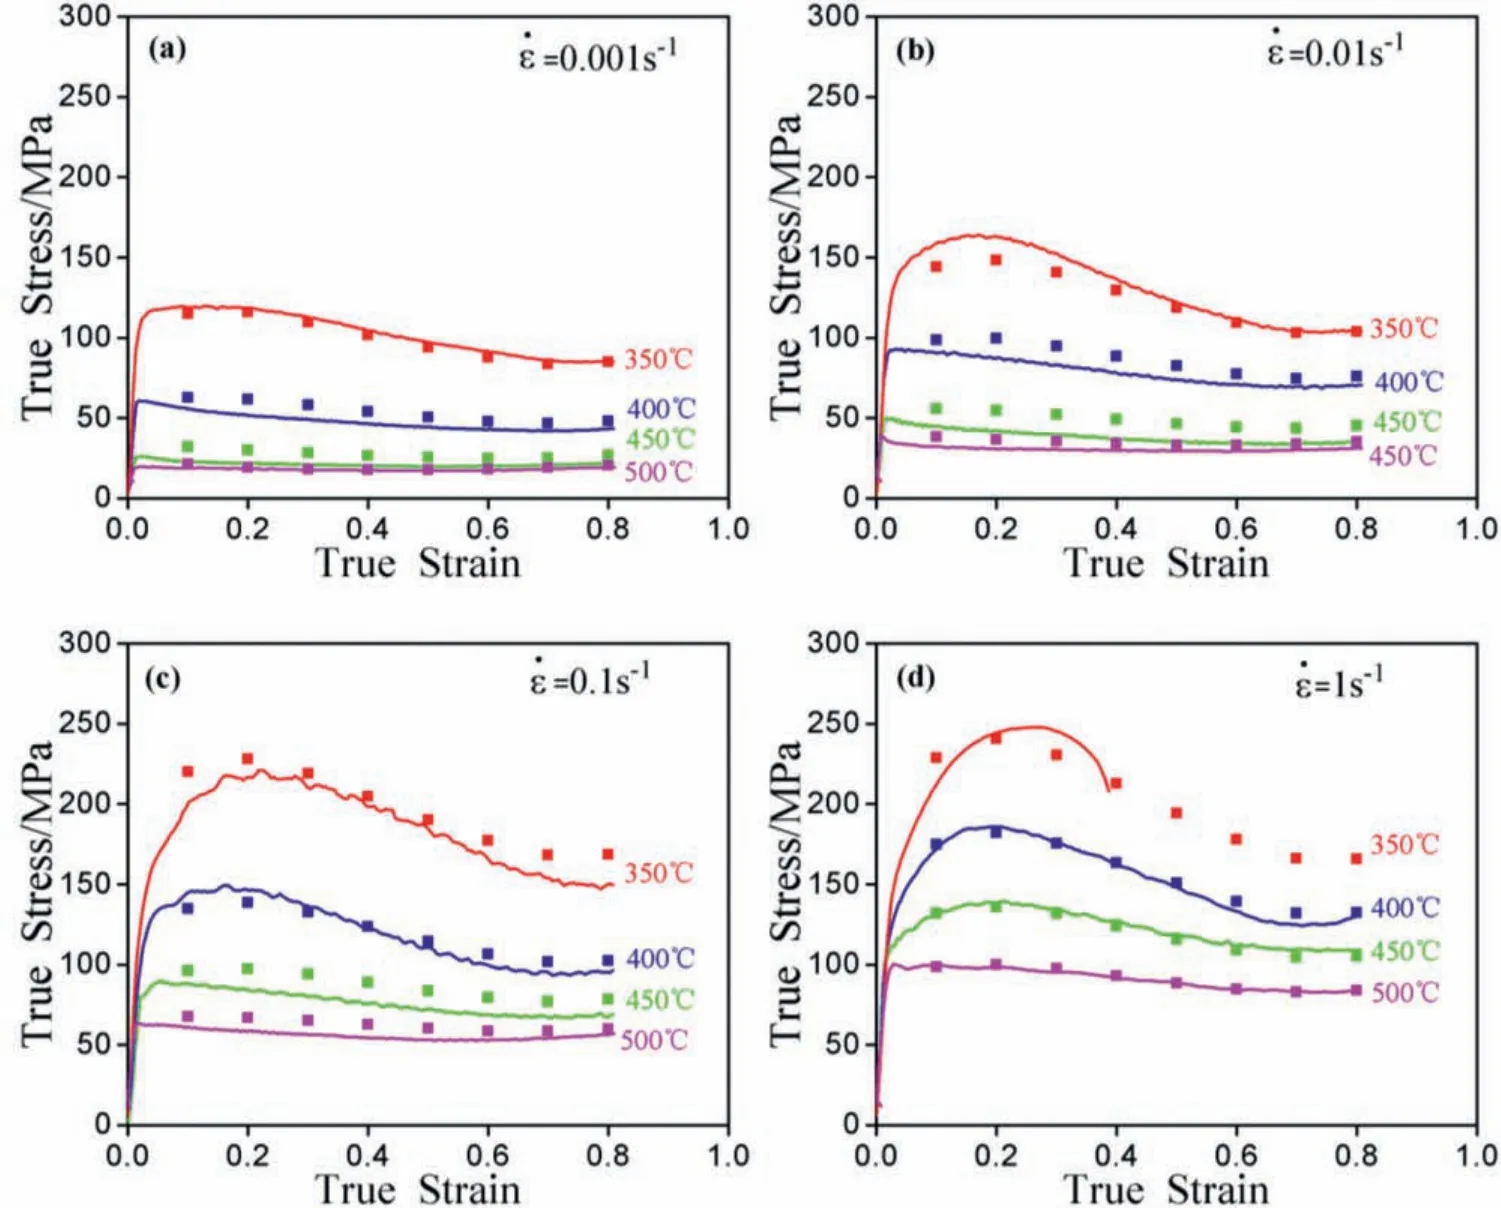
Fig.9.The comparisons between predicted and measured fl w stress at strain rates of(a)˙ε=0.001s−1,(b)˙ε=0.01s−1,(c)˙ε=0.1s−1,(d)˙ε=1s−1.
The stress can be written as:

The stress can be predicted at a given strain based on Eq.(12).The predicted stress with strain is shown in Fig.9,and the measured stress is also illustrated.In order to further evaluation the proposed constitutive equation,the correlation coefficien(R)is employed,as shown in Eq.(13),and average absolute relative error(AARE)is also introduced,as shown in Eq.(14)[19].
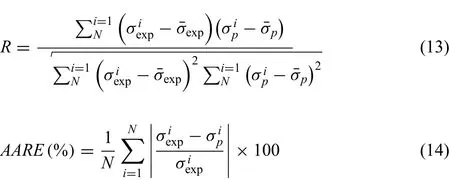
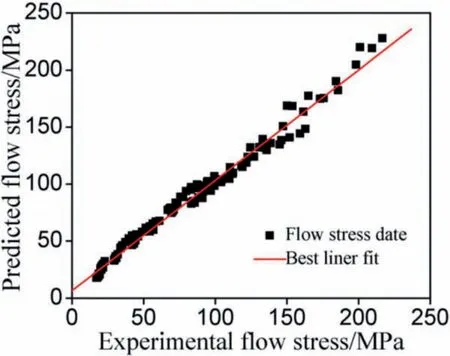
Fig.10.Correlation between the experimental and predicted fl w stress data from the proposed Arrhenius-type equation.
3.4.Processing map
3.4.1.The principles of processing map
The processing map[20]usually applied to characterize the workability of the metallic material,especially the metallic material has poor plasticity[21].The total dissipated power(P)can be partitioned into two parts base on the dynamic material model,as shown below.

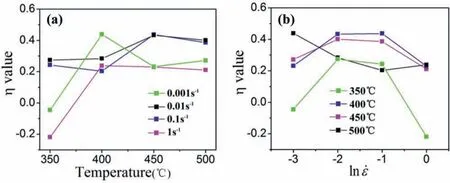
Fig.11.The variation ofηvalue with(a)temperature and(b)strain rate at strain of 0.7.
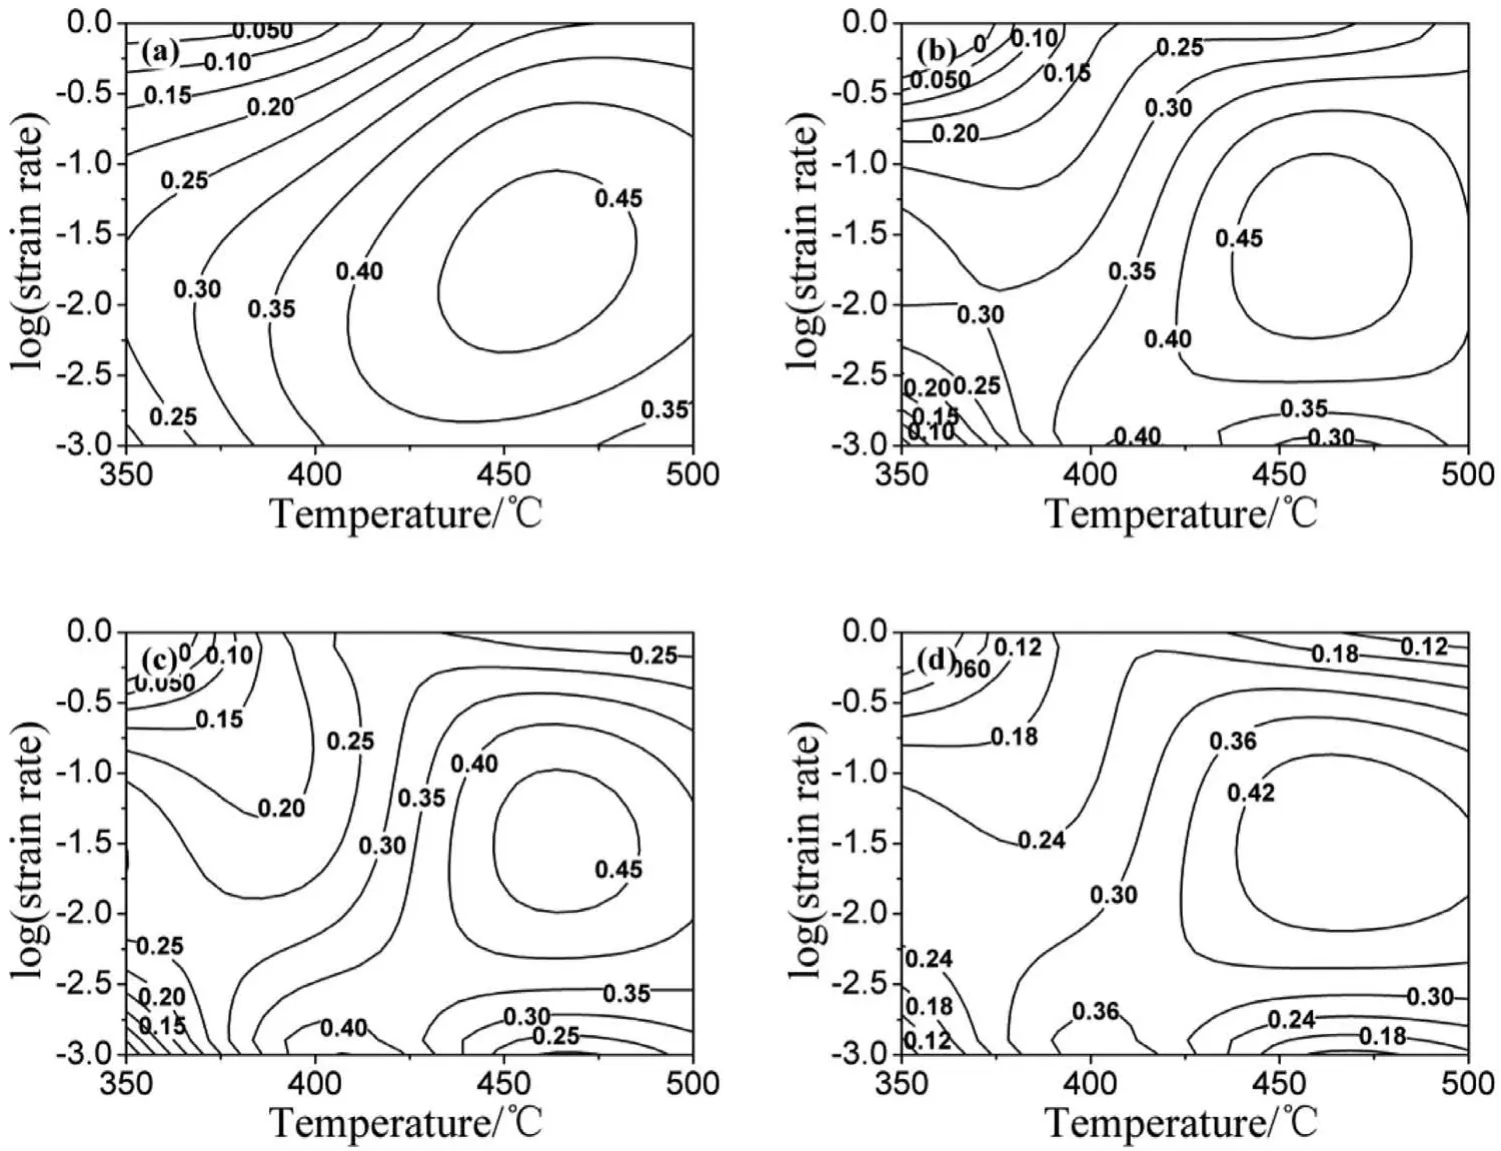
Fig.12.Power dissipation maps at strains of(a)ε=0.3;(b)ε=0.5;(c)ε=0.7 and(d)ε=0.9.
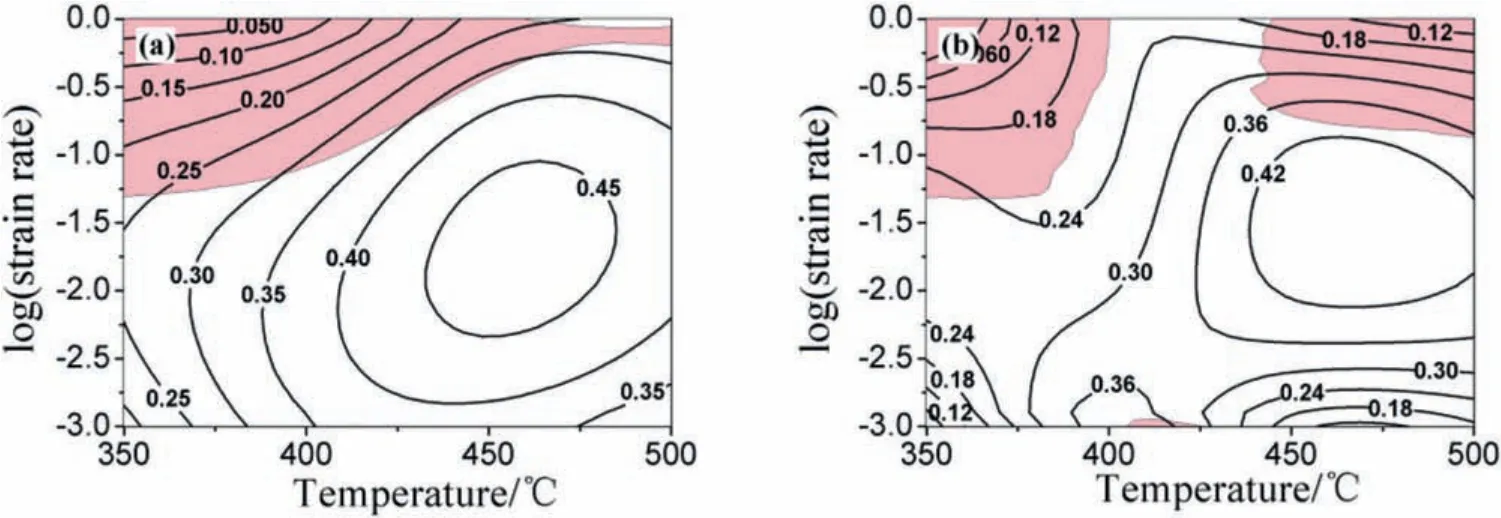
Fig.13.Processing maps at strains of(a)ε=0.3 and(b)ε=0.9.
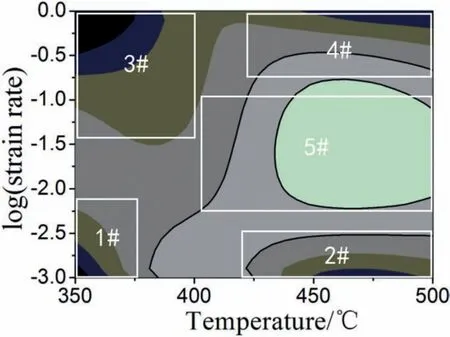
Fig.14.Processing map of the alloy including typical domains.
For a certain condition,the stress is expressed as:

Themin Eq.(16)can be expressed as:

For a certain condition,theJpart can be written as,
At any determined deformation condition,theJpart can be written as,

For an ideal linear dissipation process,m=1 andJmax=σ˙ε/2.The power dissipation efficien y is introduced,which expressed as:


Fig.15.Microstructure of the alloy at different domains:(a)domain 1#(350°C/0.001 s−1);(b)domain 2#(500°C/0.001 s−1);(c)domain 3#(350°C/1 s−1);(d)domain 4#(500°C/1 s−1);(e)domain 5#(450°C/0.01 s−1).
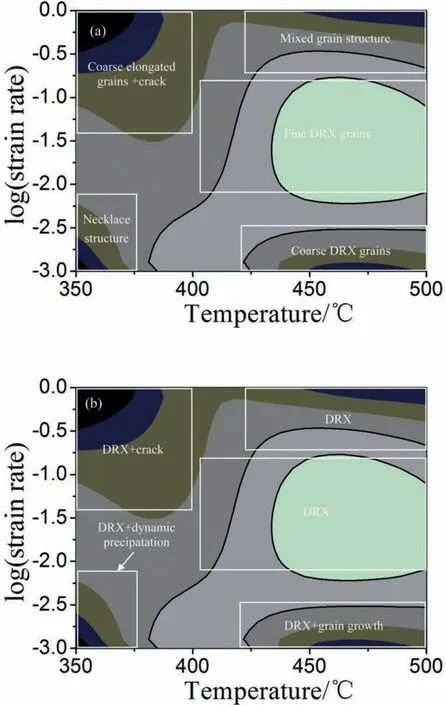
Fig.16.(a)Microstructure characterizations and(b)deformation mechanisms in different domains in processing map.
The power dissipation map is plotted by the variation of theηwith the change of temperature and strain rate,and microstructure evolutions,e.g.DRV,DRX and super plasticity can be concluded from the power dissipation map.
A continuum criterion considering the appearance of fl w instabilities is define according to another dimensionless parameter(ξ)[22],

The instability map can be obtained by the variation of theηwith the change of temperature and strain rate.The area whereξ<0 is the instability domain,and the area whereξ>0 is the safe domain.
3.4.2.Values ofηunder different parameters
Fig.11 shows the variation ofηvalue at strain of 0.7 with different deformation parameters.From Fig.11(a),the deformation parameters exert remarkably influenc on the values ofη.When the samples deformed at 0.01 s−1and 0.1 s−1,the values ofηrange from 0.2 to 0.4 with the temperature increase from 350°C to 500°C.When the samples deformed at 0.001s−1/1s−1,theηrapidly rises with the temperature increase from 350°C to 400°C,after that,further increase the temperature,theηdisplay a stable state.In Fig.11(b),theηhave a similar changing trends at 400°C/450°C,which increase frst and then decrease with the strain rate increase,the maximumηvalues can be obtained when the samples deformed at 0.01 s−1.however,the changing trends ofηwith strain rare are quite different at 350°C/500°C.When the sample deformed at 350°C,the value ofηis about−0.05 at 0.001 s−1,which increase to 0.3 at 0.01 s−1,after that,the values ofηdecrease with strain rate increase.When the sample deformed at 500°C,the value ofηdecrease gradually with strain rate increase.General speaking,the negativeηvalue region usually corresponds to the deformation instability,which should be avoid.
Fig.12 illustrates the power dissipation maps under different strain.The number at each contour represents the value ofη.Viewed as a whole,the power dissipation maps have similar shapes,indicating the strain exerts little influenc on the dissipation maps.At strain of 0.3,only one high power dissipation efficien y domain exists,which occurs in the areas of 400-500 °C/0.001-0.1 s-1,the maximum efficien y is 45%when deformed at 450 °C/0.01 s-1.With the strain increase,the area of the high power dissipation efficien y domain gradually decreases,which indicating the workability of the alloy becomes narrower.
3.4.3.Processing map analysis
Fig.13 shows the processing map at strains of 0.3 and 0.9.The magenta region indicates that the f ow instability whereξ<0.As discussion above,only one high power dissipation efficien y domain exists,which occurs in the areas of 400-500 °C/0.0011-0.1 s-1.Theηshows a high values from 350 °C to 500 °C when the samples deformed in the intermediate strain rate region,however,the values ofηdecrease when the strain rate increase or decrease,which indicating the workability is heavily affected by the strain rate.When the samples deformed at strain of 0.3,there are only one instability region,which occurs in high strain rate region,when the deformation temperature increase,the instability area decrease.When the samples deformed at strain of 0.9,two instability regions can be observed,the frst one occurs in the area of high strain rate and low temperature region,the second one occurs in the area of high strain rate and high temperature region.Generally,the efficien y value associated for magnesium alloys with DRX is about 30-50%,which usually corresponds to feasible processing window.However,the deformation mechanism in different domains should be verifie by the microstructure observation[23].
3.4.4.Microstructure analysis of characterization domains
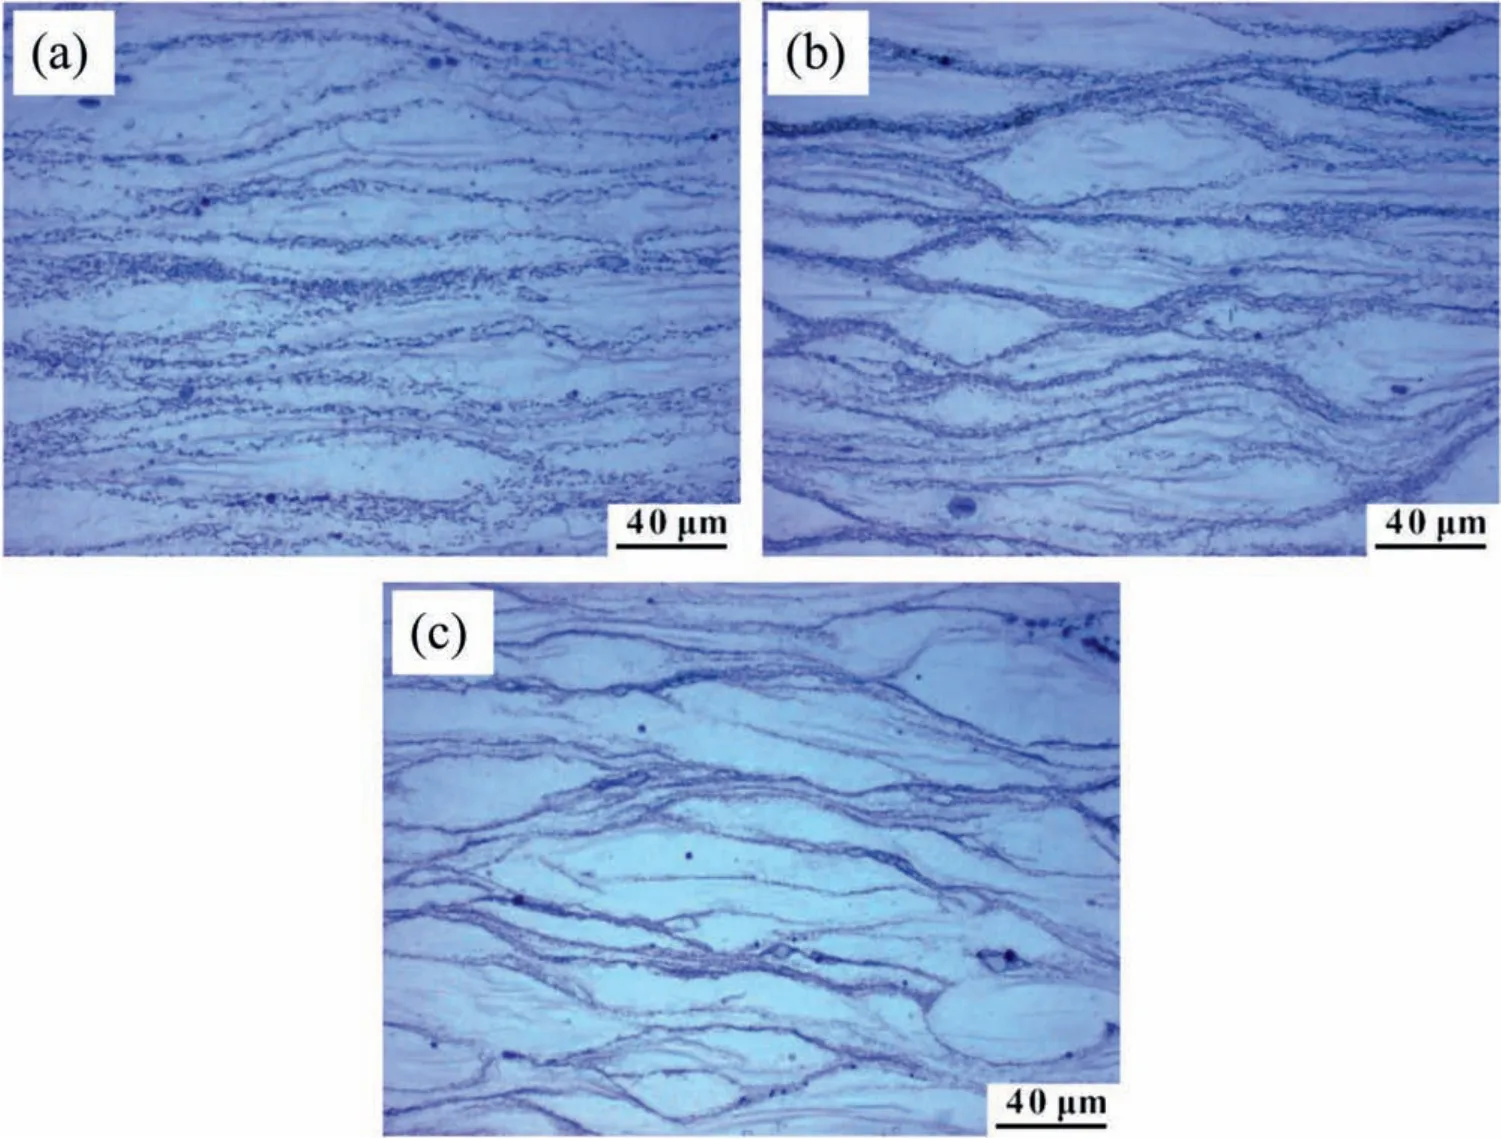
Fig.17.Microstructure of the alloy deformed at 400°C and different strain rate:(a)0.001 s−1;(b)0.01 s−1;(c)0.1 s−1.
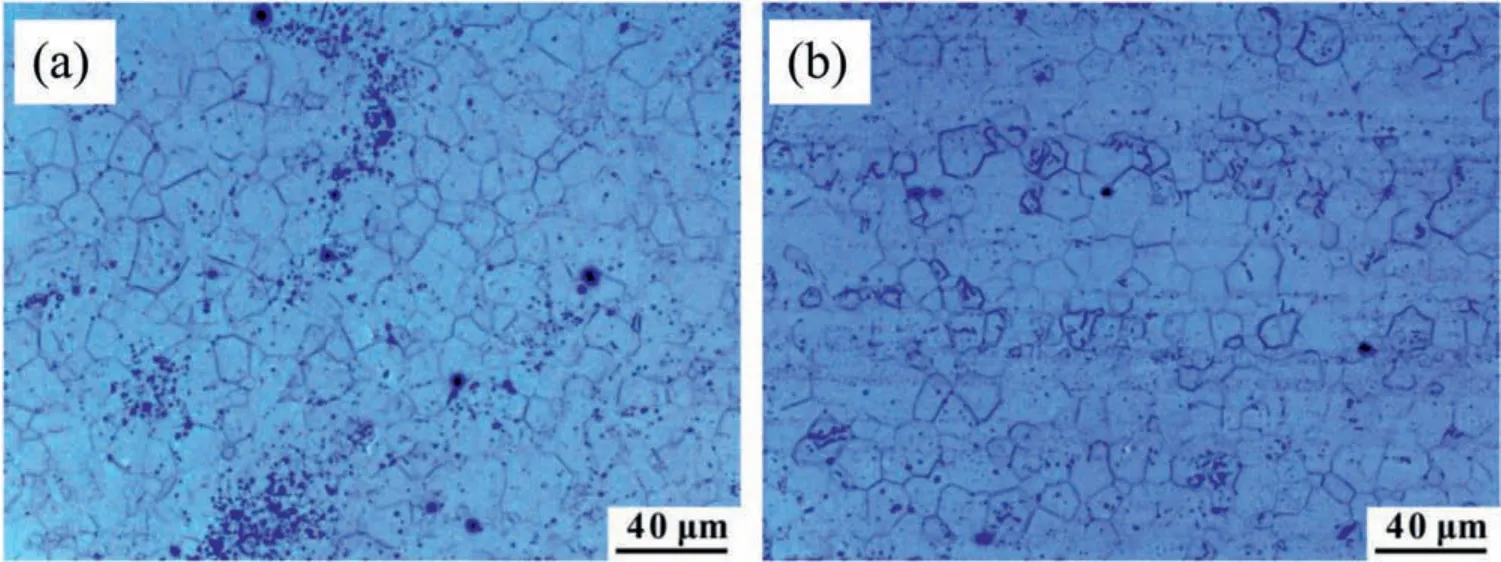
Fig.18.Microstructure of as-extruded Mg-8.1Gd-4.5Y-0.3Zr alloy:(a)cross section;(b)longitudinal section.
The processing maps were divided into fi e typical domains according to the value ofηand instability parameter to determine the deformation mechanism,as shown in Fig.14.Fig.15 shows the typical microstructure at different domains in Fig.14.In domain 1#,the typical microstructure of this domain is obtained when the sample deformed at 350°C/0.001 s−1,as shown in Fig.15(a).The recrystallized grains are observed at the initial coarse grain boundary,this microstructure often called“necklace structure”and is common in Mg-Gd-Y alloys[24,25].It also can be seen from Fig.15(a)that lots of precipitation particles could be observed in the dynamic recrystallization domain,indicating the dynamic precipitation occurs during the hot compression deformation.This phenomenon was also reported by other researchers.Xia et al.[26]investigated the microstructure of hot compressed Mg-RE alloy,the results indicated that the particles precipitated in the DRX region and have positive significanc for the grain refinemen and softening of the texture intensity.Peng et al.[27]found that many Mg24(Gd,Y)5particles precipitated after 14-passes CEC processing,which result in the great increase of yield strength.Therefore,the main deformation mechanism in this domain is dynamic recrystallization and dynamic precipitation.In domain 2#,the typical microstructure is shown in Fig.15(b)and correspond to the sample deformed at 500°C/0.001 s−1.Complete recrystallized microstructure is observed,and recrystallized grain size is much larger than that of the sample deformed at 350°C/0.001 s−1,indicating the grain growth occur at this state.The second phases distribute perpendicular to the compression direction,and the volume of the second phases obviously decreases after hot compression deformation,this phenomenon indicating the second phases is partly dissolved.Chen[28]also report a similar result.Therefore,the main deformation mechanism in this domain is dynamic recrystallization and grain growth.In domain 3#,From 15(c),the grain is elongated perpendicular to the compression direction and crack is seen.Therefore,the main deformation mechanism in this domain is dynamic recovery and nucleation of crack.In domain 4#,the sample deformed at 500°C/1 s−1has a mixed grain structure.In this state,the main deformation mechanism in this domain is dynamic recrystallization.In domain 5#,the sample deformed 450°C/0.01 s−1has a complete recrystallized microstructure,as shown in 15(d),the main deformation mechanism in this domain is dynamic recrystallization.According to the discussion above,the microstructure characterizations and deformation mechanisms in different domains are summarize in Fig.16.

Fig.19.EBSD orientation map of as-extruded Mg-8.1Gd-4.5Y-0.3Zr alloy.
As the discussion of processing map and microstructure,the feasible processing window of the alloy is in the areas of 400-500 °C/0.001-0.1 s−1.
3.5.The verificatio of processing parameters
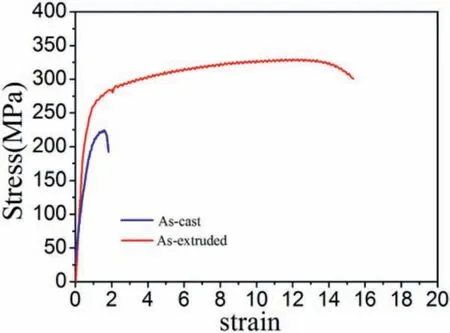
Fig.20.The stress-strain curves of the cast and extruded Mg-8.1Gd-4.5Y-0.3Zr alloy.

Table 3The tensile properties of the Mg-8.1Gd-4.5Y-0.3Zr alloy at different states.
In the feasible processing window,the grain size is controlled byZdmrec=A[29].The fin dynamic recrystallization grains can be achieved by reducing temperature or increasing strain rate,as shown in Eq.(8).As for Mg-8.1Gd-4.5Y-0.3Zr alloy,the lowest deformation temperature is 400°C in the safe domain,to verify the influenc of strain rate,the microstructure analysis was conducted when the samples deformed at 400°C.From Fig.17,the proportion of DRXed grains decreases with strain rate increase,meanwhile,the DRXed grain size decreases.If only consider the grain size,fine grain size can be obtained by increasing the strain rate.Therefore,the optimum parameter selected for hot extrusion is at 400°C/0.1 s−1.
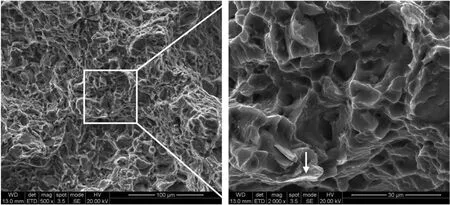
Fig.21.Tensile fracture morphology of as-extruded Mg-8.1Gd-4.5Y-0.3Zr alloy.
The microstructure of the as-extruded alloy is shown in Figs.18 and 19.Compared with the initial microstructure,the grain size is refine remarkably to about 7.9μm,indicating that the complete dynamic recrystallization occurs.Fig.20 illustrates the stress-strain curves after extrusion,and tensile properties are shown in Table 3.The UTS,YS and elongation of the Mg-8.1Gd-4.5Y-0.3Zr alloy after extrusion reach to 331MPa,245MPa and 15.3%,respectively,this high tensile property could be ascribed to the grain refinemen and casting defects elimination.Fig.21 shows SEM tensile fracture morphology of as-extruded alloy.The failure surface mainly consists of dimples with a small amount of cleavage planes,which exhibit typical toughness fracture character.
4.Conclusions
High temperature deformation behavior and workability of Mg-8.1Gd-4.5Y-0.3Zr alloy was studied by compression tests.Arrhenius equation with strain compensation was used to describe the fl w behavior.Meanwhile,the processing maps based on DMM model were established.The following conclusions were drawn:
(1)The stress is strongly influence by deformation parameters.The samples cracked when deformed at 300 °C/0.1 s−1and 1 s−1and 350°C/1 s−1.
(2)The constitutive equation of Mg-8.1Gd-4.5Y-0.3Zr alloy for hot deformation is˙ε=3.448×10¹²[sinh(0.012σ)]3.319
(3)TheQ,α,nand lnAvaries with the strain,its relationship fi well by fift order polynomial.The predicted stress values consist well with the experimental ones.
(4)There are fi e typical domains in processing map,and deformation mechanisms in different domains were determined by microstructure analysis.The feasible processing window of the alloy is in the areas of 400-500°C/0.001-0.1 s−1,the main deformation mechanism is dynamic recrystallization.(5)The hot extrusion successfully carried out based on the deformation parameters obtained from the processing map,and the UTS,YS and elongation of the alloy after extrusion reach to 331MPa,245MPa and 15.3%,respectively.
Declaration of Competing Interest
The authors declare no conflic of interest.
Acknowledgments
This work was sponsored by the National Natural Science Foundation of China(Grant no.51501015).
杂志排行
Journal of Magnesium and Alloys的其它文章
- Microstructural evolution of Mg-Al-Re alloy reinforced with alumina fiber
- Predicting and controlling interfacial microstructure of magnesium/aluminum bimetallic structures for improved interfacial bonding
- Plasma electrolytic oxidation of AZ31 and AZ91 magnesium alloys:Comparison of coatings formation mechanism
- Effects of annealing treatment on microstructure and tensile behavior of the Mg-Zn-Y-Nd alloy
- Microstructure and performance of biodegradable magnesium alloy tubes fabricated by local-heating-assisted dieless drawing
- Comparisons of microstructure homogeneity,texture and mechanical properties of AZ80 magnesium alloy fabricated by annular channel angular extrusion and backward extrusion
