Effect of Y addition on microstructure and corrosion behavior of extruded Mg-Zn-Nd-Zr alloy
2020-12-18HuseyinZenginYunusTuren
Huseyin Zengin,Yunus Turen
Department of Metallurgical and Materials Engineering,Karabuk University,78050 Karabuk,Turkey
Received 3 January 2020;received in revised form 28 May 2020;accepted 11 June 2020
Available online 25 June 2020
Abstract In this study,the effect of Y addition(0,0.5,1 and 2 wt%)on microstructure and corrosion properties of Mg-6Zn-0.5Zr-1Nd(wt%)alloy was investigated.The alloys were produced by low-pressure die casting method and extruded at 300 °C and 400 °C after homogenization treatment at 400 °C for 24h.The results showed that the as-cast microstructure of the alloy with no Y addition consisted ofα-Mg,Mg-Zn binary and Mg-Zn-Nd ternary phases.With increasing Y additions,the average grain size showed a substantial decrease and two kinds of ternary Mg-Zn-Y ternary phases,designated as I-phase(Mg3Zn6Y)and W-phase(Mg3Zn3Y2)were formed.Homogenization treatment resulted in a partial dissolution of second phase particles.Extrusion process gave rise to a remarkable grain refinemen due to the DRX mechanism.The extruded alloys with no Y addition exhibited poor corrosion resistance due to the strong micro galvanic coupling effect.Y additions up to 1 wt% improved the corrosion resistance due to the formation of f ner grains,fin and uniform distribution of second phase particles and more stable oxide film© 2020 Published by Elsevier B.V.on behalf of Chongqing University.This is an open access article under the CC BY-NC-ND license.(http://creativecommons.org/licenses/by-nc-nd/4.0/)Peer review under responsibility of Chongqing University
Keywords:ZK60 magnesium alloys;Rare earth;Yttrium;Extrusion;Microstructure;Corrosion.
1.Introduction
Mg-Zn-Zr alloys,also denoted as ZK series,are considered as one of the most promising magnesium alloys due to their excellent combination of strength and ductility[1].Among the ZK series alloys,ZK60 alloy(6 wt% Zn and 0.3-0.9 wt% Zr)has been in the forefront for a long time.In this alloy,6 wt% Zn addition provides a significan improvement on the strength primarily by the combination of grain refine ment solid solution strengthening mechanisms[2,3].In addition,the strength of this alloy can also be further improved by precipitation hardening.Zr has a reputation for its excellent grain refinin effect in magnesium alloys[4].Thus,with the combination of these beneficia elements,ZK60 alloys exhibit superior mechanical properties.Furthermore,ZK60 alloys can easily be formed at elevated temperatures displaying a low tendency to crack[5].That is to say,the dynamic recrystallization(DRX)occurs during the hot forming processes and the mechanical properties can be significantl improved.
On the other hand,several properties of ZK60 alloys,such as strength at elevated temperatures,wear resistance and corrosion resistance,are still inferior to their counterparts.Therefore,many attempts have been made in order to improve these properties so far.The additions of different rare earth elements(RE)have been extensively conducted on ZK series magnesium alloys to take the advantages of thermally stable fin Mg-Zn-RE particles[6-11].For instance,Yu et al.[8]showed that Ce addition provided a significan increase in the yield and tensile strengths of ZK60 alloy although it reduced the ductility.Zhou et al.[9]investigated the effects of Nd and Y additions on the microstructure and mechanical properties of ZK60 alloy and reported that Nd and Y additions gave rise to the formations of new Mg41Nd5and Mg3Zn6Y(I-phase)phases.It was also reported that Nd and Y additions resulted in an effective grain refine ment on both as-cast and extruded conditions and accordingly,an improvement on strength of ZK60 alloy.Huang et al.[12]investigated the effects of Gd on the tensile properties of extruded ZK60 alloy and reported that Gd addition effectively improved the mechanical properties of extruded ZK60 alloy at both room and elevated temperatures.Liu et al.[13]developed a novel high strength ZK50 alloy by the additions of 1 wt% Ce and 0.5 wt% Y and they reported that the alloy achieved a yield strength of 407MPa and an ultimate tensile strength of 421MPa in the extrusion+T5 condition.In a different study,Liu et al.[14]investigated the synergistic effect of Y and Ce additions on the mechanical properties of Mg-Zn-Zr alloy and showed that an optimal mechanical properties was found for the alloy containing 0.28 wt% Y and 0.52 wt% Ce additions.Xu et al.[15]showed that Nd additions as low as 0.14 wt% can improve the strength of ZK60 alloy.Yang et al.[16]reported an optimal mechanical properties after 1 wt% Nd addition to Mg-4.5Zn(wt%)alloy.Elkaiam et al.[17]showed that 2wt% Nd addition into Mg-5Zn-0.13Y-0.35Zr(wt%)alloy exhibited the most optimal results in terms of mechanical and corrosion properties.In a recent study[18],it was reported that 1.5 wt% Nd addition to ZK60 alloy provided a remarkable improvement on the strength.In our previous studies[19,20],we showed that La addition significantl improved the as-cast and as-extruded mechanical properties of the ZK60 alloy.
The corrosion properties of ZK60-RE alloys have been the subject of numerous studies[20-25].In our previous study[20],we showed that La addition marginally reduced the corrosion resistance due to the creation of microgalvanic sites caused by Mg-Zn-La ternary particles.On the other hand,Zhang et al.[21]reported that Sm addition to ZK60 alloy improved the corrosion resistance.In another study,Buzolin et al.[22]also showed that 2 wt% Gd addition slightly improved the corrosion resistance of ZK40 alloy whereas the ZK60-2Nd alloy exhibited very poor corrosion resistance.Jia et al.[23]showed that Y addition up to 2 wt% gradually improved the corrosion resistance of ZK30 alloy while further Y additions deteriorated the corrosion performance due to the significan micro galvanic effect of W-phase(Mg3Y2Zn3).Xu et al.[24]measured the potential of Gd-containing Wphase(Mg3(Y,Gd)2Zn3)andα-Mg matrix and showed that W-phase(Mg3(Y,Gd)2Zn3)had much nobler potential thanα-Mg matrix,meaning that a high amount of W-phase can create increase the galvanic corrosion and reduce the corrosion resistance.In another study by Chang et al.[25],the influenc of Nd and Y additions on the corrosion behavior of extruded Mg-5Zn-0.3Zr(wt%)alloy was extensively studied and it was showed that the Nd and Y additions improved the corrosion resistance due to the stabilization of corrosion product film In their study,both individual additions of Nd into the Mg-5Zn-0.3Zr(wt%)and further alloying of Y by 0.5%and 1 wt% into the Mg-5Zn-0.3Zr-2Nd(wt%)alloy were made.The main dissimilarity of this study with the present study is that the contents of Zn and Nd in the base alloy,which may cause different corrosion results.

Table 1Chemical compositions of as-cast alloys(wt%).
Although numerous studies investigated the effects of different RE additions on both the mechanical and corrosion resistance of ZK-series alloy,there is still limited detailed corrosion studies focusing on both the synergistic alloying additions and the extrusion process parameters.Therefore,in the current study,an alloying of ZK60 with 1 wt% Nd addition was selected as a base material since 1 wt% Nd addition resulted in a higher strength and low corrosion resistance in Mg-Zn alloys[16,17].Accordingly,this study aimed to improve the corrosion resistance of ZK60-1Nd alloy by the alloying additions of Y.Furthermore,two different extrusion temperatures were performed,and the corrosion performances were analysed on both the parallel and transverse surfaces of the extrudates.
2.Experimental procedure
The alloys with nominal compositions(wt%)of Mg-6Zn-0.5Zr-1Nd(Alloy I),Mg-6Zn-0.5Zr-1Nd-0.5Y(Alloy II),Mg-6Zn-0.5Zr-1Nd-1Y(Alloy III)and Mg-6Zn-0.5Zr-1Nd-2Y(Alloy IV)were produced by low-pressure die casting method(LPDC).In this method,firstl pure Mg ingots were placed into the stainless steel crucible and melted at 750°C under protective Ar gas atmosphere.Then,pure Zn chips,Mg-30Zr,Mg-25Nd,and Mg-30Y master alloys were added to the molten metal.After holding the melt at this temperature for 30min and applying a mechanical stirring for 15min,a pressure of 2bar was applied into the airtight crucible and moulds(Ø34×190mm)preheated at 250 °C were f lled.The chemical compositions of the produced alloys detected by Xray fluorescenc(XRF)are given in Table 1.The as-cast billets were homogenized at 400 °C 24h and water-quenched.After that,the billets were preheated at the required extrusion temperature and directly extruded at initial billet temperatures of 300 °C and 400 °C with an extrusion ratio of 16:1 and an extrusion speed of 0.3mm/s.
Microstructure characterizations of the as-cast,homogenized and extruded alloys were made by Nikon optical microscope and Carl Zeiss Ultra Plus scanning electron microscope(SEM)equipped with an energy dispersive X-ray spectroscopy(EDX).The constituent phases were determined by Rigaku Ultima IV,X-ray diffraction method using a scanning angle from 10° to 90° and a scanning speed of 3°/min.
The corrosion resistance of the extruded alloys was measured by immersion and electrochemical corrosion test methods.In the immersion corrosion test,cylindrical samples(Ø8×20mm)were machined,grinded and polished,followed by ultrasonic cleaning in alcohol.After the initial weighingand the surface area calculations,the samples were immersed in 3.5 wt% NaCl solution at room temperature for 72h.The corrosion products were removed by a chromic acid solution and the samples were ultrasonically cleaned in alcohol according to ASTM-G31-72 standard[26].Then,the fina weights of the samples were measured.The corrosion rate of the samples was calculated in"mm/y"according to the following equation:

whereKis constant(8.76×10⁴),Wis the mass loss in g,Ais the exposed surface area in cm2,Tis the immersion time in h andDis the density of the samples in g/cm3.The corroded surfaces after 2h immersion(without removal of products)and 72h immersion(after removal of products)were also analysed by SEM in order to clarify the corrosion mechanisms.
The electrochemical corrosion tests were also conducted in 3.5 wt% NaCl solution at room temperature by a Gamry model PC4/300mA potentiostat/galvanostat.A standard three electrode cell was used with a saturated calomel reference electrode,a counter electrode(graphite)and a working electrode.Potentiodynamic polarization curves were obtained at a scan rate of 1mV/s in the voltage range of−0.25 to+0.25V.The corrosion potential and corrosion current density values of the extruded alloys were determined by Tafel extrapolation method.The corrosion rate of the samples was calculated in"mm/y"according to following equation[27,28]:

whereλis metric conversion factor(3.27×10⁻³),icorris the corrosion current density inμA/cm2,Eis the equivalent weight andDis the density of the samples in g/cm3.Electrochemical impedance spectroscopy(EIS)tests were carried out by setting the frequency range from 10kHz to 0.1Hz and the voltage amplitude of 10mV.
3.Results and discussion
3.1.Microstructure
Fig.1 presents the XRD patterns of the studied alloys in their as-cast conditions.As it can be seen in Fig.1,the Alloy I without Y additions exhibited peaks belonging toα-Mg,Mg-Zn binary and Mg-Zn-Nd ternary phases.The intensities of the Mg-Zn and Mg-Zn-Nd peaks showed a reduction as the Y content increased.On the other hand,two kinds of ternary Mg-Zn-Y ternary phases,designated as I-phase(Mg3Zn6Y)with quasicrystal structure and W-phase(Mg3Zn3Y2)with cubic structure were detected in the alloys with Y additions.As the Y content increased,the peak intensities of the both Iphase and W-phase gradually increased,in which the Alloy IV displayed the highest fraction of the peaks of the Mg-Zn-Y ternary phases.It was reported in the previous studies that the Mg-Zn-Y ternary phases;I-phase,W-phase and X-phase formed in order as the ratio of Y to Zn increased[29,30].In the present study,the XRD results in Fig.1 were in line with this findin since the fraction of W-phase increased with increasing Y content although no X-phase was detected.
Of course my father could never be replaced, though that didn t stop me from trying to find ways to preserve his legacy12, his worldview and his work. He was a practicing psychiatrist13, but his passion was writing. He left behind a body of poetry that guides me now that I can t ask him how he handled his sons when we wanted to sleep in our parents bed, or what the best course of action would be in dealing14 with a difficult business partner, or a racist15 coach.
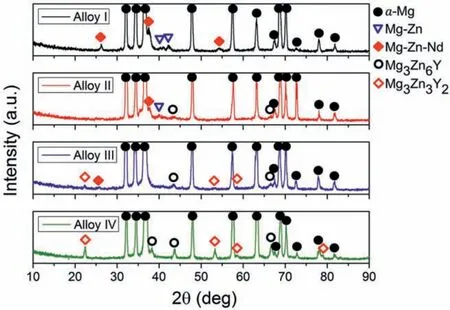
Fig.1.XRD patterns of the as-cast alloys.
The optical micrographs of the as-cast and homogenized alloys are shown in Fig.2.The as-cast microstructures of the alloys exhibitedα-Mg grains with different sizes and considerable amount of second phase particles which were mostly distributed along the grain boundaries and some in the grain interiors.The grain size distribution histograms according to the optical micrographs are also given in Fig.3.It can be seen in both Figs.2 and 3 that the average as-cast grain size gradually decreased as the Y content increased in which a total grain refinemen of approximately 56% was achieved with 2 wt% Y addition to ZK60-1Nd alloy.This efficien grain refinemen effect was primarily attributed to the presence of increased Y atoms at the solid-liquid interface during the solidificatio process which enhanced the nucleation rate and reduced the dendride growth[14].It is also worth noting that the grain size distribution in the as-cast and homogenized Alloy I exhibited wider curve than the alloys containing Y,as shown in Fig.3,displaying more equiaxed grains throughout the microstructure.Furthermore,the homogenization treatment gave rise to a slight increase in the average grain size of the alloys and partial dissolution of second phase particles.
Fig.4 shows the SEM micrographs of the as-cast and homogenized alloys.The EDX analyses of the indicated points in Fig.4 are presented in Table 2.It can be seen in Fig.4 that the second phase particles in the as-cast alloys formed mainly in the shape of strip,which created a somewhat semi-continuous network structure.According to the EDX analyses,a strip-like second phase in the Alloy I were found to be rich in Mg,Zn and Nd,indicating that these phases corresponded to Mg-Zn-Nd ternary phase.Xu et al.[15]showed Mg-Zn-Nd phases in ZK60 alloy after the addition of 0.14 wt% Nd and the EDX results of the Mg-Zn-Nd particles were reported to be very similar to the results in the current study as shown in Table 2.Furthermore,Yang et al.[16]also observed Mg-Zn-Nd phases in Mg-4.5ZnxNd alloys with similar morphology and composition of the Mg-Zn-Nd phases in the Alloy I and they identifie these phases as Mg4Zn2Nd(T-phase).Thus,it can be deduced that the Mg-Zn-Nd ternary phases in the Alloy I corresponded to T-phase with a chemical formula of Mg4Zn2Nd.On the other hand,the second phase particles in the Y-containing alloys contained high amount of Mg,Zn and Y but much lower Nd compared to the Alloy I.As discussed earlier,with increasing Y/Zn ratio,three kinds of Mg-Zn-Y phases form in Mg alloys in order as:I-phase,W-phase and X-phase.When the EDX analyses in Table 2 were compared,the Y content in the Mg-Zn-Y phase increased with increasing Y additions from Alloy II to Alloy IV.This may be due to the random selection of the points in the EDX analyses,but it was thought to be due to the lower Y-containing I-phase being replaced by the higher Y-containing W-phase as a result of the increased Y addition resulting in a higher Y/Zn ratio.As a result,at low Y additions,most of the Mg-Zn-Y phases in the microstructure were composed of I-phase and with increasing Y additions,the W-phase accompanied to the I-phase and they dominated the microstructure.Elkaiam et al.[17]proposed the Nd-containing W-phase in Mg-Zn-Y-Nd alloys to be identifie as Mg3(Nd,Y)2Zn3.
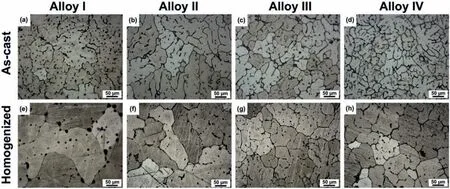
Fig.2.Optical micrographs of the(a)and(e)Alloy I,(b)and(f)Alloy II,(c)and(g)Alloy III and(d)and(h)Alloy IV in the conditions of(a)-(d)as-cast and(e)-(h)homogenization.
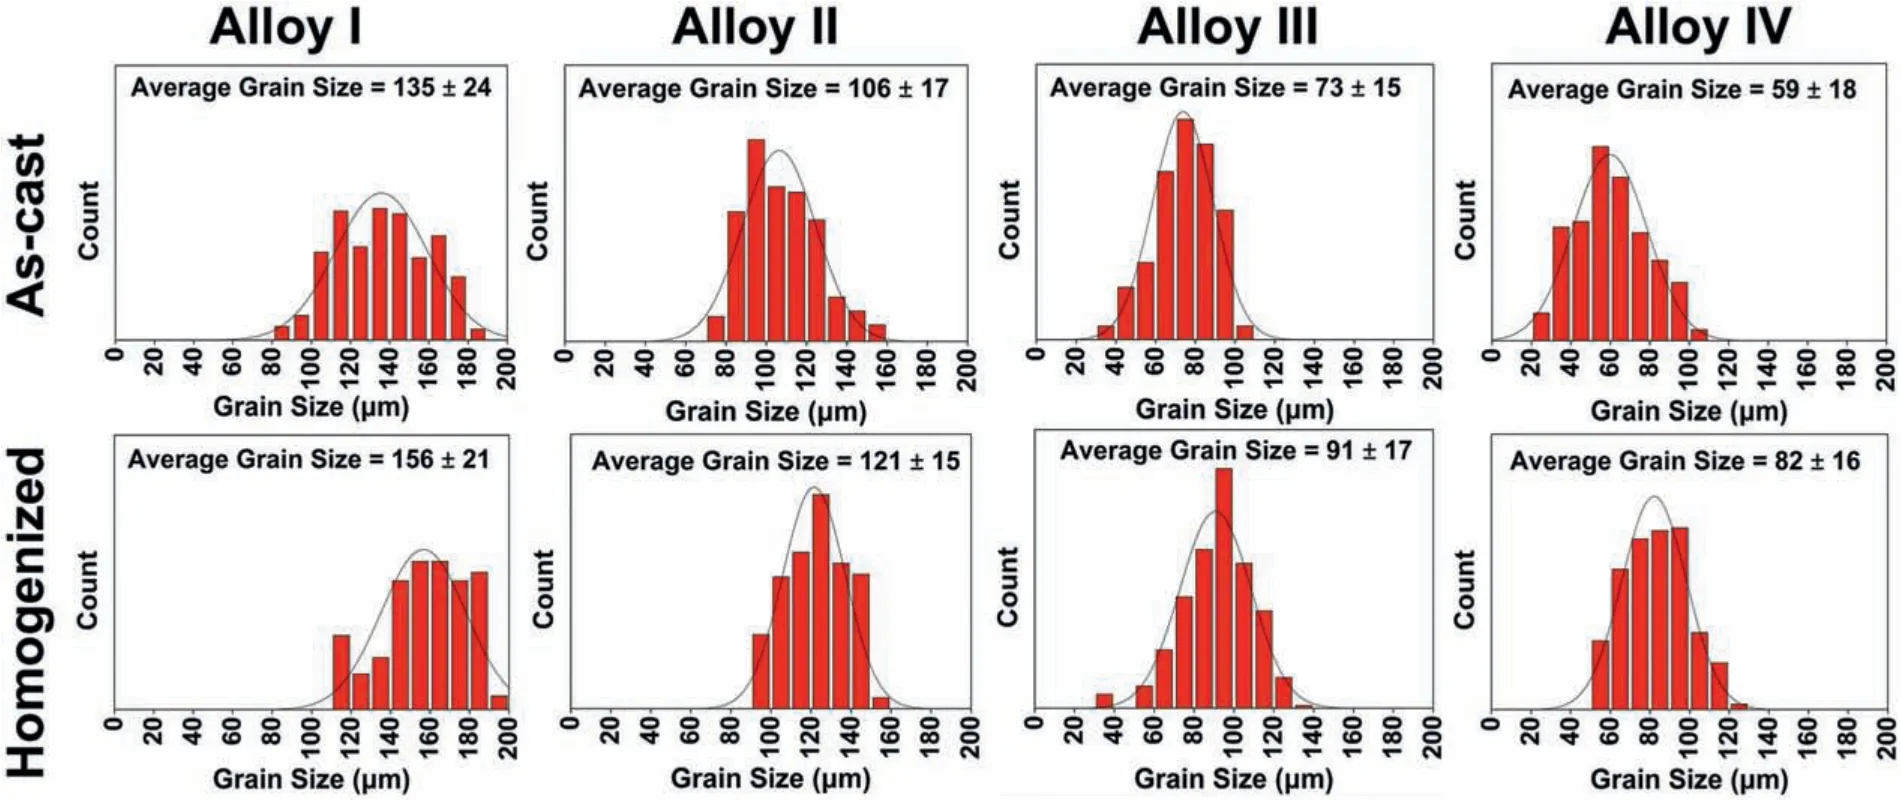
Fig.3.Grain size distribution of the as-cast and homogenized alloys.

Fig.4.SEM micrographs of the(a)and(e)Alloy I,(b,f)Alloy II,(c)and(g)Alloy III and(d)and(h)Alloy IV in the conditions of(a)-(d)as-cast and(e)-(h)homogenization.

Table 2EDX results of the phases indicated in Fig.4.
After the homogenization treatment,the most of the second phase particles in the alloys showed a dissolution in the matrix phase.The calculated volume fractions of the as-cast and homogenized alloys are given in Fig.5.It can be seen that a remarkable decrease in the volume fraction of the second phase particles were achieved,in which the degree of dissolution increased as the Y content increased.Interestingly,the T-phase particles in the Alloy I spheroidized during the homogenization treatment as it can be seen in Fig.4(e).To the best knowledge,no such findin was presented in the literature.The mechanism behind the spheroidization of Tphase will be further investigated in another study.On the other hand,the strip-like Mg-Zn-Y ternary phases partially dissolved and displayed a discontinuous network structure of discrete particles after the homogenization treatment.Tahreen and Chen[31]analysed the Mg65Zn32Y3alloy by differential scanning calorimetry(DSC)and the results showed distinct peaks at 561 °C,540 °C and 419 °C,which corresponded to the X-phase,W-phase and I phase,respectively.Therefore,no complete dissolution of Mg-Zn-Y ternary phases during homogenization at 400 °C for 24h occurred in the current study.
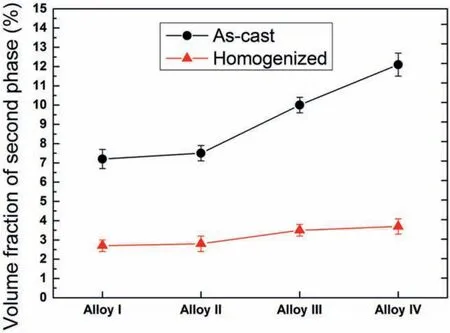
Fig.5.Volume fraction the second phase particles in the as-cast and homogenized alloys.
Fig.6 illustrates the EDX elemental mapping analyses of the as-cast Alloy I and Alloy IV.The most of the second phase particles in the Alloy I were densely rich in Zn and Nd whereas these in the Alloy IV were enriched with Zn,Zr,Nd and Y.It is worth mentioning that Zr atoms showed a uniform distribution in the Alloy I but in the Alloy IV,Zr atoms were mainly intensifie at where the Mg-Zn-Y ternary phases formed.This indicated that Zr atoms located at Mg-Zn-Y nucleation sites with high melting point during the solidificatio process.

Fig.6.EDX elemental mapping analyses of the as-cast Alloy I and Alloy IV.
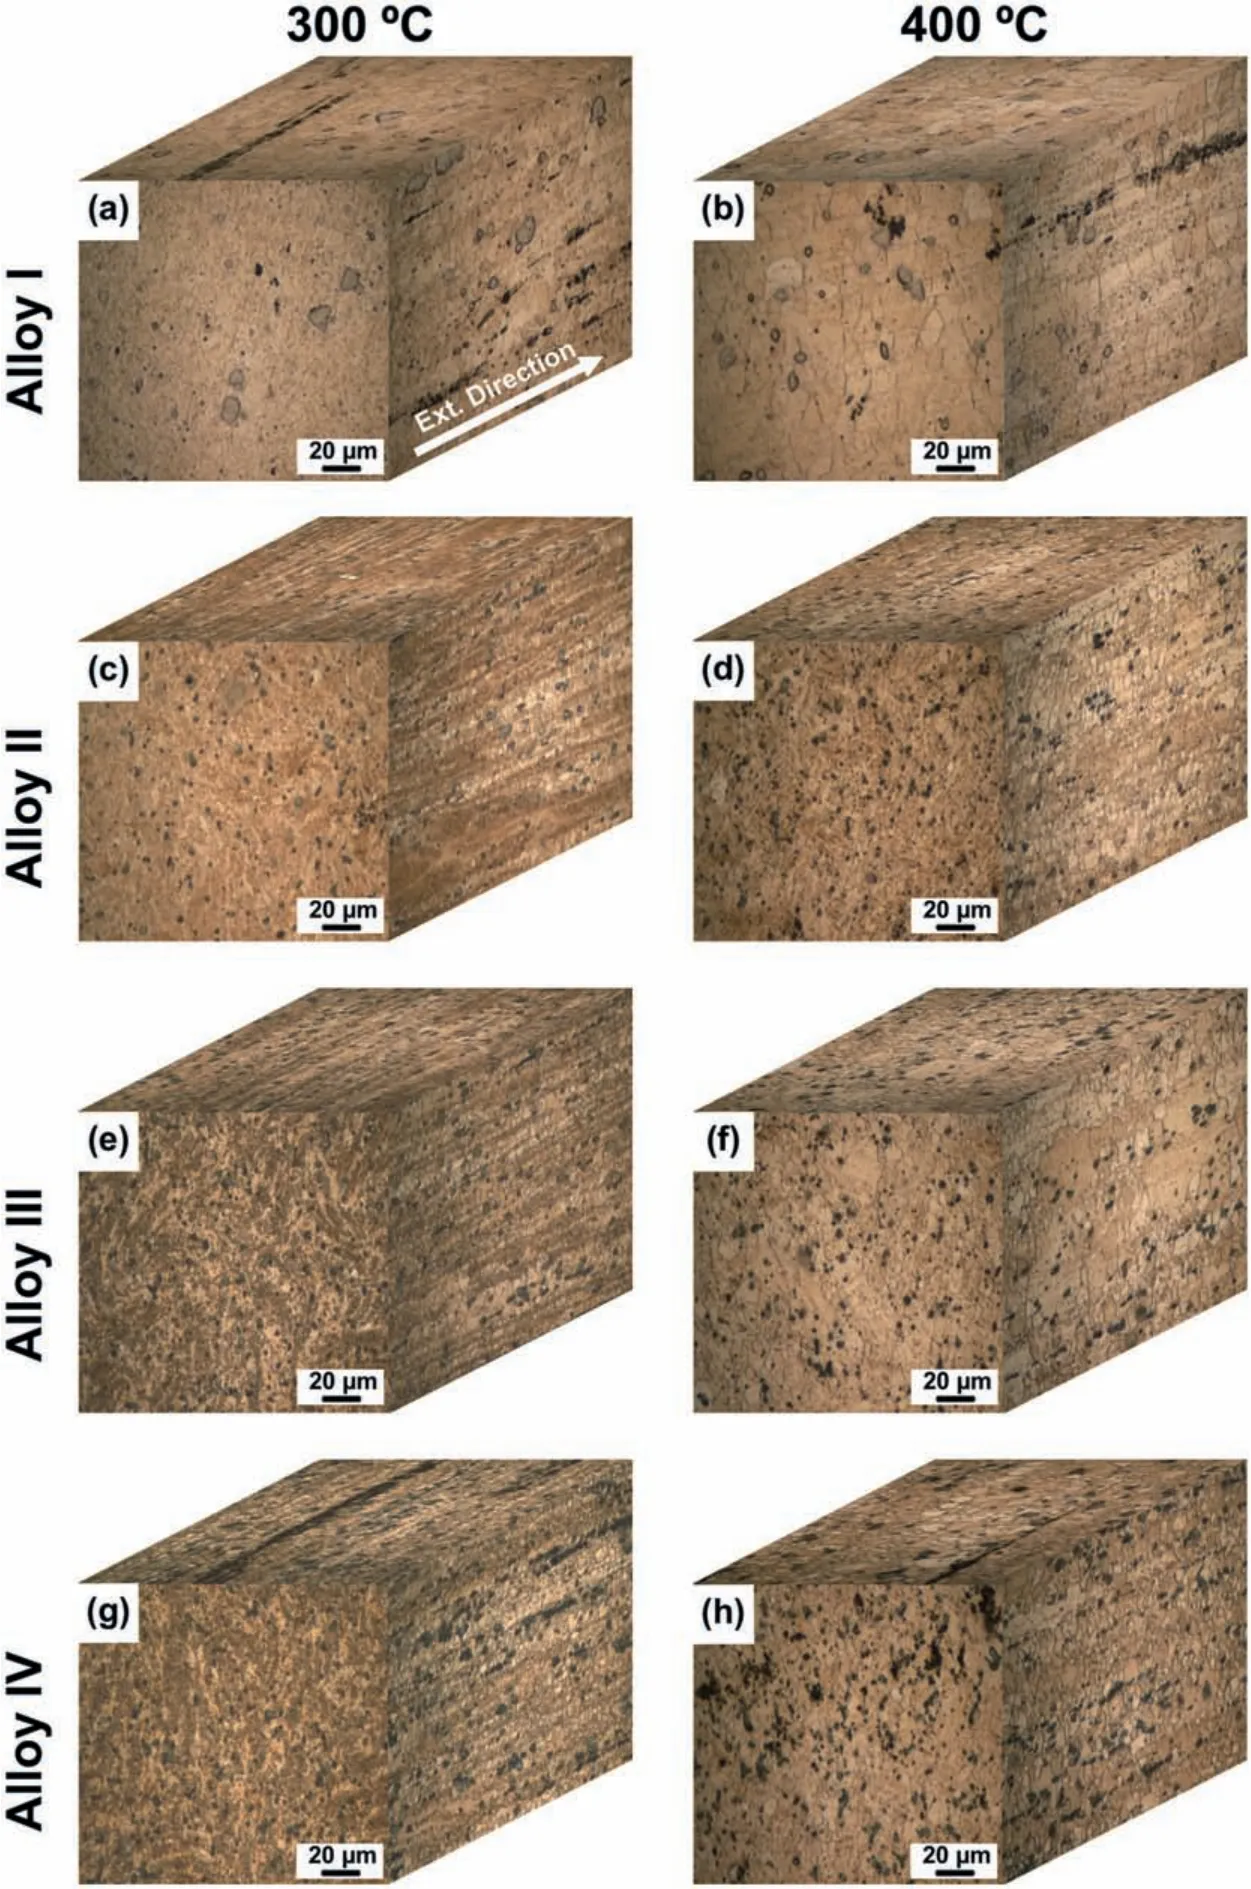
Fig.7.Optical micrographs of the(a)and(b)Alloy I,(c)and(d)Alloy II,(e)and(f)Alloy III and(g)and(h)Alloy IV after extrusion at(a),(c),(g),and(e)300 °C and(b),(d),(f)and(h)400 °C.
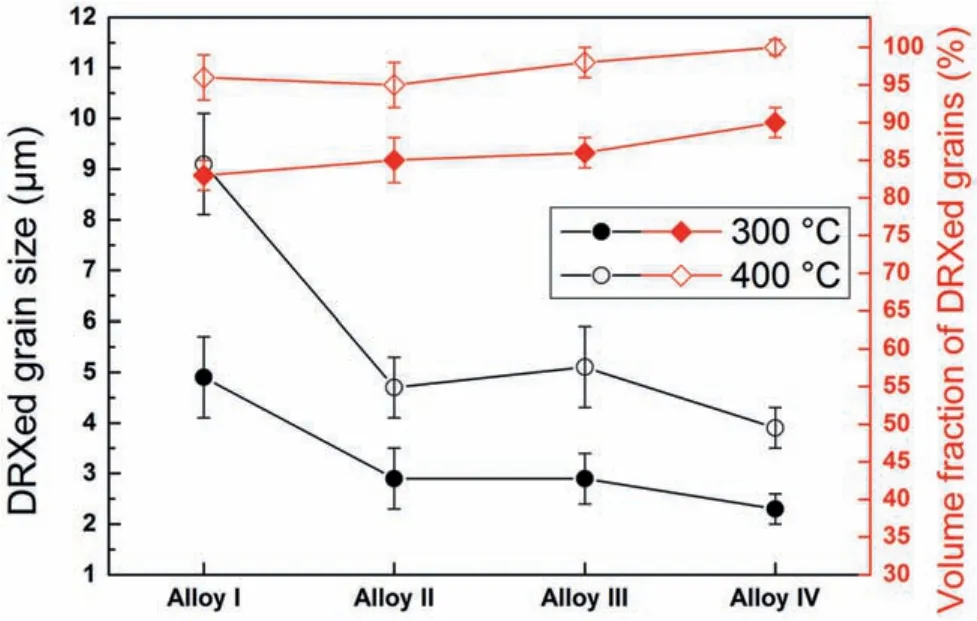
Fig.8.Average grain size and volume fraction of dynamically recrystallized(DRXed)grains in the alloys extruded at 300 °C and 400 °C.
The optical micrographs of the alloys extruded at 300 °C and 400 °C,which were taken from the three dimensions of the alloys,are presented in Fig.7.The average grain size and the volume fraction of the dynamically recrystallized(DRXed)grains are also illustrated in Fig.8.It is evident that the extrusion process resulted in a significan grain refinemen due to the occurrence of DRX.Furthermore,the retained second phase particles were fragmented during the extrusion and rearranged themselves along the extrusion direction.The alloys extruded at 300 °C consisted of fin DRXed grains together with the elongated grains which did not undergo DRX(unDRXed)while the extrusion at 400 °C gave rise to almost complete DRX.It can also be seen in Fig.7(d)and(f)that the Alloy II and Alloy III extruded at 400 °C exhibited several abnormally grown grains.This behaviour is attributed to the further increase in the temperature during the extrusion process and the preferential inhibition of grain growth by the fragmented fin Mg-Zn-Y particles.As demonstrated in Fig.8,at both extrusion temperatures,a substantial decrease in the DRXed grain size was observed after 0.5 wt% Y addition to ZK60-1Nd alloy(Alloy I vs Alloy II).Further additions of Y led to a gradual grain refinemen at lower degree except the Alloy III extruded at 400°C.This is because of the formation of abnormal grains(secondary recrystallization)in the microstructure,which increased the total average DRXed grain size.It can also be deduced from Fig.8 that the volume fraction of DRXed grains,which can also be expressed as the degree of DRX,showed a continual increase with increasing additions of Y and the extrusion temperature.The deformation temperature effect on DRX mechanism was attributed to the activation of plastic deformation modes and the nucleation of new grains at the original grain boundaries[32,33].On the other hand,the increased amount of fin second phase particles with Y additions resulted in an increase in the dislocation density and orientation gradient around the particles and thus,new grains formed at these sites,i.e.,particle stimulated nucleation(PSN)[34,35].Accordingly,fine DRXed grain size and increased degree of DRX were obtained as the Y content increased.Eventually,as shown in Figs.7 and 8,a complete DRX was achieved in the Alloy IV extruded at 400 °C.
The SEM micrographs of the alloys extruded at 300 °C and 400 °C,which were taken from the parallel direction are demonstrated in Fig.9.The EDX analyses of the indicated points in Fig.9 are presented in Table 3.It is evident in Fig.9 that,the second phase particles that remained after homogenization treatment,as shown in Fig.4(e)-(h),were mostly broken into fin particles and distributed along the extrusion direction.The increase in the extrusion temperature from 300 °C to 400 °C did not seem to cause any distinct difference in the distribution of second phase particles.Furthermore,the EDX analyses in Table 3 showed that the fragmented second phases particles in the alloys showed similar compositions with their initial states as shown on their homogenized conditions in Fig.4(e)-(h).In the Alloy I,the T-phase particles were partially broken into fin clusters and some coarse spheroidized particles were still present in the extruded microstructure.In the Y-containing alloys,most of the fragmented particles were composed of Mg-Zn-Y ternary phases,in which at low Y content,most of them accounted for I-phase and with increasing Y content,W-phase also formed containing higher Y amount.Thus,it can be inferred that the extrusion process only affected the size and distribution of the second phase particles and did not lead to any change in their chemical compositions.
3.2.Corrosion
Fig.10 illustrates the effect of Y content on the weight loss per unit area as a function of immersion time.The weight loss of the extruded alloys exhibited continuous increase as the time of exposure to 3.5 wt% NaCl increased.However,during the initial stages of corrosion(up to 12h immersion),the weight loss rate accelerated rapidly above which it continued to increase at lower rate.In aqueous solutions,the protective f lm formation in magnesium alloys consists of an initial thin layer of MgO(<4nm)and a thick cap layer of Mg(OH)2[36,37].The Mg(OH)2layer is more stable than MgO and forms by hydroxylation of MgO due to its low solubility in water.During the corrosion process,Mg(OH)2layer predominates over MgO on the surface of magnesium substrate.Therefore,the reduction in the corrosion rate in Fig.10(a)and(b)can be ascribed to the formation of more stable Mg(OH)2oxide fil on the surface of the alloys at around 12h immersion,which demonstrated a barrier effect on the corrosion propagation[37,38].The average corrosion rates(in mm/y)after the immersion test for 72h,which were calculated with Eq.(1),are also presented in Fig.10(c).It can be seen that the trend in the corrosion rates of the alloys at both extrusion temperatures changed in a similar way,in which it decreased gradually up to 1 wt% Y addition(from Alloy I to Alloy III)and showed a slight increase with 2 wt% Y addition.For all the studied alloys,extrusion at 400°C resulted in lower corrosion rates.Thus,the Alloy III extruded at 400 °C yielded the best corrosion resistance among the studied alloys according to the immersion corrosion test results.
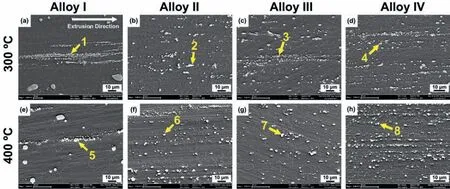
Fig.9.SEM micrographs of the extruded(a)and(e)Alloy I,(b)and(f)Alloy II,(c)and(g)Alloy III and(d)and(h)Alloy IV extruded at(a)-(d)300 °C and(e)-(h)400 °C which taken from the parallel direction.

Table 3EDX results of the phases indicated in Fig.9.
As the extrusion temperature increased from 300 °C to 400 °C,all the studied alloys showed less corrosion pits on their surfaces as illustrated in Fig.11,the alloys extruded at 400 °C exhibited better corrosion resistance.It is agreed that the alloys with lower degree of DRX with deformed grains in the microstructure,produces higher dislocation density and the increased number of dislocations encourages the corrosion process[40,41].With regard to the grain size,a decrease in grain size can produce better corrosion resistance due to the improved formation of more stable oxide film caused by the increased grain boundaries[42,43].The alloys extruded at 400 °C contained greater degree of DRX(i.e.lower dislocation density)but larger DRXed grain size than the alloys extruded at 300°C.This showed that the corrosion improvement caused by the degree of DRX predominated over the corrosion deterioration by the presence of larger grains.Thus,a better corrosion resistance was achieved with rising extrusion temperature.
The potentiodynamic polarization curves of the extruded alloys,which measured on both parallel and transverse planes of the extrudates,are shown in Fig.13.The corrosion rates in mm/y were also calculated after the derivation of corrosion current densities(icorr)from the polarization curves and the results are given in Fig.13(e).It can be seen in Fig.13(a-d)that the corrosion potentials(Ecorr)were very close for all the extruded alloys at both investigated planes.However,the Alloy IV showed a tendency to exhibit more noble potentials.The anodic and cathodic branches in the polarization curves seemed very similar,meaning that both processes affected the corrosion reactions evenly.When the corrosion rate values in Fig.13(e)was compared,evidently the Alloy I extruded at 300°C displayed extremely high corrosion rates,especially on the transverse direction.This is because the transverse surface of the Alloy I extruded at 300 °C exhibited a very negative potential value of−1.64V,which was the lowest among the studied alloys,and this led to a breakage of protective f lm on the surface very early during the corrosion.As shown in Fig.9(a)and(e),this alloy contained a mixture of massive,blocky-shaped and fragmented Mg-Zn-Nd particles on the parallel direction.Thus,the presence of these particles led to a strong micro galvanic coupling and thus,an excessive deterioration in the corrosion rate.Furthermore,the Alloy III displayed an isotropic behavior in the corrosion rates for each extrusion temperature.All the alloys except Alloy III showed slightly poor corrosion resistance on their transverse directions.This can be explained by the different distribution and size of the second phase particles.The divorced distribution of the globular-like Mg-Zn-Y particles on the transverse direction had the greater contact surface area with the matrix phase and this likely caused stronger micro galvanic corrosion.This result is in agreement with the previous studies[44,45].
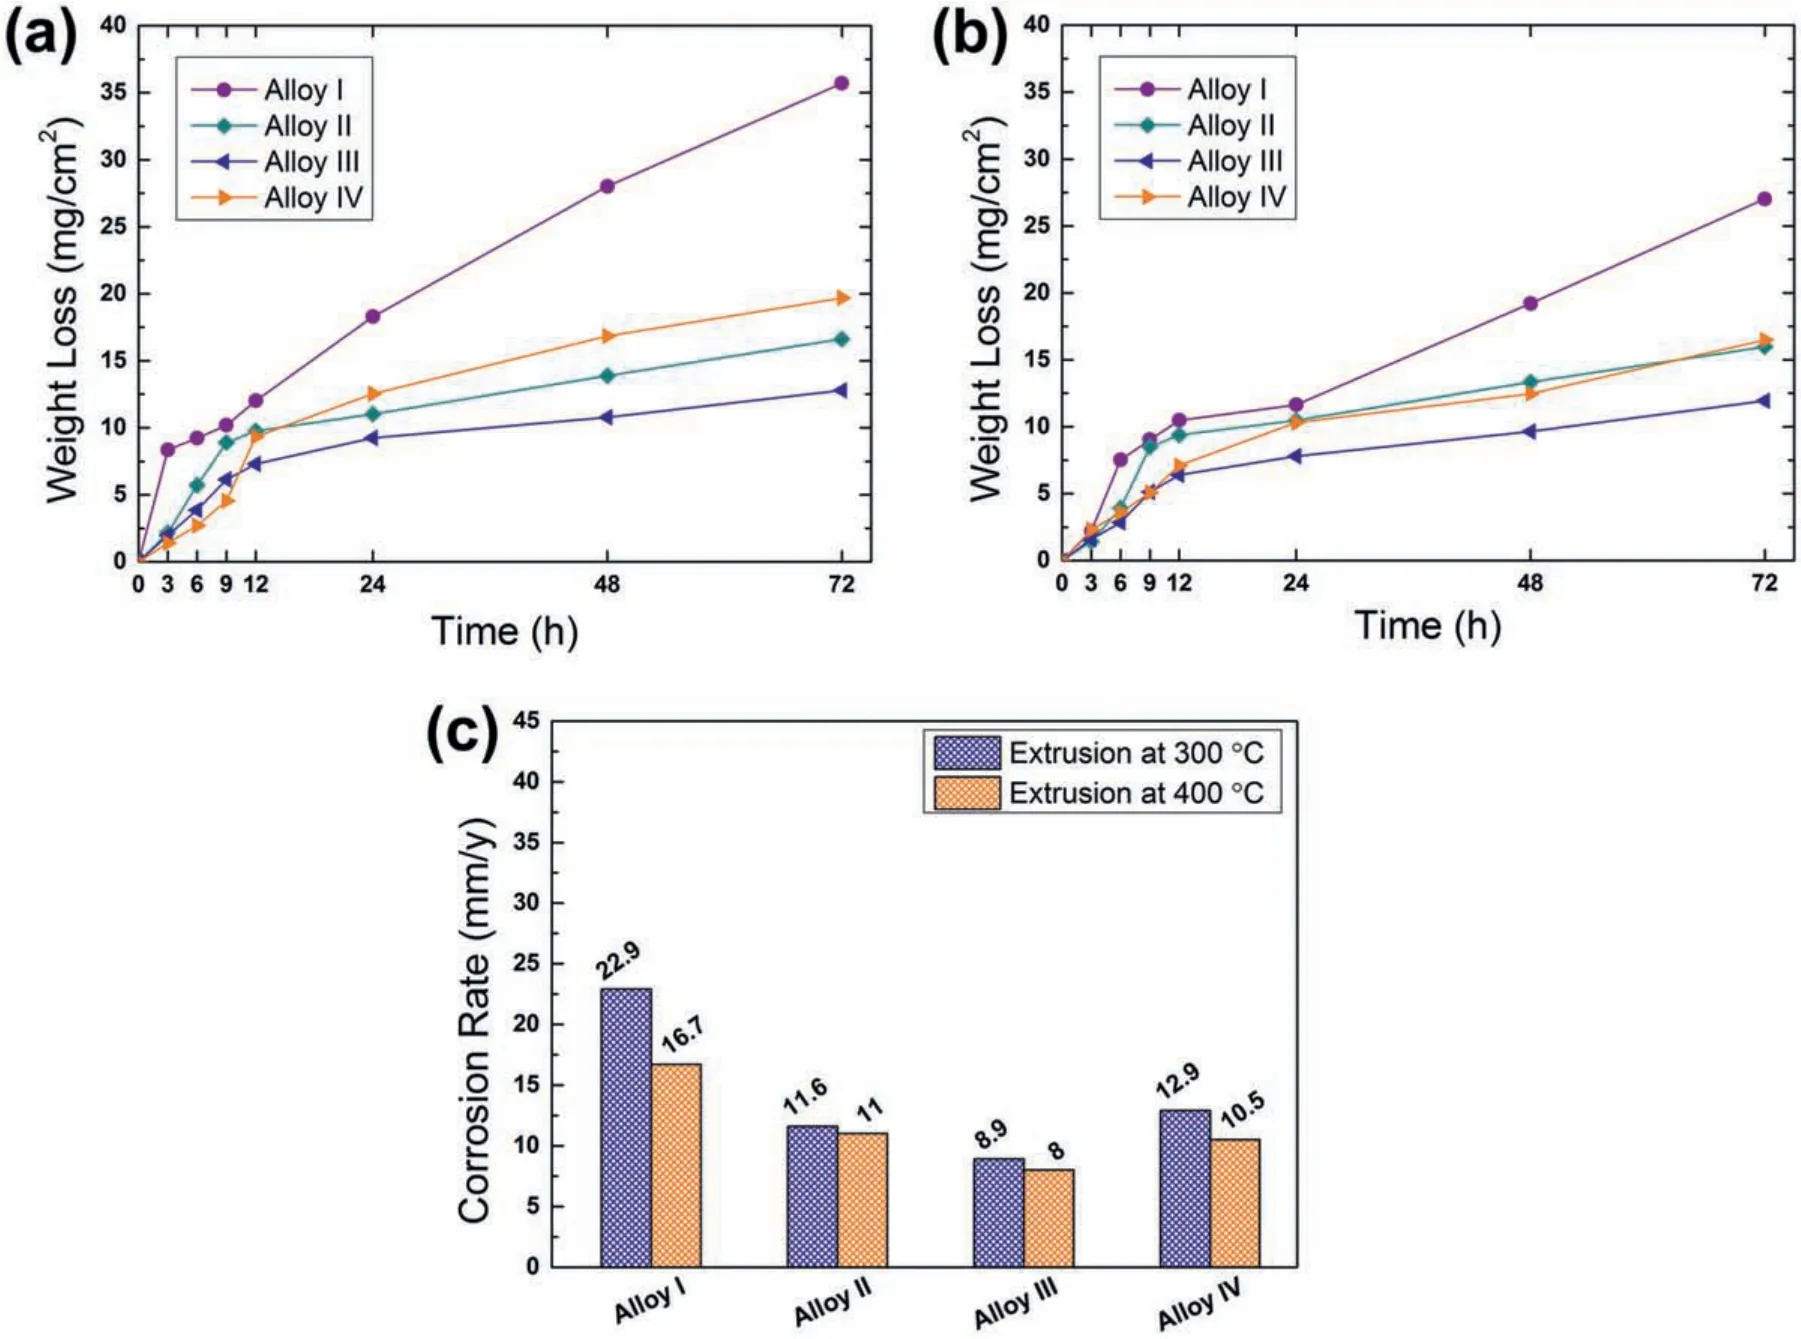
Fig.10.Weight loss of the alloys extruded at(a)300 °C and(b)400 °C,and(c)calculated average corrosion rates.
After the Y additions,the corrosion rates did not result in a remarkable change for both extrusion temperatures and surfaces.In the Alloy II,Alloy III and Alloy IV,the corrosion rates changed in the range from 0.6 to 1mm/y,which can be considered as insignificant However,the Alloy III showed the best corrosion resistance at both surfaces.Therefore,it can be deduced that the small amount of Y additions can lead to a successive improvement on the corrosion resistance of ZK60-1Nd alloy.It was reported that in Mg-Y binary alloys,Y addition can yield a formation of Y2O3oxide together with Mg(OH)2and promote the formation of more stable oxide f lm[46].On the other hand,Chang et al.[25]reported that the additions of Y up to 1 wt% in Mg-5Zn-0.3Zr-2Nd(wt%)gradually deteriorated the corrosion resistance,which ascribed to the higher amount of second phase particles.They proposed that the second phases in the Y-containing alloys led to the microgalvanic coupling effect and acted as cathode to accelerate the corrosion rate.The main reason of this disagreement can be mainly attributed to the size and distribution the second phase particles primarily in the Nd-containing alloys.In the current study,the base Nd-containing alloy(the Alloy I)contained a mixture of high amount of fragmented fin clusters and some remained coarse and globular-like Tphase(Mg-Zn-Nd)particles as can be seen in Figs.7(a)and(b)and 9(a)and(e).However,in the study of Chang et al.[25],the microstructure did not seem to contain T-phase as large as in the current study.Therefore,in their study further additions of Y caused a strong increase in the amount of second phase particles and these particles acted as cathod and reduced the corrosion resistance.However,in the current study,with the employment of Y in the ZK60-1Nd(wt%)alloy caused refinemen of second phase particles and more homogenous distribution throughout the microstructure although there was an increase in the amount of total second phase particles.Thus,the strong microglvanic coupling effect caused by T-phase particles in the Alloy I ceased after the additions of Y up to 1 wt%,above which it caused an increase in the corrosion rate due to the excessive formation of Mg-Zn-Y second phase particles.
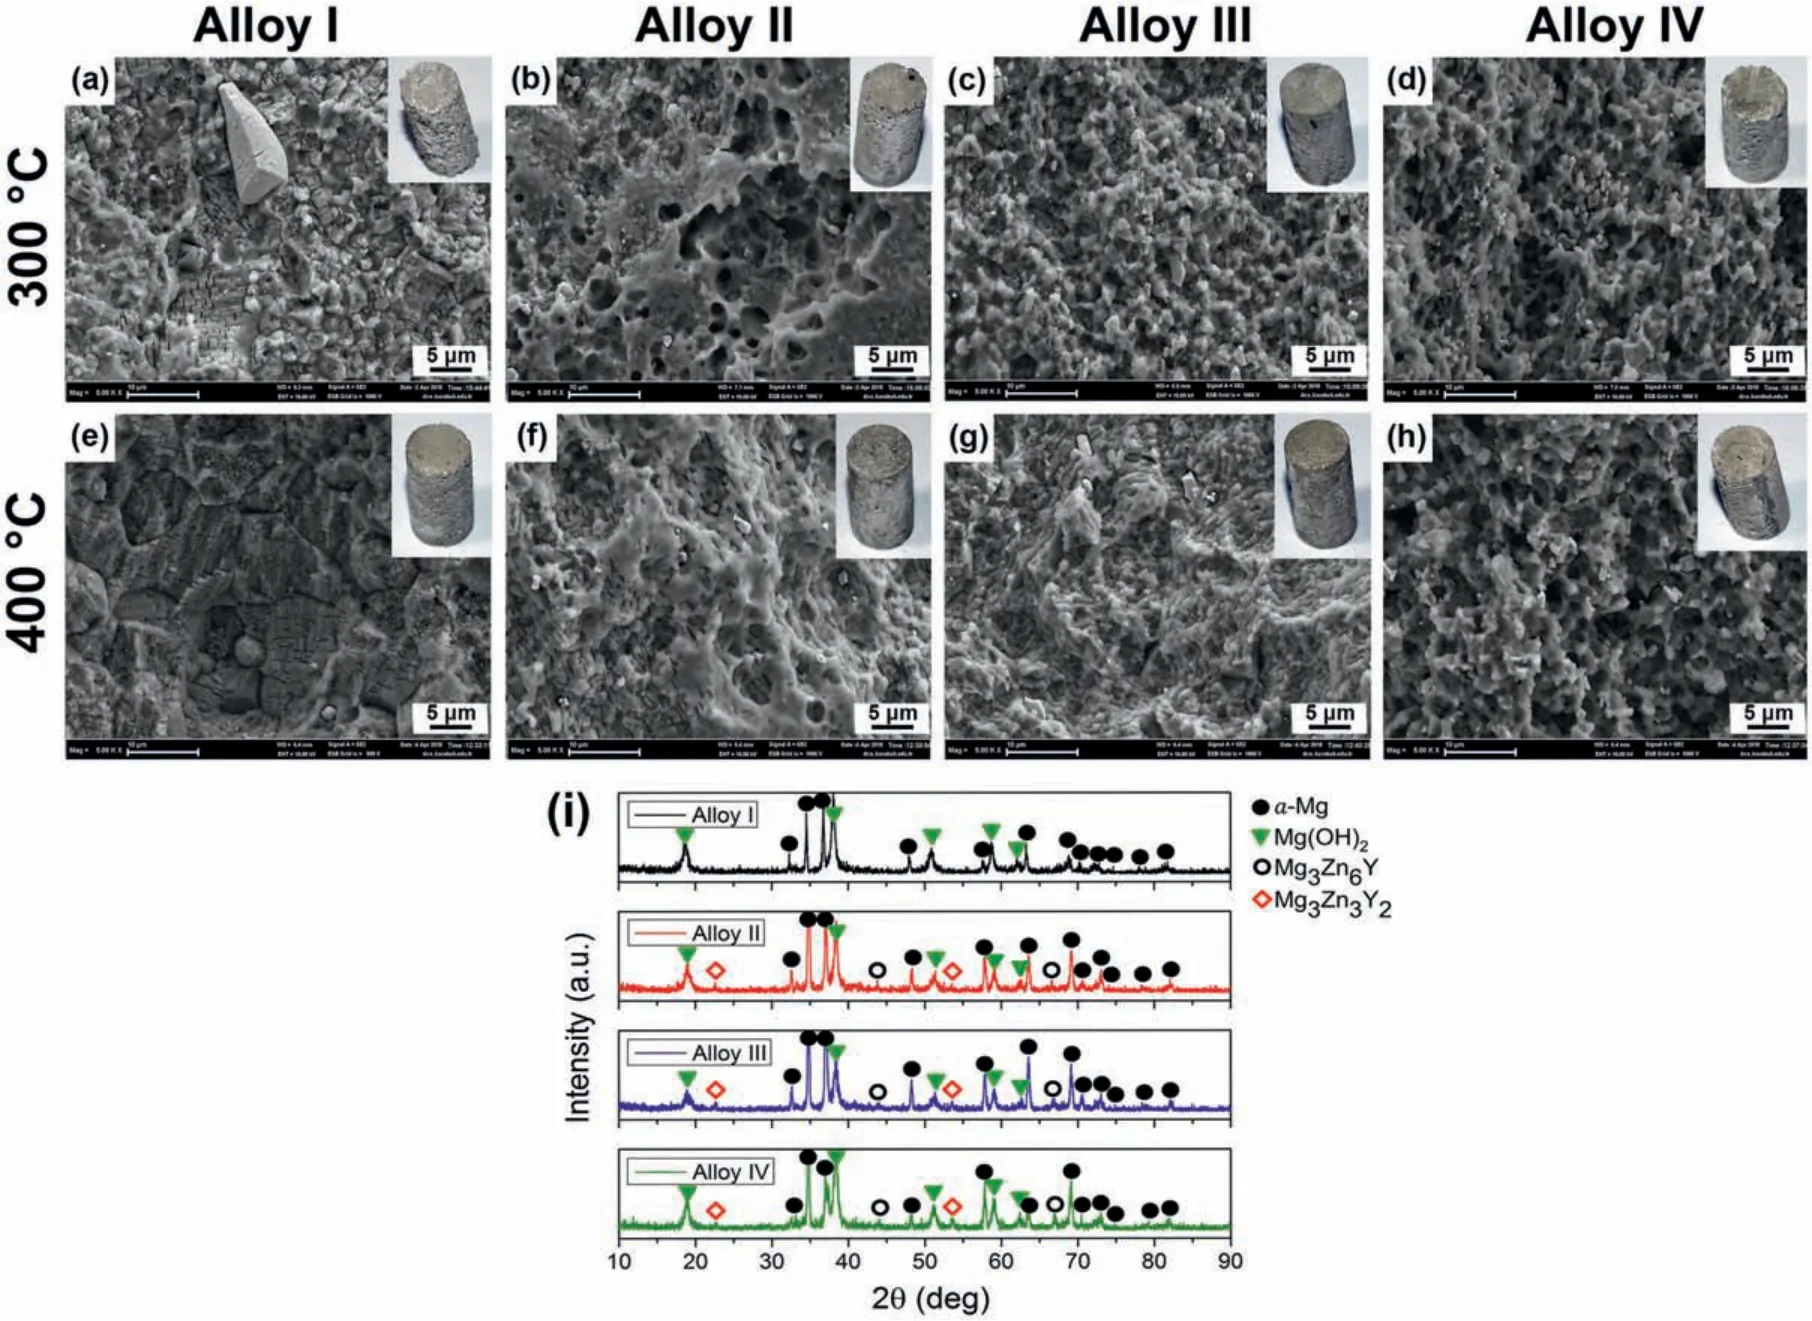
Fig.11.SEM micrographs of the corroded surfaces of(a)and(e)Alloy I,(b)and(f)Alloy II,(c)and(g)Alloy III and(d)and(h)Alloy IV extruded at(a)-(d)300 °C and(e)-(h)400 °C,and(i)XRD patterns of the alloys extruded at 300 °C after immersion for 72h.

Fig.12.Optical micrographs of the cross-sectional corroded surfaces of(a)Alloy I and(b)Alloy IV extruded at 400 °C after immersion for 72h.

Fig.13.Potentiodynamic polarization curves of the alloys extruded at(a)and(b)300 °C and(c)and(d)400 °C,measured on the(a)and(c)parallel and(b)and(d)transverse directions and(e)calculated average corrosion rates.
In order to elucidate the corrosion product film EIS analyses of the extruded alloys at both extrusion temperatures and surfaces were performed and the results are presented in Fig.14.All the Nyquist and Bode plots showed similar behavior,in which one big capacitive loop was obtained for each sample followed by several values and no inductive loop was observed.That is to say,charge transfer and corrosion product fil affected the corrosion mechanism.The further characterization can be made based on the equivalent circuit as shown in Fig.14(m),whereRsis the solution resistance,Rtis the charge transfer resistance,Rfis the corrosion product resistance,CPE1 and CPE2 constant phase elements.The calculated EIS ftting results according to the equivalent circuit in Fig.14(m)are also given in Table 4.It can be seen that the Alloy II and Alloy III exhibited relatively higherRtandRfvalues compared to the Alloy I and Alloy IV.This can be due to the formation and thickening of the corrosion product,causing an effective barrier for the charge transfer process in these alloys.The presence of larger second phase particles in the Alloy I and the higher amount of second phase particles in the Alloy IV likely caused a premature breakage of the fil due to the strong microgalvanic effect.It can also be seen in the Fig.14 that the diameter of the arcs showed variation for different alloys and extrusion temperature,in which the Alloy I and Alloy IV had smaller diameter compared to the Alloy II and Alloy III.This indicated that the Alloy II and Alloy III showed slower corrosion propagation and the protective oxide fil on their surfaces was more stable than the other alloys by the help of beneficia effects of finel distributed Y-containing particles,increased degree of DRX and increased grain boundaries.
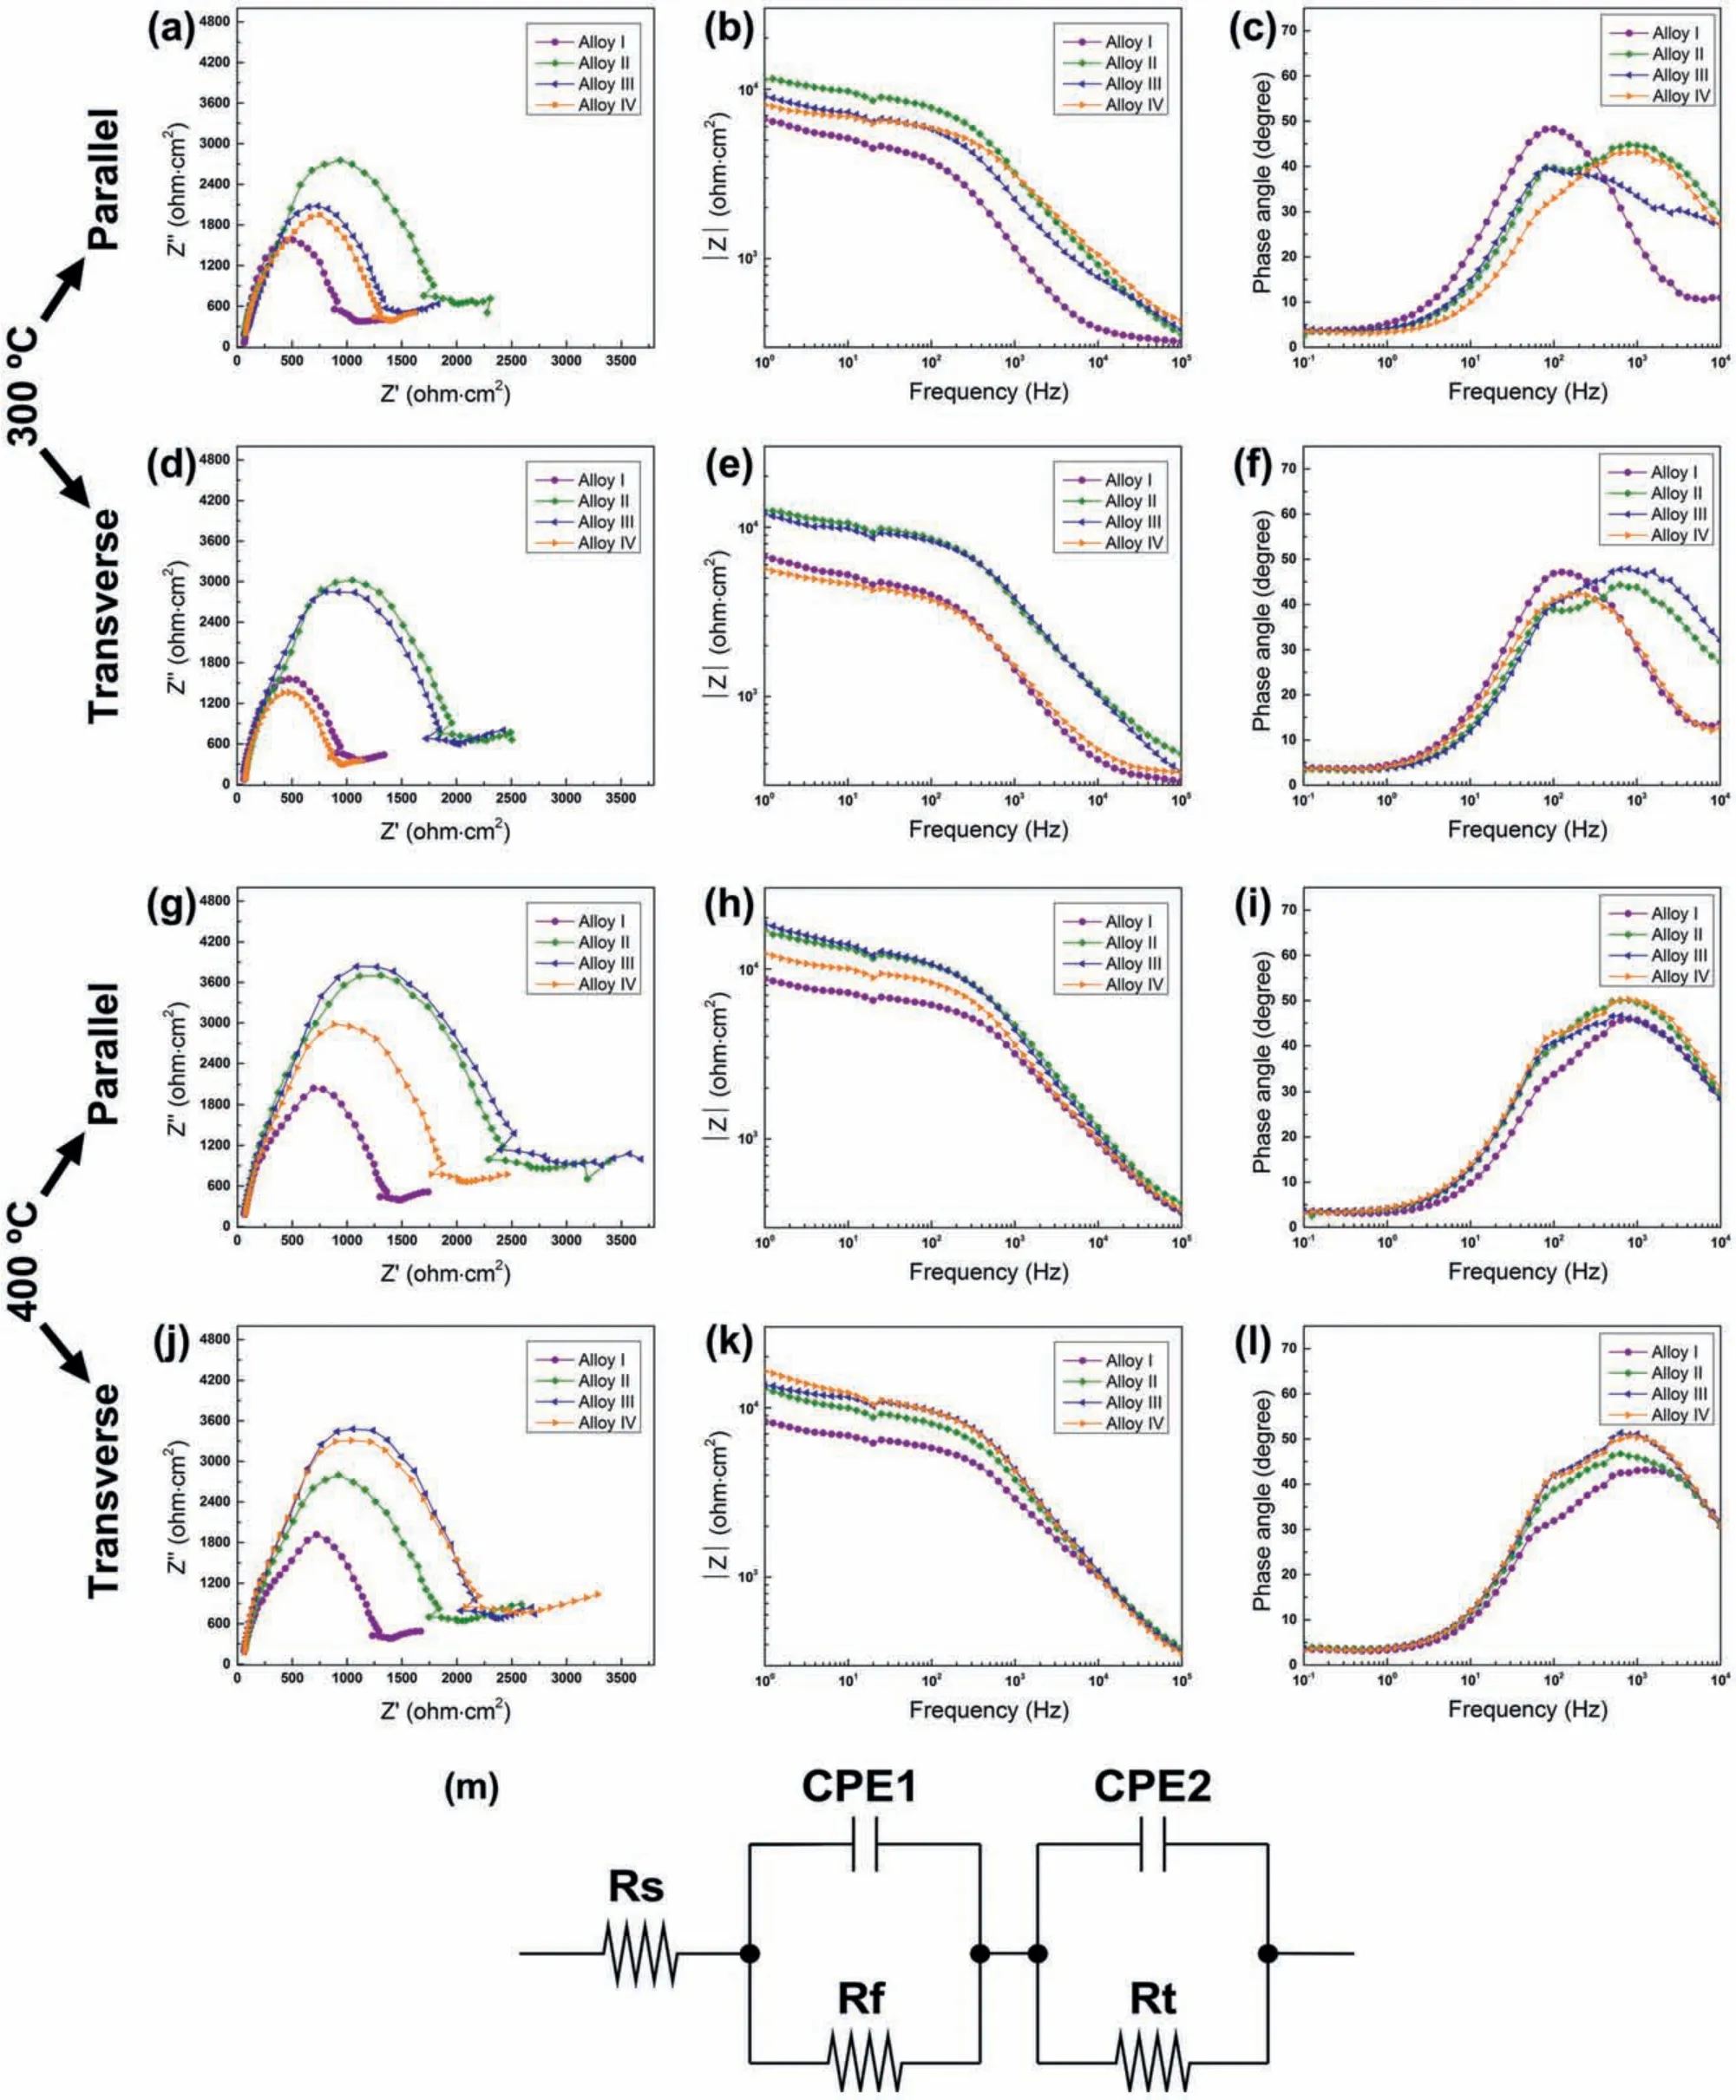
Fig.14.EIS test results of the alloys extruded at(a)-(f)300 °C and(g)-(l)400 °C with(m)corresponding equivalent circuit.
The different behaviors of the micro galvanic attacks on the Mg-Zn-Nd and Mg-Zn-Y particles,which were regarded as the main reason for the poor corrosion resistance are illustrated in Fig.15.The SEM micrographs after immersion for 2h without removal of corrosion products revealed that there were strong micro galvanic attacks around the Mg-Zn-Nd phases in the Alloy I whereas in the Alloy IV,only several micro galvanic attacks were observed around smaller Mg-Zn-Y particles.Therefore,in the Alloy I,the corrosion initiated around these sites and propagated vigorously.This resulted in a marginally reduced corrosion resistance in the Alloy I.

Table 4Fitting results of EIS data.
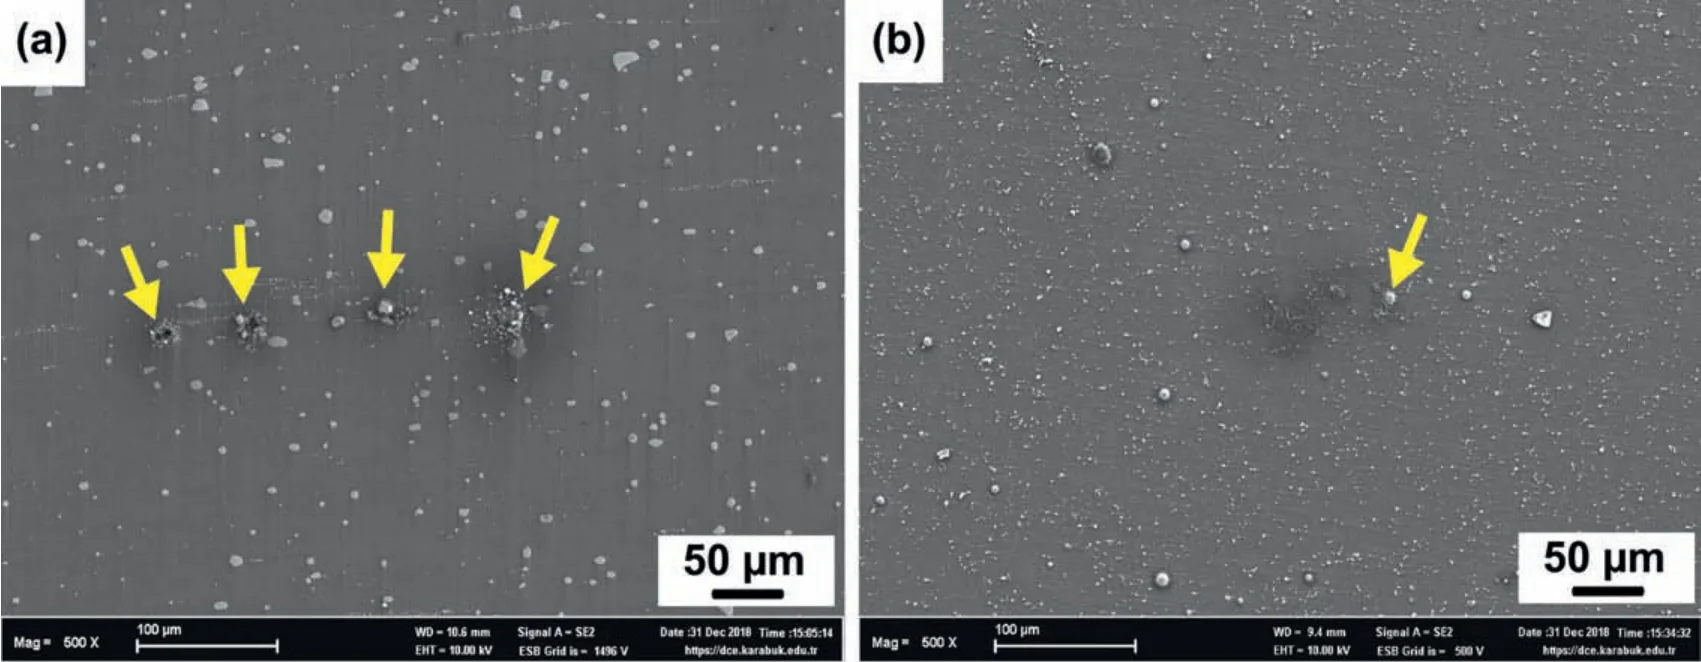
Fig.15.SEM micrographs of the corroded surfaces of(a)Alloy I and(b)Alloy III extruded at 300 °C after immersion for 2h without removal of corrosion products.
4.Conclusion
The effects of Y additions on microstructure and corrosion properties of ZK60-1Nd alloy were investigated in this study and following conclusions were drawn.
·The as-cast microstructure of ZK60-1Nd alloy consisted ofα-Mg,Mg-Zn binary and Mg-Zn-Nd ternary phases.With the increased addition of Y,two kinds of ternary Mg-Zn-Y ternary phases,designated as I-phase(Mg3Zn6Y)and W-phase(Mg3Zn3Y2)were formed.Y addition also led to a significan grain refinement
·Homogenization treatment resulted in a partial dissolution of second phase particles.
·Extrusion process gave rise to a remarkable grain refine ment due to the DRX mechanism and rearrangement of the second phase particles along the extrusion direction.The average DRXed grain size and the volume fraction of the DRXed grains increased as the extrusion temperature increased to 400 °C.
·A strong micro galvanic coupling effect was observed in the ZK60-1Nd alloy.However,this negative effect was reduced by Y addition up to 1 wt% due to the formation of fine grains,fin and uniform distribution of second phase particles and more stable oxide film
Acknowledgments
This research is supported by the Scientifi Research Projects of Karabuk University(BAP)with project no.KBUBAP-16/1-DR-075.
杂志排行
Journal of Magnesium and Alloys的其它文章
- Microstructural evolution of Mg-Al-Re alloy reinforced with alumina fiber
- Predicting and controlling interfacial microstructure of magnesium/aluminum bimetallic structures for improved interfacial bonding
- Plasma electrolytic oxidation of AZ31 and AZ91 magnesium alloys:Comparison of coatings formation mechanism
- Effects of annealing treatment on microstructure and tensile behavior of the Mg-Zn-Y-Nd alloy
- Microstructure and performance of biodegradable magnesium alloy tubes fabricated by local-heating-assisted dieless drawing
- Comparisons of microstructure homogeneity,texture and mechanical properties of AZ80 magnesium alloy fabricated by annular channel angular extrusion and backward extrusion
