Nomograms and risk score models for predicting survival in rectal cancer patients with neoadjuvant therapy
2020-12-11FangZe
Fang-Ze
Wei, Shi-Wen Mei, Jia-Nan Chen, Zhi-Jie Wang, H Hai-Yu Shen, Juan Li, Fu-Qiang Zhao, Zheng Liu,Qian Liu
Abstract
Key Words: Neoadjuvant therapy; Rectal cancer; Nomogram; Overall survival; Diseasefree survival; Risk factor score prediction model
INTRODUCTION
In recent years, neoadjuvant therapy (NT) has been increasingly implemented because it can reduce the risk of local recurrence and toxicity[1,2]. Numerous international guidelines recommend NT as the standard treatment for locally advanced rectal cancer (LARC)[3]. Because of the different sensitivities to adjuvant therapy, approximately 15%-27% of patients achieve a pathological complete response (pCR), and the majority of patients with stage II/III rectal cancer require surgery or adjuvant therapy[4]. Therefore, achieving a pCR is closely related to the need for subsequent treatment. Unlike patients who directly undergo surgical resection, those who first receive NT have more vulnerable immune systems, which can affect surgical outcomes[5]and influence overall survival (OS) and disease-free survival (DFS).
Global studies have reported that colorectal cancer accounts for approximately 1 of 10 newly diagnosed cancer cases and cancer-related deaths, and approximately onethird of colorectal cancer cases are rectal cancer[6,7]. Identifying prognostic factors and accurately predicting OS and DFS can provide individualized treatments for patients and improve their quality of life.
Previous studies have revealed that the number of lymph nodes, response to NT, neoadjuvant rectal score (NAR score), ypTNM stage, and family history[3,8-10]are related to OS and DFS. However, few modules or nomograms use clinical features to predict OS and DFS for LARC after NT. Therefore, identifying clinical features that can serve as prognostic factors and developing accurate models to predict OS and DFS could easily determine clinical treatments and improve the prognosis of patients who have received NT.
In this study, we screened preoperative and postoperative clinical features and constructed a nomogram and risk factor prediction model to predict OS and DFS. To the best of our knowledge, this study is the first attempt to build a nomogram to predict OS and DFS by screening risk factors using least absolute shrinkage and selection operator (LASSO) regression.
MATERIALS AND METHODS
Patients
We analyzed 220 patients who were clinically diagnosed with LARC and divided them into two groups: 165 patients in the primary cohort and 65 patients in the validation cohort. All patients were admitted to the Colorectal Surgery Department of the National Cancer Hospital from 2015 to 2017 and were administered preoperative NT followed by laparoscopic total mesorectal excision (TME).
We collected available demographic and clinical characteristics before NT and after TME surgery as follows: Age, sex, body mass index (BMI), clinical T (cT) and N stages (cN), pathological T (yT) and N stages (yN), ypTNM, total number of lymph nodes, positive lymph node status, preoperative chemotherapy cycle, radiotherapy cycle, distance of the tumor from the anal verge before NT and after NT, pathological response, preoperative chemotherapy regimen, radiotherapy dose, operating time, matchmouth distance from the edge, surgical procedure, preoperative carcinoembryonic antigen (CEA), postoperative CEA, and follow-up data.
This study was approved by the ethics committee at our institution. The clinical information and characteristics were recorded and analyzed after consent was obtained from the patients and their families.
Therapy
Regarding preoperative radiotherapy, the long-course regimen radiation dose ranged from 45.0-50.5 Gy; for patients who received the short-course regimen, the total dose was 25 Gy. Radiation was delivered to the pelvic cavity and tumor bed at 10 MV. All patients received TME approximately 2-60 weeks after NT based on their physical conditions. For patients who had received adjuvant therapy, three chemotherapeutic regimens were completed following radiotherapy: XELOX, capecitabine or 5-fluorouracil (5-FU) alone and capecitabin or 5-FU combined with other medicine.
Follow-up
Clinical data were obtained from follow-up visits conducted by the outpatient clinic and by telephone or email. For patients who visited the outpatient clinic, the medical history was collected, and a complete physical examination was carried out. Serum tumor marker CEA measurements and enhanced CT examinations of the pelvis were performed to detect and monitor recurrence and physical condition[3,8-10]. A colonoscopy was performed every 6 months for the first two years and once a year after two years. All patients were followed up every three months after surgery, and the last follow-up month was March 2020. DFS was defined as the time from the date of surgery to the time of recurrence or death, whereas OS was defined as the time from the date of surgery to the time of death or the last date of follow-up.
Statistical analysis
LASSO regression and nomogram construction were conducted with R software (version 3.6.1). The prognostic factors were initially screenedviaLASSO regression through the R packages “survival” and “glmnet”. We utilized Cox regression to validate the prognostic factors. Then, the Kaplan-Meier (K-M) prognosis curves were drawn using the online tool Sanger box. Continuous variables were analyzed by Cox regression, and the R package “survival” was utilized to analyze variables. Each sample was categorized, and the differences in the K-M prognosis curves between the two groups were analyzed. Then, the cycle was repeated, and thePvalue of each sample was calculated and assessed using the log-rank test. The nomograms were established based on the key factors screened by the LASSO regression R package “rms”. The C-index and calibration curves of the nomograms for OS and DFS reflect the accuracy between the predicted and observed results. Risk factor prediction models were built using the R package “survival”, and ROC curves were constructed with the R package “survivalROC”. LASSO regression, Cox regression, K-M curves and prediction models were based on 220 patients, and nomograms were built according to the primary cohort and validated using the validation cohort.
RESULTS
Characteristics of patients
Figure 1 shows the workflow of our study. All patients underwent TME surgery. In the primary cohort, 99 (63.9%) patients were men, and 56 (36.1%) were women; 30 patients experienced recurrence, while 18 died. In the validation cohort, 53 (81.5%) patients were men, and 12 (18.5%) were women;, and 17 patients experienced recurrence, and 15 died (Tables 1-4). The median follow-up time was 41 months, and the median OS was 40.73 months (range, 2 to 62 mo). The 1-year, 3-year, and 5-year OS rates were 99.35%, 67.74%, and 4.52%, respectively. The median DFS was 38.54 (range, 2 to 62 mo), and the 1-year, 3-year, and 5-year DFS rates were 92.26%, 61.29%, and 3.23%, respectively.
Prognostic factor selection
Based on the clinical data, there were 10 potential prognostic factors in the LASSO regression model for OS selected out of 50 clinical features: Vascular_tumors_bolt, cancer nodules, yN, cT, ypTNM, BMI, matchmouth distance from the edge, nerve aggression, postoperative CEA and operation time (Figure 2A and B). We utilized Cox regression to validate the prognostic value. Among the factors, there were three factors with a value ofP> 0.05: Operation time, cT and ypTNM (Table 5).
There were two potential prognostic factors for DFS in the LASSO regression model based on 50 clinical features: ypTNM and nerve aggression (Figure 3A and B). We utilized Cox regression to validate the two factors, which were shown to have a good prognostic value for DFS (Table 6).
As shown in Figure 4A-C, all continuous variables were grouped into high expression and low expression groups. The K-M curve of the prognosis difference between the two groups for each variable was analyzed to determine which prognostic factors were associated with a good prognosis of LARC patients treated with NT. K-M curves of classified variables are also shown to highlight the prognostic value (Figure 4D-I). The result of Kaplan-Meier curves for the prognostic factors of OS and DFS are shown in Tables 7 and 8.
Prognostic nomogram for OS and DFS
The nomogram integrated all of the prognostic factors for OS and DFS as shown in Figure 5A and B; these factors were screened by LASSO regression. The C-index for prediction of OS was 0.91 (95%CI: 0.85-0.97), and that for DFS prediction was 0.77 (95%CI: 0.69-0.85).
Validation of the nomograms
The effectiveness of the nomograms was tested in the validation cohort, and the Cindex and calibration plot revealed the prognostic value of these models for OS and DFS. The C-index for prediction of OS was 0.69 (95%CI: 0.53-0.84), and that for prediction of DFS was 0.71 (95%CI: 0.61-0.81). Therefore, the established nomograms were well calibrated and showed good predictive value for OS and DFS (Figure 6).
Risk factor score prediction models for OS and DFS
We utilized Cox proportional hazards regression analysis of the clinical characteristics to develop the prognostic models (Figure 7A-F). According to the prognostic risk score, all patients were divided into a low-risk and a high-risk group. The risk scores reflected the 3-year and 5-year survival rates of the patients. K-M curves were used to show the relationship of the risk score with OS and DFS in the low-risk and high-risk groups, and these curves verified that a low risk score had a stronger positive association with OS and DFS (OS:P= 3.576e-05; DFS:P= 2.91e-06; Figure 7A and D). The AUCs of ROC curves for 3-year and 5-year OS were 0.811 and 0.782 (Figure 7B and C). The AUC for 3-year DFS was 0.784, and that for 5-year DFS was 0.754, as shown in Figure 7D and F.

Table 1 Patient demographics
DISCUSSION
Recently, NT has emerged as the standard treatment for LARC patients[11-14]. Patients who cannot achieve a pCR usually undergo surgery and receive adjuvant therapy. Compared to patients who undergo traditional surgery and adjuvant therapy without NT, patients who receive NT have a more complex physical condition because of theinfluence of NT[15,16]. Additionally, the prognostic factors for OS and DFS also change. Thus, exploring the prognostic factors that can predict OS and DFS has become necessary.

Table 2 Clinical data before surgery

3 1 0.6 yM 0 146 94.2 62 95.4 1 9 5.8 3 4.6 ypTNM 0 21 13.5 8 12.3 1 28 18.1 12 18.5 2 39 25.2 15 23.1 3 58 37.4 27 41.5 4 9 5.8 3 4.6 Pathological changes after treatment 1 85 54.8 38 58.5 2 48 31 19 29.2 3 22 14.2 8 12.3 TRG 0 3 1.9 2 3.1 1 27 17.4 14 21.5 2 62 40 26 40.0 3 41 26.5 15 23.1 4 22 14.2 8 12.3 Preoperative simultaneous chemotherapy Yes 126 81.3 51 78.5 No 29 18.7 14 21.5 Preoperative radiotherapy Yes 3 1.9 4 6.2 No 152 98.1 61 93.8 Preoperative chemotherapy Yes 26 16.8 10 15.4 No 129 83.2 55 84.6 CEA: Carcinoembryonic antigen; TRG: Tumor regression grade. Pathological changes after treatment, 1: no-downstaging; 2: downstaging; 3: Polymerase chain reaction.
Many studies have revealed that lymph node metastasis, low BRCA2 expression and other variables can be prognostic factors for patients administered NT. In our study, we developed and validated risk score prediction models and nomograms for OS and DFS based on clinical characteristics. Preliminary screening of potential factors by LASSO regression can reduce the number of features included and screen only critical factors[17,18]. Cox regression and K-M curves can further verify the prognostic value of key factors. The followings were included in the nomogram for OS: Vascular_tumors_bolt, cancer nodules, yN, BMI, matchmouth distance from the edge, nerve aggression and postoperative CEA. The nomogram of DFS included the following variables: ypTNM and nerve aggression. The risk factor score prediction models included the same risk factors as the nomograms. The AUCs for the prediction models for both OS and DFS were high and showed that a low risk score had a strong positive association with the years of survival, indicating that the risk factor and prognostic models had good prognostic value for LARC.
Table 3 Surgical and pathological data

Yes 17 11 9 13.8 No 138 89 56 86.2 Postoperative pathology, 1: Highly differentiated adenocarcinoma; 2: Moderately and Second differentiated adenocarcinoma; 3: Poorly and medium differentiated adenocarcinoma; 4: Signet-ring cell carcinoma; 5: mucinous adenocarcinoma.
Regarding the prognostic factors of OS, 50 candidate clinical features were reduced to 10 potential predictors, and through Cox regression analysis, three factors could be eliminated: Operation time, cT and ypTNM. ThePvalues of operation time, cT and ypTNM were higher than 0.05. The distance of the tumor from the anal margin is closely related to operation time and other important factors[19-21]because if the tumor is close to the anus, anal preservation will be prioritized. However, removing the anus or preserving the lower anus can be a lengthy procedure; therefore, the operation time may be related to the tumor location after NT. In addition to the distance from the margin after NT, the matchmouth distance from the edge can more comprehensively reflect the tumor type. Changes in the size of the tumor can influence the type of surgery, which will also affect the distance of the matchmouth from the edge. Changes in tumor size before and after NT were related to the tumor response to treatment. Therefore, although the operation time and ypTNM can reflect the different statuses, they also have a close relationship with the matchmouth distance from the edge, thus we excluded the two variables. Regarding the distance from the margin to the anus, a shorter distance from the matchmouth to the anus corresponds to shorter survival time.
Laparoscopic surgery for colorectal cancer has a shorter postoperative exhaust time than conventional left hemicolectomy[22]. Postoperative exhaust time is an important postoperative indicator that is closely related to obstructive colorectal cancer[23,24]. In our cohort, only one patient presented with obstruction; therefore, the prognostic value of postoperative exhaust time was not screened out by the LASSO regression analysis.
The appearance of cancer nodules is an important factor associated with primary tumor metastasis and has been suggested to reflect the effects of adjuvant therapy. With the development of UICC/AJCC staging standard, the definition and staging of cancerous nodules have gradually improved, and the prognostic value of nodules in colon cancer is also increasing. In previous studies, cancer nodules were thought to significantly increase the rates of local recurrence and metastasis in colorectal cancer[25]. Cancer nodules had the lowest contribution to our nomogram for OS; if patients have cancer nodules, the nomogram score will increase, and OS will decrease.
yN was evaluated after surgery. For tumors located in or near the rectum, the N stage significantly more frequently either remained stable or progressed, but treatment with surgery and adjuvant therapy could also have an effect. yN is a good prognostic factor for DFS and cancer-specific survival[26-28]. Pathological examination is very important for patients who receive NT because it can ensure the appropriate staging and treatment. In our study, both LASSO regression and the K-M curves revealed that yN had good prognostic value; thus, we included this variable to ensure that our nomogram fully reflects the condition after adjuvant therapy. Regarding yN, in the nomogram, as the N stage progresses, the nomogram score increases and survival decreases. Of note, yN3, which is to the left of yN0 and yN1, may be due to lymph node changes after NT, which was found at a high rate by the surgeon performing the resection.
BMI reflects the patients’ weight and height. As a risk factor for colorectal cancer[29,30], the BMI value is an important prognostic indicator. Patients with a higher BMI tend to be more obese and have shorter survival based on our nomogram. We also explored the level of the serum tumor marker CEA because it is an important and strong diagnostic biomarker both before therapy and after surgery[31]. In our nomogram, a higher CEA level indicates shorter survival.
LARC poses several challenges, including recurrence[32]. Tumor recurrence is an important factor affecting the prognosis and survival of tumor patients[33]. A lower probability of recurrence leads to a higher survival rate. In previous studies, recurrence has been linked with biomarkers such as BRAF-6000E, RAS and CD8-positive T-cells[11,34,35], and an early diagnosis[25]can take advantage of the patients’ clinical information. In identifying predictive factors of DFS, 50 clinical features were reduced to 2 potential predictors of DFS. The DFS nomogram included ypTNM and nerve aggression. Pathologic TNM (ypTNM) has been considered a good prognosticfactor in many studies. Utilizing ypTNM, our study also confirmed that ypTNM is a strong predictor for DFS[36-38]. Nerve aggression was also an important predictive factor in our study. A higher ypTNM or presence of nerve aggression corresponds to a shorter survival time.

Table 4 Clinical data after surgery

Table 5 Cox regression analysis for the prognostic factors of overall survival

Table 6 Cox regression analysis for the prognostic factors of disease-free survival
There are limitations to our study. The data included here were all from a single network of tumor hospitals, thus lacking representation of the general population. Additionally, our research in the field of molecular target design is poorly established.

Table 7 Kaplan-Meier curves for the prognostic factors of overall survival
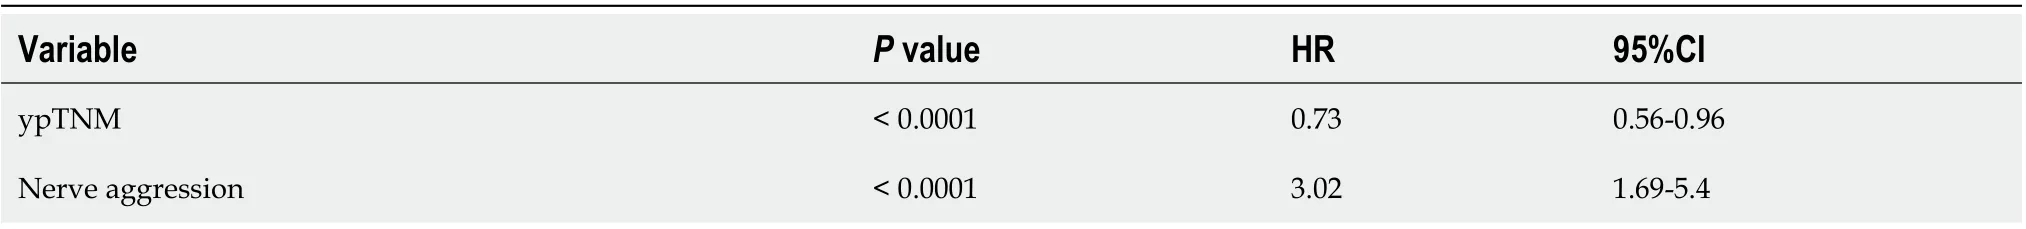
Table 8 Kaplan-Meier curves for the prognostic factors of disease-free survival

Figure 1 Analysis workflow in this study. ROC: Receiver operating characteristic; OS: Overall survival; DFS: Disease-free survival; KM: Kaplan-Meier.
CONCLUSION
Recurrence, cancer nodules, yN, positive lymph node status, BMI, matchmouth distance from the edge, distance from the margin after NT and postoperative CEA were prognostic factors for OS, and ypTNM and nerve aggression were prognostic value for DFS. We created and validated nomograms and prediction models that can objectively and accurately predict OS and DFS in LARC patients.

Figure 2 Selection of prognostic factors using the least absolute shrinkage and selection operator regression model. A: A graph of the error rate of cross-validation; B: least absolute shrinkage and selection operator coefficient profiles of the 151 texture features.
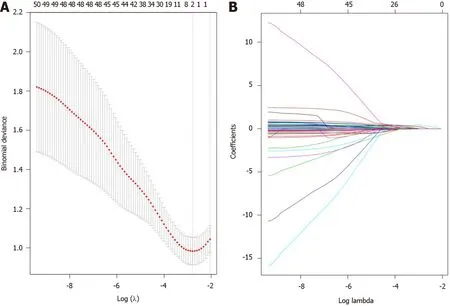
Figure 3 Prognostic factor selection using the least absolute shrinkage and selection operator. A: A graph of the error rate of cross-validation; B: Least absolute shrinkage and selection operator coefficient profiles of the 150 texture features.

Figure 4 Kaplan-Meier survival curves for the prognostic factors of overall survival and disease-free survival. A-G: The prognostic factors for overall survival; H, I: The prognostic factors for disease-free survival. BMI: Body mass index; CEA: Carcinoembryonic antigen.

Figure 5 Survival nomogram. A: The nomogram for overall survival was developed in the primary cohort with eight prognostic factors: recurrence, cancer nodules, yN, positive lymph node status, body mass index, matchmouth distance from the edge, distance from the margin after neoadjuvant therapy and postoperative carcinoembryonic antigen; B: The nomogram for disease-free survival was developed in the primary cohort with two prognostic factors: ypTNM and nerve aggression.
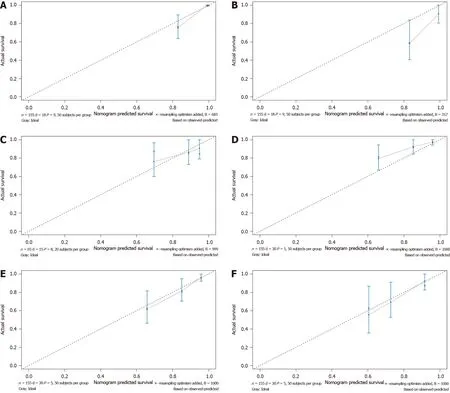
Figure 6 Calibration curve for predicting patient survival. A: 3-year and B: 5-year overall survival (OS) rates in the primary cohort; C: 3-year OS rate in the validation cohort; D: 1-year and E: 3-year disease-free survival (DFS) rates in the primary cohort; F: 3-year DFS rate in the validation cohort.

Figure 7 Kaplan-Meier and receiver operating characteristic curve for the risk factor score prediction model. A: Kaplan-Meier (K-M) overall survival (OS) curves for the low-risk and high-risk groups; B: Receiver operating characteristic (ROC) curves for the 3-year and C: 5-year OS rates of locally advanced rectal cancer (LARC); D: K-M disease-free survival (DFS) curves for the low-risk and high-risk groups; E: ROC curves for the 3-year and F: 5-year DFS rates of LARC.
ARTICLE HIGHLIGHTS

Research motivation
There is a lack of consensus concerning the risk factors after administration of neoadjuvant therapy for LARC. Nomograms and risk prediction models for survival can help clinicians to choose therapy according to patient's individual risk.
Research objectives
The main aim of this study was to explore the prognostic factors and establish effective prognostic nomograms and risk score prediction models to predict overall survival (OS) and disease-free survival (DFS) for LARC treated with NT.
Research methods
Nomograms and risk factor score prediction models were based on patients who received NT. LASSO regression was utilized to screen for prognostic risk factors, which were validated by the Cox regression. ROC curves, C-index and calibration curves were performed to evaluate the prediction models and nomograms.
Research results
Seven features, including vascular_tumors_bolt, cancer nodules, yN, body mass index (BMI), matchmouth distance from the edge, nerve aggression and postoperative carcinoembryonic antigen (CEA), were significantly associated with OS. The nomogram for predicting DFS included ypTNM and nerve aggression. The primary and validate cohort showed good predictive value. The prediction model for OS and DFS had good predictive value.
Research conclusions
We established accurate nomograms and prediction models for predicting OS and DFS in patients with LARC after undergoing NT.
Research perspectives
Larger prospective multicenter clinical studies need to be performed to validate the nomograms and risk score prediction models of OS and DFS.
ACKNOWLEDGEMENTS
We would like to thank the National Cancer Center/National Sciences Research Center for Cancer/Cancer Hospital, Chinese Academy of Medical Sciences and Peking Union Medical College.
杂志排行

World Journal of Gastroenterology的其它文章
- Nonalcoholic fatty liver disease in lean subjects: Prognosis, outcomes and management
- Modern surgical strategies for perianal Crohn's disease
- Simultaneous colorectal and parenchymal-sparing liver resection for advanced colorectal carcinoma with synchronous liver metastases: Between conventional and mini-invasive approaches
- Estimation of visceral fat is useful for the diagnosis of significant fibrosis in patients with non-alcoholic fatty liver disease
- Attention deficit hyperactivity disorder and gastrointestinal morbidity in a large cohort of young adults
- Reactive oxygen species-induced activation of Yes-associated protein-1 through the c-Myc pathway is a therapeutic target in hepatocellular carcinom