Contribution of Global Warming and Atmospheric Circulation to the Hottest Spring in Eastern China in 2018
2020-10-15ChunhuiLUYingSUNNikolaosCHRISTIDISandPeterSTOTT
Chunhui LU, Ying SUN*,3, Nikolaos CHRISTIDIS, and Peter A. STOTT
1National Climate Center, Laboratory for Climate Studies, China Meteorological Administration, Beijing 100081, China
2Met Office Hadley Centre, Met Office, Exeter EX1 3PB, UK
3Collaborative Innovation Center on Forecast and Evaluation of Meteorological Disasters,Nanjing University of Information Science and Technology, Nanjing 210044, China
ABSTRACT The spring of 2018 was the hottest on record since 1951 over eastern China based on station observations, being 2.5°C higher than the 1961−90 mean and with more than 900 stations reaching the record spring mean temperature. This event exerted serious impacts in the region on agriculture, plant phenology, electricity transmission systems, and human health. In this paper, the contributions of human-induced climate change and anomalous anticyclonic circulation to this event are investigated using the newly homogenized observations and updated Met Office Hadley Centre system for attribution of extreme events, as well as CanESM2 (Second Generation Canadian Earth System Model) simulations. Results indicate that both anthropogenic influences and anomalous anticyclonic circulation played significant roles in increasing the probability of the 2018 hottest spring. Quantitative estimates of the probability ratio show that anthropogenic forcing may have increased the chance of this event by ten-fold, while the anomalous circulation increased it by approximately two-fold. The persistent anomalous anticyclonic circulation located on the north side of China blocked the air with lower temperature from high latitudes into eastern China. Without anthropogenic forcing or without the anomalous circulation in northern China, the occurrence probability of the extreme warm spring is significantly reduced.
Key words: extreme warm spring, extreme event attribution, anthropogenic influence, circulation effect
1. Introduction
In the context of global warming, observed warm extremes have clearly become hotter, more frequent, and longer lasting (Zwiers et al., 2011; Min et al., 2013; Morak et al., 2013; Lu et al., 2018) than before. Extreme temperature events usually cause more destructive disasters and greater economic losses than mean climatic conditions(IPCC, 2013). For example, eastern China suffered an extreme heat wave event in the summer of 2013 that caused economic losses of 59 billion RMB and lots of casualties(Hou et al., 2014). Under the medium RCP4.5 emissions scenario, heat waves in China are projected to become a common event in the coming decades (Sun et al., 2014, 2018a).In the face of increasing risks related to climate change,world societies need to better understand these risks to prevent climate-related disasters, especially in areas with high levels of exposure and vulnerability.
As a challenging but very important research area, attribution studies of climate extremes attempt to determine the extent of anthropogenic climate change in the probability or magnitude of particular events (Stott et al., 2016). Accumulating evidence has shown that anthropogenic forcing has increased the occurrence probability of warm extreme events (Stott et al., 2004; Min et al., 2014; Christidis et al.,2015; Dong et al., 2016; Mitchell, 2016) and has possibly reduced the probability of cold extreme events (van Oldenborgh et al., 2015; Christiansen et al., 2018) in many areas of the world. In China, there have been increasingly intense and frequent high temperature extremes in the last several decades (CMA and NCC, 2018, 2019). Sun et al. (2014) investigated the 2013 heat wave in eastern China and quantified the contributions from anthropogenic influence. Subsequent studies have examined possible anthropogenic influences, mainly greenhouse gases, on both warm and cold extreme events,heavy precipitation, and other events in different areas of China (Song et al., 2015; Sun et al., 2015; 2018b; Lu et al.,2016; Qian et al., 2018; Chen et al., 2019).
Meanwhile, Trenberth et al. (2015) suggested that it is of equal importance to consider the influences of large-scale atmospheric circulation when attributing causes to weather or climate events. Christidis and Stott (2015) analyzed the extreme rainfall in the UK during winter 2013/14 and found that the atmospheric circulation made a greater contribution to the event than anthropogenic forcings. Similarly, Hoerling et al. (2014) indicated that the atmospheric situation was the main player in the Boulder floods of September 2013, whereas climate change has likely decreased the probability. In China, there are few studies that have investigated the contributions of atmospheric circulation to extreme events. For instance, the record-breaking heat over Northwest China in July 2015, the extreme heat event over Northeast Asia in summer 2018, and the extreme precipitation in summer in the Yangtze River−Huaihe River basin of China were found to be related to different circulation patterns(Miao et al., 2016; Sun and Miao, 2018; Ren et al., 2020).In the latter study, the preceding winter El Niño was proven to have increased the risk of this extreme precipitation by 1.5- to 4-fold.
Eastern China is the most important economic center and the most densely populated zone in China. The recordbreaking temperature in the spring (March to May, MAM)of 2018 caused drought, warm winds, and related serious impacts on agriculture, plant phenology, electricity transmission systems, and human health (CMA and NCC, 2019). To elucidate the possible causes of this event, this paper examines the influences of human activities and anomalous circulation patterns on the event probabilities based on two types of framing: one is conditional on the observed external forcing using coupled model simulations based on CanESM2(the Second Generation Canadian Earth System Model),and the other is conditional on both the observed external forcing and the state of oceanic circulation based on atmospheric model simulations in HadGEM3A. The paper is structured as follows: section 2 describes the data and detection methods, including data processing; section 3 presents the primary results; the conclusions and some discussion are provided in section 4.
2. Data and methods
2.1. Observations
Daily mean (TAS) and maximum (TASmax) near-surface air temperatures during 1960−2018 at 2419 Chinese stations were used in this study. This dataset has been quality controlled and homogeneity adjusted (Xu et al., 2013;Wang and Feng 2014) at China’s National Meteorological Information Center. We also calculated the maxima of daily maximum temperature (TXx) in spring (MAM) to represent the severity of this large-scale high-temperature event.The station anomalies were calculated by removing the 1961−90 means at each station, and the warm spring days were counted as the number of days with daily TASmax exceeding 25°C.
Different indices indicate that spring 2018 was the warmest at most weather stations across eastern China (see below). Thus, we focus on the region east of 105°E and investigate this event in eastern China. The station anomalies (relative to the 1961−90 average) in eastern China were then aggregated to produce gridded data with a 3° × 3° resolution by averaging all available data within each grid cell.The gridded results were subsequently used to compute the area-weighted regional mean anomalies.
NCEP−NCAR reanalysis data (Kalnay et al., 1996)were used to investigate the atmospheric circulation. The mean 500-hPa geopotential height and wind fields over East Asia averaged in the spring are illustrated in Fig. 1a. During the period 1961−90, the circulation pattern in spring over East Asia is mainly characterized by a zonal distribution. The northwesterly airflows on the western side of China in the mid−high latitudes transport cold air to the eastern parts of China, which is not favorable for the occurrence of warm extreme events. However, the spring mean anomalies of geopotential height and wind at 500 hPa (Fig.1d) in 2018 show that an anomalous anticyclonic center was located in the north side of China, which blocked the transport of cold air into eastern China. The northwesterly airflows from the high-latitude and cold regions were forced to largely bypass eastern China, which could have affected the unusually warm spring in 2018. A similar pattern with anomalous anticyclonic circulation controlling North China persisted for more than 30 days, which is very unusual compared with the climatological mean state. All these factors indicate that the anticyclonic circulation and northwesterly airflows on its western side can be selected as the key region to represent the role of atmospheric circulation, covering a rectangular box enclosing 40°−65°N and 85°−120°E (black boxes in Figs. 1d−f). To test the sensitivity of the selected region, we also extended the critical area [Fig. S1 in the electronic supplementary material (ESM)] and repeated the corresponding analyses.
2.2. Model simulations
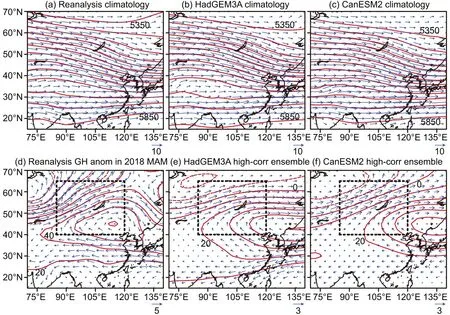
Fig. 1. Circulation patterns in spring (MAM): (a) 500-hPa height (red contours; units: gpm) and wind (blue vectors; units:m s−1) in East Asia during 1961−90 based on NCEP−NCAR reanalysis data; (d) geopotential height (red contours; units:gpm) and wind (blue vectors; m s−1) spring-mean anomalies (relative to 1961−90) at 500 hPa constructed with reanalysis data for 2018. (b, c) As in (a) but for the mean of the ALL simulations from HadGEM3A and CanESM2. (e, f) As in (d) but with the mean of spring seasons extracted from the HadGEM3A and CanESM2 results with the ALL experiment, for which the circulation pattern correlates well (coefficient > 0.6) with the 2018 reanalysis pattern over the region marked by the black box.
Two types of model simulations were used. One was the simulations from the Hadley Centre event attribution system (Christidis et al., 2013) built on the atmospheric model HadGEM3A. The other was the outputs of large-ensemble simulations conducted with CanESM2 (Arora et al., 2011).The Hadley Centre event attribution system now features the highest resolution global model used in attribution studies, with 85 vertical levels and N216 horizontal resolution(0.56° × 0.83°). Two ensembles were used here: one forced with combined anthropogenic and natural forcings (ALL)and the other by natural forcing only (NAT). In the ALL experiment, observed sea surface temperatures (SSTs) and sea-ice concentration (SIC) data (Rayner et al., 2003) were used as boundary conditions, while in the NAT experiment an estimate of the anthropogenic contributions in the SSTs derived from atmosphere−ocean coupled models (Stone,2013) was subtracted from the SST observational dataset and the sea ice was adjusted accordingly (Christidis et al.,2013). During the period 1960−2013, each ensemble of the ALL and NAT experiment comprised 15 simulations, and subsequently expanded to 105 and 525 simulations for 2014−15 and 2016−18. Since the simulations in 2014−15 are used for test experiments, the simulated results in 1960−2013 are used to conduct the model evaluation assessments and the extension experiment results in 2018 are used to estimate the human and circulation influences on the probability of 2018-like high-temperature events on the observed oceanic condition represented by the observed SSTs and SIC.
The CanESM2 is a coupled model that consists of four main components: an atmosphere model (CanAM4), an ocean model (CanOM4), an ocean carbon model (CMOC),and a terrestrial carbon model (CTEM). We used daily outputs of large-ensemble simulations that had 50-member runs and each driven by ALL forcings and NAT forcing for the period 1950−2004. From 2005 to 2020, the ALL simulations were forced with the RCP8.5 scenario, while the NAT simulations were forced with natural forcings by repeating the solar forcing during the last solar cycle and no volcanic eruptions (Fyfe et al., 2017). This assumption of the solar forcing may bring some small errors, as indicated by a reduction in total incident solar radiation forcing over 2001−10(Folland et al., 2018), but should not have an important impact on this study. Accordingly, changes in the probability of a 2018-like high-temperature event due to human and circulation influence can be evaluated without specific condi-tioning. For the definition of the current climate state for the year 2018 in CanESM2, the 10-year period of 1995−2004 in the model was considered to represent the current 2018 climate, as the global mean near-surface temperature (GMST)in model simulations increased by 1°C above the preindustrial level in this period (Sun et al., 2018a), the same as with the observed change of GMST in 2018. Therefore, the sample size in CanESM2 was 500 (50-member × 10-year),which is comparable to that (525) in HadGEM3A.
The model TAS and TASmax data were used to estimate the regional temperature average for MAM. Anomalies were calculated relative to the 1961−90 means and then interpolated to the same 3° × 3° grid as the observations. Prior to the calculation of the regional mean, the model results were masked according to the availability of the observations.Regional means were computed for individual simulations and then averaged over all available simulated results to obtain the ensemble mean. Similarly, the model geopotential height and wind fields in both the ALL and NAT experiments for 2018 were used to obtain the simulated circulation pattern in MAM. Anomalies were calculated first and then interpolated to the same resolution as the NCEP reanalysis data. Based on the monthly results, seasonal means were obtained to compare with the observed circulation pattern in spring 2018.
2.3. Detection methods
We followed the method developed by Christidis and Stott (2015). Firstly, samples of spring TAS, TASmax, and circulation situations were generated from the HadGEM3A extension experiment and CanESM2 1995−2004 simulations. They provided 525 and 500 simulated samples for spring 2018 respectively, in both the ALL and NAT forcing experiments. Next, we partitioned the model results in spring into two groups: one where the model simulations correlated well (correlation coefficients above 0.6) with the observed 2018 circulation patterns over the key region (as shown in Fig. 1d), and the other where the model simulations correlated poorly (correlation coefficients below 0.6)with observations. The ensemble information created by this grouping is illustrated in Table 1. Thus, we created high- and low-correlation ensembles with both the ALL and NAT forcings, which we later used to construct the TAS and TASmax distributions and obtain probability estimates for extreme events. Figures 1e and f display the 500-hPa circulation pattern averaged over the spring months that correspond to the mean of the high-correlation ensemble from the ALL experiment. It shows distinct anomalous anticyclonic circulation located on the north side of China and the climatological northwesterly flow is forced to bypass eastern China,similar to the characteristic pattern of 2018. We then compared the temperature distributions with strong and weak correlations to the 2018 general circulation pattern in the “real world”—that is, under the influence of ALL forcings—to assess the circulation effect. Furthermore, we changed the threshold value of the correlation coefficient to test the sensitivity, and found that similar detection results could beobtained (Fig. S2 in the ESM), suggesting little influence of the threshold selection. We also compared the temperature distributions with ALL and NAT forcing simulations to evaluate the anthropogenic influence.

Table 1. Number of estimates of MAM TAS/TASmax from simulated spring seasons in 2018 from HadGEM3A and CanESM2. The table gives the total number of spring seasons as well as the cases with high and low correlations to the 2018 circulation in experiments forced by combined anthropogenic and natural forcings (ALL) and natural forcing only (NAT).
The probabilities of exceeding the threshold were computed using the Generalized Pareto Distribution if the threshold lay at the tails. Changes in the likelihood are represented as the ratio of the probabilities of extreme temperature: (1) for springs with high and low correlation circulation patterns relative to the spring of 2018, and (2) with and without the effect of anthropogenic influence. Uncertainties in the probability estimates were obtained using a Monte Carlo bootstrap procedure (Christidis et al., 2013). For example, to investigate the effect of anthropogenic influence, we calculated the probabilities of exceeding the extreme temperature threshold based on the ALL and NAT ensembles (PALLand PNAT) and obtained the ratio PALL/PNAT. We then resampled the simulated temperature estimates of these two ensembles to obtain a new estimate of the probability ratio and repeated the bootstrap procedure 1000 times. This provided 1000 estimates of PALL/PNATfrom which we could quantify the 5%−95% uncertainty range.The same procedure was applied to the high- and low-correlation ensembles to study the influence of the anomalous atmospheric circulation in 2018.
3. Results
Figure 2 shows the spatial distributions of the TAS anomalies and TXx in spring 2018. Positive anomalies are observed in most areas of China, especially in eastern China. The spring mean temperature at 988 stations was recorded as the highest since 1951 and the number of warm spring days in eastern China ranked the highest in the observational record (Fig. S3 in the ESM). Additionally, the daily maximum temperatures at 900 stations are higher than 35°C, with the maximum value 41.7°C observed in Zhejiang Province (Fig. S3b). Tropical nights (daily minimum temperature > 25°C) appeared in May for the first time at 62 stations over eastern China since meteorological observations began in the early 1950s (Fig. S3). All these results indicate that the warmest spring in eastern China appeared in 2018.
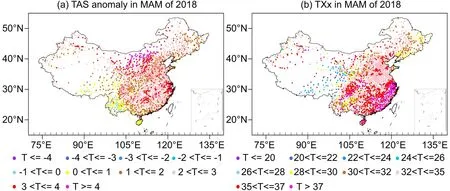
Fig. 2. Maps of the (a) TAS anomalies (relative to the 1961−90 average; unit: °C) and (b) TXx (unit: °C) in 2018 spring (MAM) based on data from the 2419 observation stations.
Model evaluation is an essential process of attribution research, helping to determine whether the models used in the analysis are able to reproduce the observed changes.Here, we first compare the climatological 500-hPa geopotential height and wind fields in the East Asian region averaged over MAM and estimated with NCEP reanalysis data(Fig. 1a) and model-simulated results (Figs. 1b and c). The ensemble mean of the simulations with all forcings reproduces a very similar circulation pattern over the climatological period, 1961−90. Subsequently, we compare the probability density functions (PDFs) of the spring TAS and TAS-max anomalies in eastern China over the period 1960−2013(Figs. 3a and b). Although 54 years of temperature values cannot adequately describe the details of the distributions (like their tails), the histograms established by the observations still illustrate a general representation of their shape and spread. The model with ALL forcing provides more data because of the multiple simulations in each ensemble (e.g.,from the 15 members of HadGEM3A, there are 15 × 54 years = 810 temperature values per experiment). The two models produce similar PDFs for both TAS and TASmax(blue and pink contours in Figs. 3a and b), though there are also some small discrepancies. We further perform a twosided Kolmogorov−Smirnov test to assess whether the observed distributions are significantly different from the distributions of the model simulation, and find no significant differences (p values greater than 0.3). Finally, we perform power spectra analyses (Christidis et al., 2015) to examine whether the model simulations provide reasonable variability estimates. We calculate power spectra from the eastern China spring TAS and TASmax time series during 1960−2013 using both the observations and simulations of the ALL and NAT experiments (Figs. 3c−f). The observed results are found to generally lie within the range of the power spectra from the ALL simulations at most time scales examined, suggesting that the simulated variability in TAS and TASmax are consistent with those of the observations.Although there are also a few exceptions, which is that the model appears to provide more variability for the temperature at the interdecadal time scale, the level of agreement between the observed and model-simulated variability is deemed sufficient for the attribution analyses in this study.
Figure 4 shows the temporal evolution and linear trends of the spring TAS and TASmax anomalies averaged over eastern China based on the observations and simulations. The observed spring TAS in 2018 in eastern China is 2.5°C higher than the 1961−90 mean, with the number of warm spring days ranking the record highest (approximately nine days more than the climatological mean). The simulated ensemble-mean TAS and TASmax under ALL forcing agree well with the observations. It shows an apparent increase after the late 1980s but displays less variability and magnitude because of the averaging. The observed TAS and TASmax generally lie within the range of the model runs for the ALL experiments for both HadGEM3A and CanESM2. The TAS in CanESM2 shows a quite large trend and is closer to the observed change than that in HadGEM3A (Figs. 4b and e). Over 1961−2013, the springmean TAS increases by 1.4°C (53 yr)−1[90% confidence interval: 0.8°C (53 yr)−1−2°C (53 yr)−1] averaged over eastern China. For CanESM2, the ensemble-mean trend is 1.38°C (53 yr)−1[model spread: 1.18°C (53 yr)−1−1.58°C(53 yr)−1], and it is 0.91°C (53 yr)−1[model spread: 0.61°C(53 yr)−1−1.21°C (53 yr)−1] for HadGEM3A. The TAS and TASmax in the NAT experiments show much smaller trends compared with the observations. This indicates that both models have ability in reproducing the observed changes of spring temperature in eastern China.
We then compare the model-simulated PDF distributions of temperature from the high- and low-correlation groups under ALL forcings (Figs. 5a and c). Both Had-GEM3A and CanESM2 show that the anomalous circulation over East Asia increases the chance of high temperature, as the distributions of temperature in the high-correlation group shift towards a hotter regime compared with the low-correlation group. The Kolmogorov−Smirnov test results show that the distributions from the high- and low-correlation groups are significantly separated, as the p-values are near zero. We then quantify how differences in the circulation pattern may affect the likelihood of an extreme event similar to that of spring 2018. We calculate the probabilities of the event exceeding the observed threshold of TAS and TAS-max in 2018 (black lines in Fig. 5) based on the Generalized Pareto Distribution. Figure 5e shows that in spring seasons with circulation patterns similar to 2018, the occurrence probability of a 2018-like high-temperature event increases by about two times for both TAS and TASmax.For the TAS, in the HadGEM3A simulations, the probability of a 2018-like event in the low-correlation ensemble is 0.111 (90% confidence interval: 0.009−0.123), while in the high-correlation ensemble the probability increases to 0.239(90% confidence interval: 0.148−0.266). This gives a risk ratio of 2.15 (90% confidence interval: 1.22−2.91). In the CanESM2 simulations, the probability of a 2018-like event is 0.081 (90% confidence interval: 0.062−0.123) in the lowcorrelation ensemble, and it becomes 0.148 (90% confidence interval: 0.111−0.189) in the high-correlation ensemble, resulting in a risk ratio of 1.83 (90% confidence interval: 1.14−2.54). For the TASmax, the quantitative results of circulation effects are similar. The effects on TAS and TASmax are very similar in both models, which indicates a clear influence from the persistent flow pattern on the temperature over the whole season. Further analyses indicate that these attribution results are insensitive to the selection of the critical area if the size of the area does not change much (Fig. S4 in the ESM).
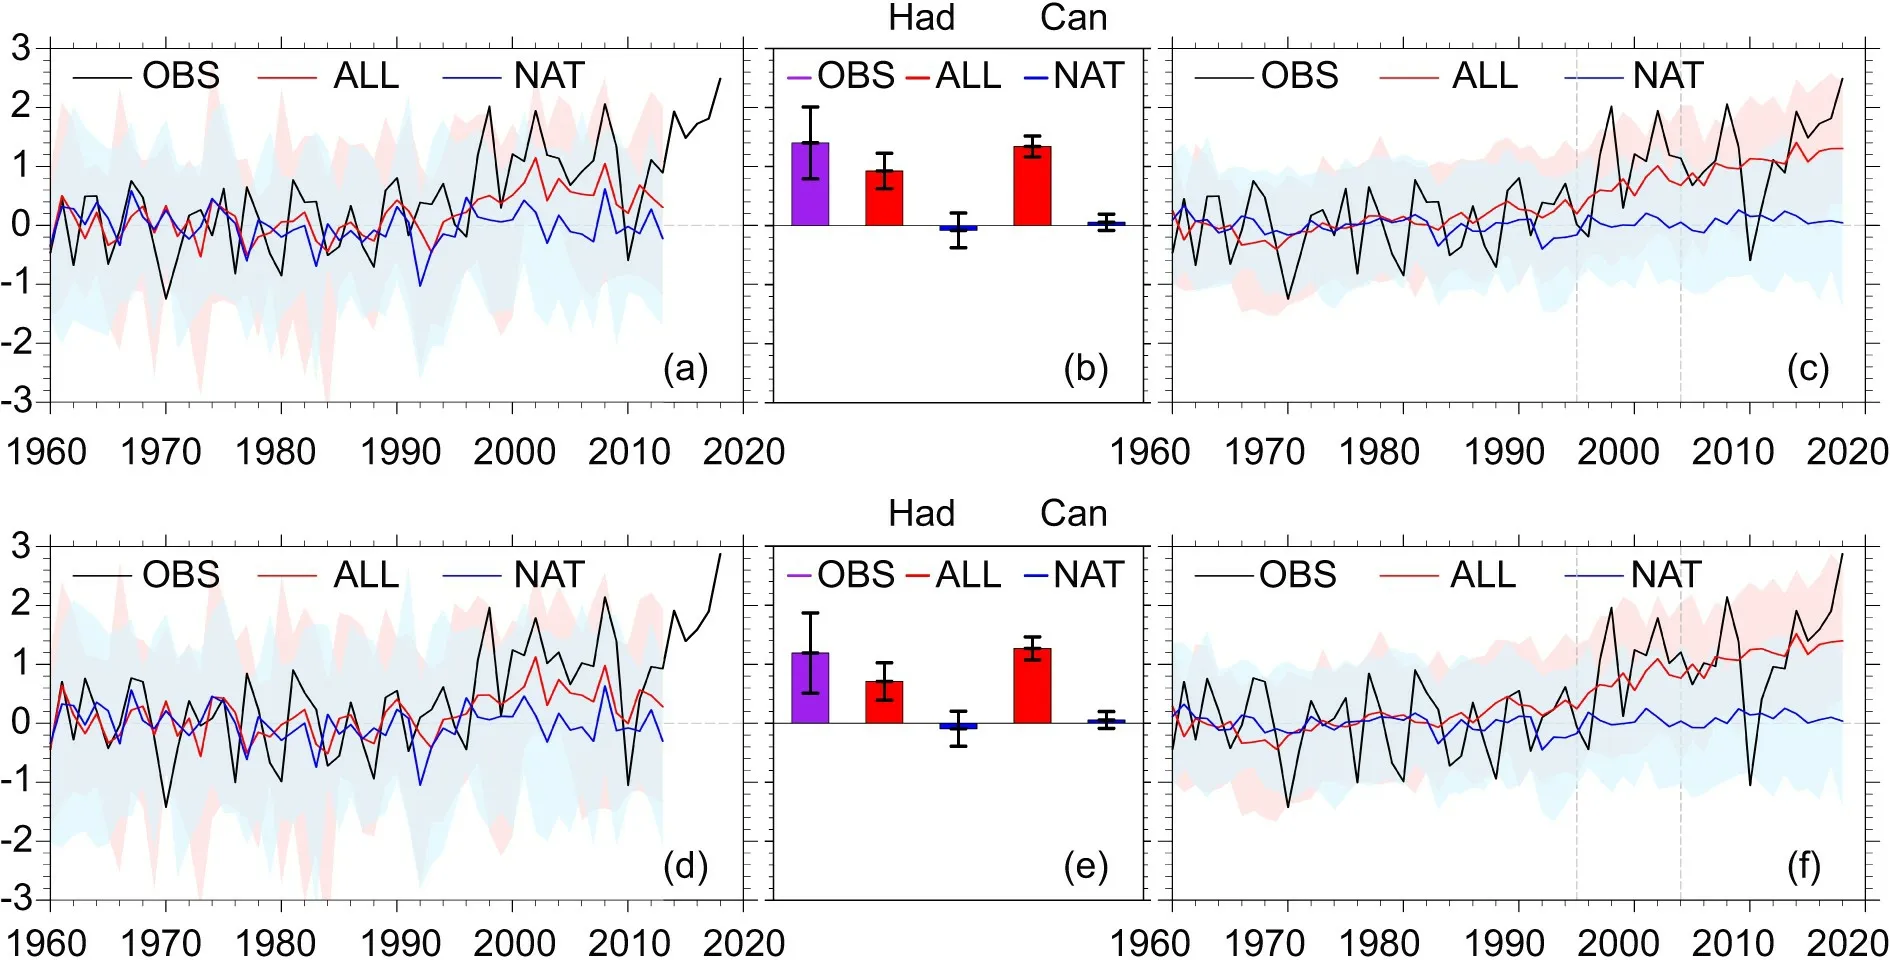
Fig. 4. Left- and right-hand panels show time series of the regional MAM TAS (a, c) and TASmax (d, f) anomalies (relative to the 1961−90 mean; unit: °C) in eastern China for the observations (black) and multimodel simulations under ALL (red)and NAT forcings (blue) from HadGEM3A and CanESM2, respectively. Shading shows the 5%−95% ranges of the individual model simulations. Middle panels show their long-term trends and the black error bars indicate the 95%confidence intervals of the linear trends.
Figures 5b, d and f illustrate the effects of anthropogenic activities on this warmest spring in eastern China. The distributions of TAS and TASmax under ALL and NAT forcings exhibit notable differences. The distribution shifts to the right towards a hotter regime from the NAT to ALL experiments, which indicates a clear human influence on the chance of high temperature extremes. The ratios of PALL/PNATand corresponding uncertainty ranges for TAS and TASmax are shown in Fig. 5f. In the HadGEM3A simulations, the probability of a 2018-like TAS in the NAT experiments is 0.0015 (90% confidence interval: 0.0007−0.0035),while in the ALL experiments the probability increases to 0.018 (90% confidence interval: 0.0091−0.025). Similarly,the anthropogenic effects increases the probability of a 2018-like TASmax from 0.0019 (90% confidence interval:0.0016−0.0022) to 0.0147 (90% confidence interval:0.0073−0.0233). In the CanESM2 simulations, similar conclusions can be obtained: the probability for TAS in the ALL ensemble is 0.005 (90% confidence interval: 0.003−0.008)and it is 0.0005 (90% confidence interval: 0.0002−0.0007)under NAT forcing, resulting in a risk ratio of 9.7 (90% confidence interval: 4.1−23.2). Based on the above results, we can estimate that human-induced climate change increases the likelihood of a 2018-like warm spring by about 10 times. All the above quantitative analyses show that the human-induced climate change and anomalous atmospheric circulation in North China both affected the extreme spring event in 2018 in eastern China, but the anthropogenic influence made a stronger contribution.
In order to test the sensitivity of above analyses, we use the HadGEM3A simulation to compare the TAS distributions with high and low correlation to the 2018 circulation pattern under the influence of ALL and NAT forcing, respectively (Fig. S5a and c in the ESM). It is found that, for both the high- and low-correlation ensembles, the NAT distributions are located in a colder regime. Under NAT forcings only, the probability of a 2018-like event is much smaller in the high-correlation ensemble than that under ALL forcings.Similarly, comparisons of the distribution with ALL and NAT forcing under similar or different synoptic conditions to spring 2018 are shown in Figs. S5b and d. The results indicate that, when considering the effects of human activity and circulation simultaneously, the probability of an extremely warm spring increases significantly. A similar conclusion was reached from the sensitivity analysis using the CanESM2 simulations (Fig. S6 in the ESM).
4. Conclusions and discussion
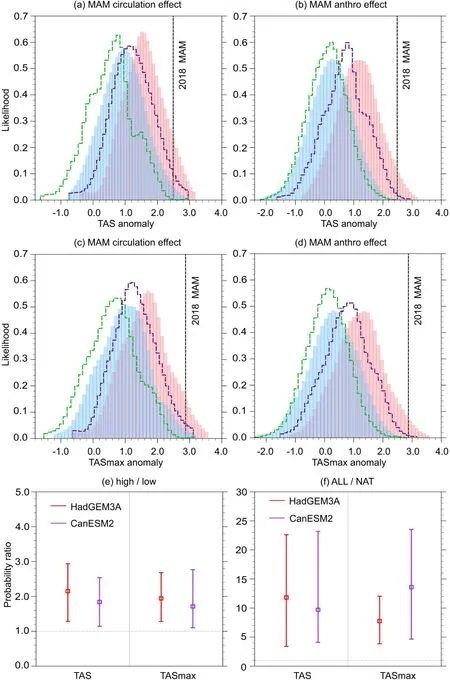
Fig. 5. Impact of the 2018 spring circulation pattern and anthropogenic forcings on MAM TAS and TASmax anomalies. Panels (a, c) illustrate the MAM TAS and TASmax anomalies distributions in HadGEM3A (red bars: high-correlation ensemble; blue bars: low-correlation ensemble) and CanESM2 (purple contours: high-correlation ensemble; green contours: low-correlation ensemble)results based on simulated spring seasons. Panels (b, d) illustrate the MAM TAS and TASmax anomaly distributions but from model experiments with (red bars: HadGEM3A ALL; purple contours: CanESM2 ALL) and without anthropogenic forcings (blue bars: HadGEM3A NAT; green contours: CanESM2 NAT). Panel (e) shows the change in the likelihood of occurrence of extreme events under the influence of a circulation flow similar to that in spring 2018. Panel (f) shows the change in the likelihood due to anthropogenic forcings. Best estimates of the change in the likelihood are marked by the square symbols and the 5%−95% uncertainty range by the vertical whiskers.
In the spring of 2018, an unusually extreme warm temper-ature event was observed in eastern China. Previous studies have shown that the anthropogenic influence has increased the probability of extreme high temperature events in spring and summer in different areas of China. Few studies have focused on the combined effects from both anthropogenic activities and atmospheric circulation. Here, we investigated the effects of these two factors and found that the human influence and anomalous circulation over East Asia have increased the probability of an extreme warm event like that in spring 2018. Quantitative analyses indicate that anthropogenically forced climate change increases the probability of a 2018-like warm spring in eastern China by a factor of 10. Meanwhile, the characteristic circulation pattern of 2018 increases the probability of such an event by a factor of 2, which is weaker than the human influence. Our results suggest that persistent anomalous circulation and humaninduced climate change both increase the probability of occurrence of such a warm temperature event. As anthropogenic influences on the climate continue, the likelihood of extremely warm spring seasons will continue to increase and the likelihood of extremes will be particularly high when a persistent anticyclonic circulation occurs.
A coupled-model, CanESM2, was also employed in this study, and similar quantitative contributions of the anthropogenic influences and anomalous anticyclonic circulation were obtained. This further increases our confidence in the robustness of the attribution results. These two models employ a very different framing and the main impacts concentrate on the NAT boundary conditions, while in the ALL experiment the SST influences are actually small (Christidis et al., 2018; Ciavarella et al., 2018). For this 2018 event, attribution results from these two model types are relatively similar, which may be due to small influences of the oceanic variability in that year. Another recent work also supports this: Sun et al. (2020) investigated the extreme warm spring of 2018 in northeastern Asia, close to eastern China,and indicated the influences of human-induced climate change based on two model types, but without analyses of the circulation effects. Our results provide a more comprehensive viewpoint of this type of extreme event.
Acknowledgements.C. H. LU was supported by the National Key Research and Development Program of China (Grant No. 2018YFC1507702) and the National Natural Science Foundation of China (Grant No. 41775082). Y. SUN was supported by the National Key Research and Development Program of China (Grant No. 2016YFA0600701) and the National Natural Science Foundation of China (Grant No. 41790471). N. CHRISTIDIS and P. A.STOTT were supported by the Met Office Hadley Centre Climate Programme funded by BEIS, Defra, and the UK−China Research and Innovation Partnership Fund through the Met Office Climate Science for Service Partnership (CSSP) China as part of the Newton Fund, China.
Electronic supplementary material:Supplementary material is available in the online version of this article at https://doi.org/10.1007/s00376-020-0088-5.
杂志排行
Advances in Atmospheric Sciences的其它文章
- Combined Impacts of Warm Central Equatorial Pacific Sea Surface Temperatures and Anthropogenic Warming on the 2019 Severe Drought in East China
- Application and Characteristic Analysis of the Moist Singular Vector in GRAPES-GEPS
- Upper- and Lower-tropospheric Circulation Anomalies Associated with Interannual Variation of Pakistan Rainfall during Summer
- Bias Correction and Ensemble Projections of Temperature Changes over Ten Subregions in CORDEX East Asia
- Establishment of an Objective Standard for the Definition of Binary Tropical Cyclones in the Western North Pacific
- Characteristics of Fengyun-4A Satellite Atmospheric Motion Vectors and Their Impacts on Data Assimilation
