Study of Factors Influencing China-ASEAN Agricultural Product Trade Development in the Context of "the Belt and Road"
2020-09-28YanyuYUEDongdiXIE
Yanyu YUE, Dongdi XIE
1.School of Economics and Management, East China Jiatong University, Nanchang 330013, China; 2. Hezhou University, Hezhou 542800, China
Abstract This paper reviewed and analyzed the current situations and influencing factors of the bilateral agricultural product trade development in China-ASEAN Free Trade Area (CAFTA), which has important practical significance for promoting the in-depth development of the free trade area and has guiding significance for precise policy implementation. Based on the status of import and export trade of agricultural products in CAFTA from 2013 to 2017, it constructed a trade gravity model. With the aid of Stata 14.0 software, it explored major factors influencing the development of bilateral agricultural trade from the total amount of agricultural products import and export and Commodity Indexes for the Standard International Trade Classification, Revision 3 (SITC Rev.3) agricultural product classification data. The empirical regression results show that the GDP of ASEAN countries, the ratio of agricultural added value to GDP, and the per capita gross national income (GNI) measured based on the purchasing power parity (PPP) exchange rate have the greatest impact on agricultural product trade in CAFTA in the context of "the Belt and Road" (B&D). Based on empirical research, it came up with recommendations including adjusting the import and export structure of agricultural products, enhancing product competitive advantages, and implementing diversified markets.
Key words The Belt and Road (B&D), China-ASEAN, Agricultural product trade, Influencing factors, Trade gravity model
1 Introduction
In the context of the continuous deepening of "the Belt and Road" (B&R) strategy, as the free trade area of developing countries with the largest economic aggregate in the world, the China-ASEAN Free Trade Area (CAFTA) is a community of interests, a community of destiny and a community of responsibility for economic development, it shares the benefits of jointly building the Silk Road Economic Belt and the 21st Century Maritime Silk Road. Strengthening agricultural product trade exchanges is an important part of bilateral cooperation. Agricultural products of ASEAN countries have greatly expanded and enriched the catalog of China’s agricultural product category, and have met the needs of the ever-expanding consumer market.
As a large developing country producing and consuming agricultural products with a population of 1.4 billion, China may not only be adversely affected by the international market, but also will exert a huge impact on the international market. We reviewed and analyzed the current situations and influencing factors of the bilateral agricultural product trade development in China-ASEAN Free Trade Area (CAFTA), which has important practical significance for promoting the in-depth development of the free trade area and has guiding significance for precise policy implementation. Through selecting several factors that may influence the agricultural product trade in CAFTA in the context of B&R, we constructed an expanded trade gravity model. Then, we made an empirical regression analysis on the total import and export data of agricultural products in CAFTA and the import and export data of each agricultural product category.
2 Research methods
(i) Qualitative analysis method. By inducing, synthesizing, and summarizing the data of agricultural product trade in CAFTA from 2013 to 2017, we made a descriptive analysis on the situation of agricultural product trade in CAFTA in the context of the B&R. (ii) Empirical analysis method. We first constructed related theoretical models. Then, with the aid of Stata 14.0, we analyzed the collected data of agricultural product trade in CAFTA and the import and export data of each category.
3 Analysis on situation of agricultural product trade in CAFTA
3.1 Import trade of agricultural products in CAFTAWith the deepening of the B&R, the scale of agricultural imports is constantly expanding. As indicated in Table 1, China’s total import trade of agricultural products with ASEAN increased from 14 840.889 million USD in 2013 to 16 143.059 million USD in 2017, with an average annual growth rate of 2.12%. From 2013 to 2014, China’s total imports of agricultural products from ASEAN increased by 8.03%. From 2014 to 2016, China’s total imports of agricultural products from ASEAN have been declining, but in 2017 it rebounded rapidly and surpassed the previous four years. Total imports have increased, but the proportion to total agricultural product imports has decreased, indicating a faster rate of increase in China’s total imports of agricultural products. The proportion of China’s total imports of agricultural products from ASEAN to GDP showed a slight fluctuation over the past five years, with an overall downward trend.
From the perspective of China’s agricultural product importers, from 2013 to 2017, there was a trend of first increase, then decrease, and then increase. As shown in Table 2, Thailand has been the largest agricultural product importer of China from 2013 to 2016; Indonesia followed closely and in 2017, it surpassed Thailand to become the largest agricultural product importer of China in ASEAN; Malaysia and Vietnam also took up important position. Thailand, Indonesia, Malaysia, and Vietnam have always been China’s top four importers for agricultural products from ASEAN. According to the statistical results of China’s agricultural product importers, it can be found that the major agricultural products importers of China have a large agricultural area, such as Thailand (43%), Indonesia (31%), Malaysia (26%), Vietnam (39%) (data were collected from World Development Indicators database of the World Bank). The geographical and climatic environment of ASEAN countries are quite different from that of China, and their agricultural products are complementary to Chinese agricultural products, which greatly expands and enriches the types of agricultural products in China and meets the needs of the ever-expanding consumer market.

Table 1 Growth of China’s agricultural product imports from ASEAN in 2013-2017

Table 2 China’s agricultural product imports from ASEAN countries in 2013-2017 (unit: 104 USD)
3.2 Export trade of agricultural products in CAFTAAs indicated in Table 3, China’s total export of agricultural products to ASEAN increased from 11 887.372 million USD in 2013 to 15 837.138 million USD in 2017, with an average annual growth rate of 7.44%. From 2013 to 2014, China’s total exports of agricultural products to ASEAN accounted for a slightly lower proportion of total exports of agricultural products. After the implementation of the
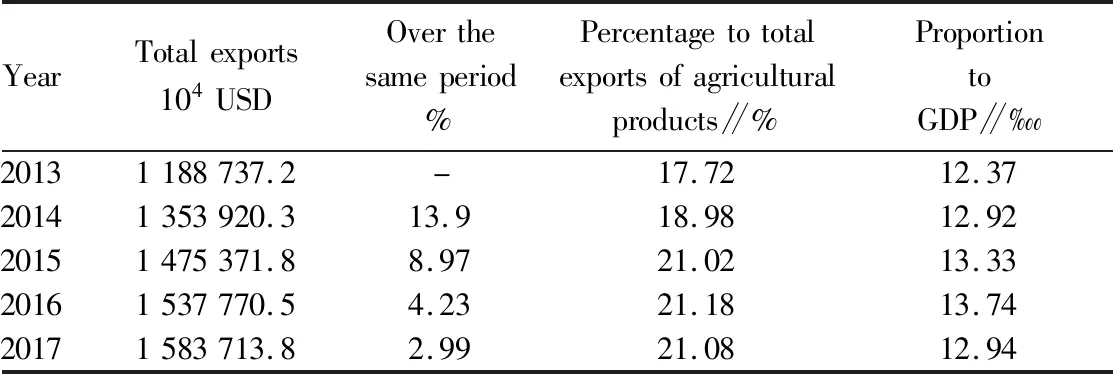
Table 3 Growth of China’s agricultural product exports to ASEAN in 2013-2017
"Belt and Road" strategy in 2015, the proportion increased, and it has kept around 21% for three years. During the four years from 2013 to 2016, the proportion of China’s total exports of agricultural products to ASEAN to GDP increased. But it dropped in 2017.
In these five years (2013-2017), no major changes have taken place in China’s agricultural product exporters. Table 4 indicates that Vietnam has always been China’s major exporter of agricultural products. Since 2016, Vietnam has surpassed Thailand to become China’s largest exporter of agricultural products. Malaysia, Indonesia and the Philippines are also China’s major exporters of agricultural products. Vietnam, Thailand, Malaysia, Indonesia, and Philippines have always been China’s top five agricultural product exporters to ASEAN. From Table 4, it can be seen that the main exporters of agricultural products are the same as the importers in CAFTA.

Table 4 China’s agricultural product exports to ASEAN countries in 2013-2017 (unit: 104 USD)
From the statistical results of China-ASEAN agricultural product export trade, it can be concluded that China’s agricultural products are mainly exported to countries closer to China. For example, both Thailand and Vietnam are ASEAN countries that are relatively close to China. Short distance means that transportation costs are lower and information exchanges are smoother, which is not only favorable for commodity trade, but also favorable for exporting China’s agricultural products to these countries and regions. In addition, Malaysia, Indonesia, and the Philippines are all island countries, which are short of resources and need to import large volume of agricultural products from China.
3.3 Trade deficit of agricultural products in CAFTAThe import and export trade and trade deficit of agricultural products in CAFTA in 2013-2017 were shown in Fig.1. In 2013-2017, China-ASEAN agricultural product import and export trade was generally in a state of trade deficit. But in 2016, it was in a state of trade surplus of -877.395 million USD, which was caused by the ever-expanding demand of consumer market. China is a large developing country. Long-term "excess of exports" may not be beneficial to China, and proper "excess of imports" may not be harmful to China. According to the practical experience of China’s long-term economic development, the economic growth is faster in the years when the deficit or surplus is small. Therefore, it is required to take the balance of international payment as the objective in the foreign trade.
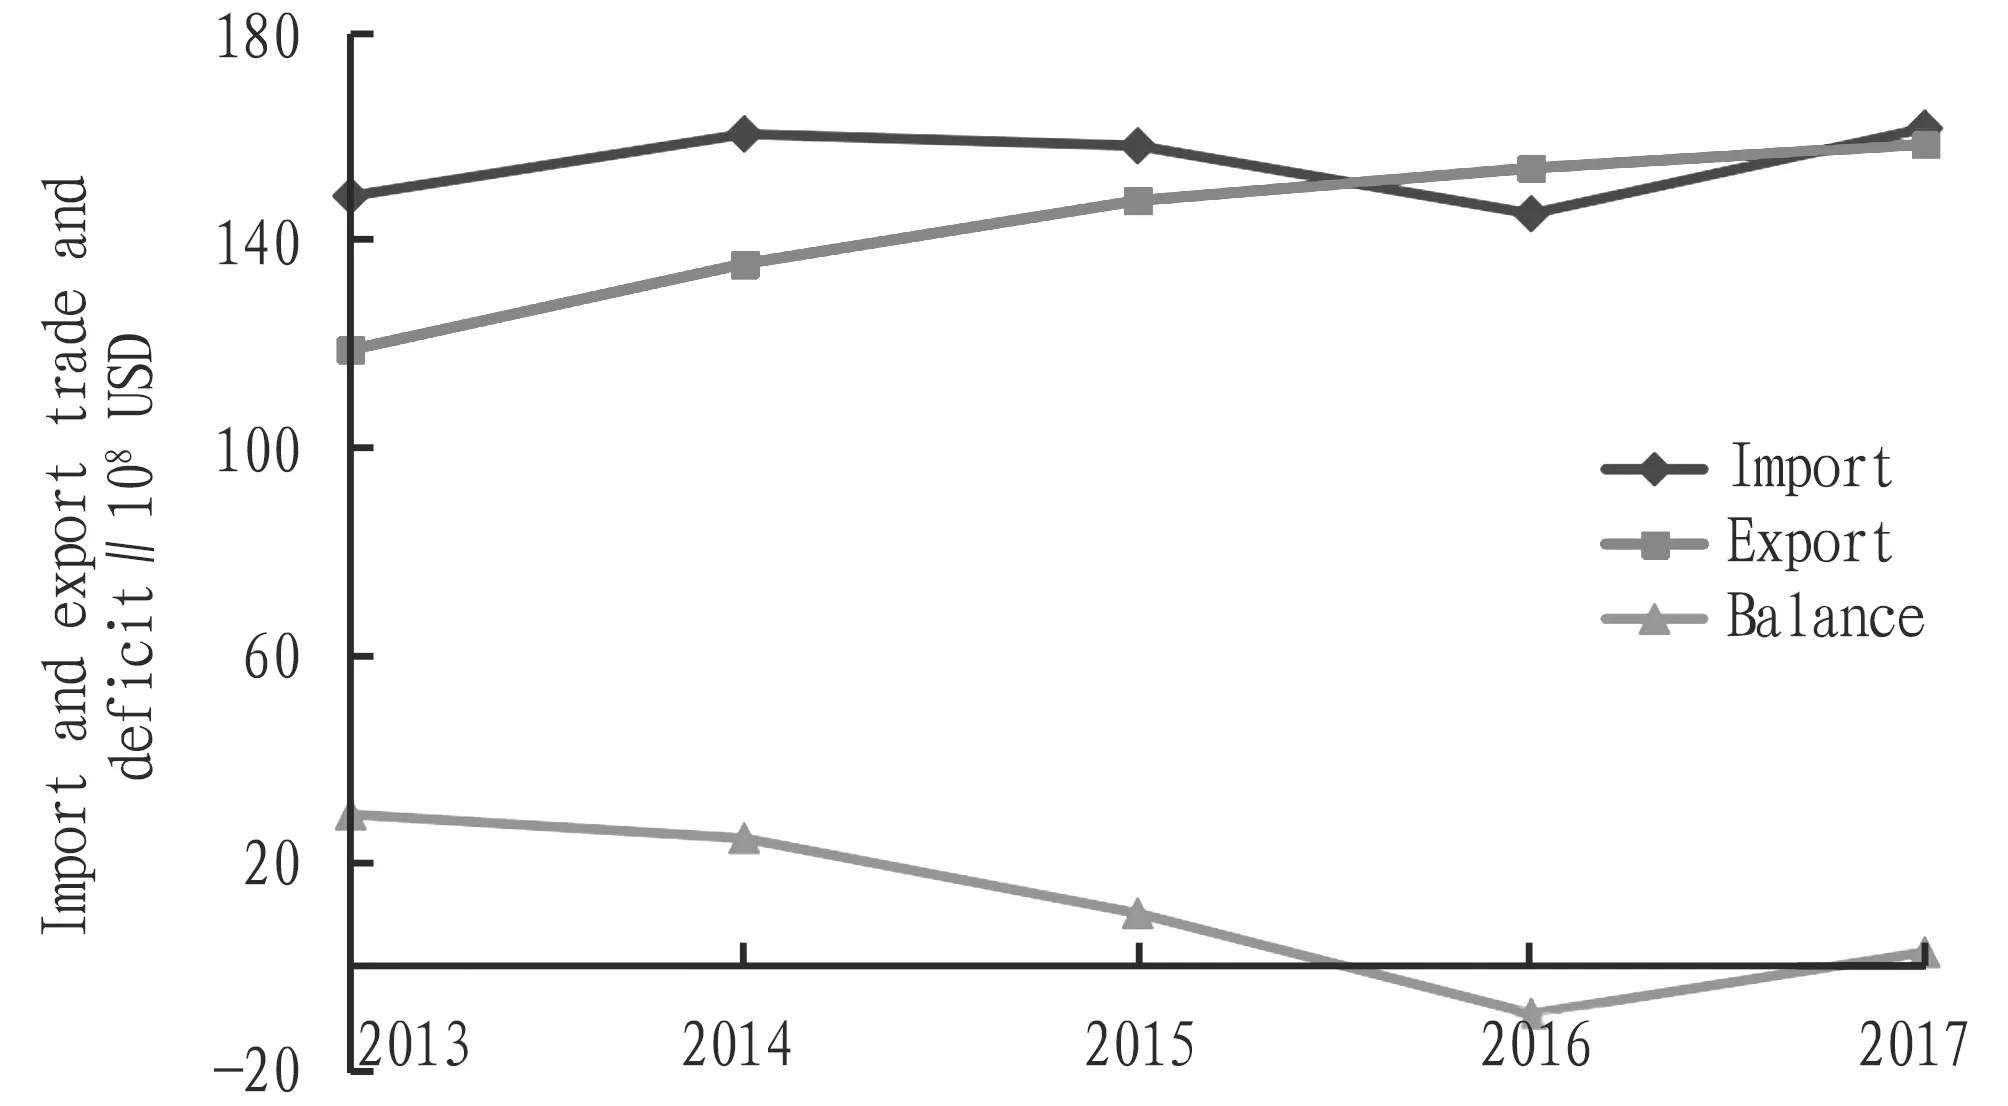
Fig. 1 Trade deficit analysis of China-ASEAN agricultural products in 2013-2017
4 Trade gravity model analysis and sample data sources
4.1 Building of trade gravity model and explanation of variablesDifferent from the development of general theory, Gravity Model first has evidence and then forms theory. The concept of the gravity model originated from the "law of universal gravitation" proposed by Newton in 1687, that is, any particle of matter in the universe attracts any other with a force varying directly as the product of the masses and inversely as the square of the distance between them[1].
The most basic trade gravity (TG) model:Tij=A(GDPi×GDPj)/Dij, whereXijdenotes the import and export trade volume between the countryiandj,GDPiandGDPjdenote the economic aggregate of countryiandj, andDijdenotes the geographical distance between the countryiandj[1-2]. Usually, the research will use the logarithmic form of the trade gravity model, because the logarithmic form can convert the nonlinear variable relationship into a linear relationship, which is more convenient for parameter estimation; at the same time, it is helpful to reduce the abnormal point phenomenon in the data and remove the heteroscedasticity[3]. After the logarithmic conversion, we can obtain:
lnTij=β0+β1lnGDPi+β2lnGDPj+β3lnDij+μijt.
In the present economy, the factors that affect bilateral trade are more and more complex, and new variables need to be continuously introduced to make the model analysis more accurate[4-5]. The progress and update of the theory of trade gravity model develop the international trade theory and provide a more solid theoretical basis for the study of factors influencing regional and international trade.
On the basis of the basic trade gravity model, we built an extended trade gravity model to study the factors influencing China’s trade in agricultural products with ASEAN countries. The extended trade gravity model is based on panel data:
lnTcit=β0+β1lnGDPit+β2lnGDPct+β3lnDic+β4lnTOit+β5lnAGDict+β6lnAGRit+β7lnGNIit+β8CB+μict
(1)
whereTcitdenotes the total import and export of agricultural products between China and the countryiin the periodt;GDPitandGDPctdenote the GDP of the countryiand China in the yeart;Dicdenote the straight-line geographic distance between the countryiand China (in this paper, the distance between Nanning of Guangxi Zhuang Autonomous Region and the capitals of ASEAN countries was taken);TOitrefers to the countryi’s dependence on foreign trade (also known as trade openness) in the periodt;AGDictrepresents the absolute value of the difference between the per capita GDP of countryiand China in the periodt;AGRitstands for the ratio of agricultural added value of the countryito its GDP in the periodt;GNIitmeans per capita gross national income of the countryiin the periodt;CBstands for common border and it is a dummy variable.β0is the constant term;β1toβ8are parameters to be estimated;μictis the stochastic error term.
The names, expressions, meanings, expectations and theoretical meanings of the explanatory variables[6]in the above TG model are shown in Table 5.

Table 5 Meanings, theoretical explanations and expectations of explanatory variables
4.2 Sample selection and data sourceThe agricultural products were classified into four categories in accordance withCommodityIndexesfortheStandardInternationalTradeClassification,Revision3(SITC Rev.3): category 0: food and animal; category 1: beverage and tobacco; category 2: non-edible raw materials, except fuels, and category 4: animal and vegetable oils, fats and waxes[7-8]. The data of agricultural product import and export trade between China and ASEAN countries were from Department of Foreign Trade, Ministry of Commerce of the People’s Republic of China. The data of agricultural product import and export trade based on classification of SITC Rev.3 were from UN Commodity Trade Statistics Database (UN Comtrade). GDP, ratio of agricultural added value to GDP (AGR), the per capita GNI measured based on PPP exchange rate were from World Development Indicators (WDI) database of the World Bank. The dependence on foreign trade (trade openness) and the absolute value of the difference in GDP between China and ASEAN countries were calculated based on the above related data. The straight-line geographic distance between Nanning of Guangxi Zhuang Autonomous Region and the capitals of ASEAN countries were calculated according to latitude and longitude, while the data of common border between China and ASEAN countries were determined according to the map of the People’s Republic of China.
5 Empirical analysis of factors influencing agricultural product trade in the context of "the Belt and Road"
5.1 Panel data unit root test and Hausman testBefore the panel data analysis, the data required for analysis must be stationary time series data. In this study, we adopted LLC test for the same-root panel hypothesis to perform unit root test on each variable to make the results have strong robustness and persuasiveness. With the aid of STATA 14.0, we can obtain results of Table 6. Since the data volume of category 1 and category 4 was small, we combine them together as the same category. From the above LLC test, it can be seen that, exceptGDPiis not stationary, and lnGNIiis stationary after the first-order difference, other variables are stationary in the horizontal state.

Table 6 Results of LLC unit root test
Before performing panel data regression, we carried outFtest and Hausman test on the data. TheF-test value is 204.77,P=0.000, rejecting the null hypothesis, so the model is biased towards selecting individual fixed effects. The Hausmann test value is 3.72,P=0.155 6, accepting the null hypothesis. Therefore, it is estimated that the most suitable model equation (1) is Hausmann test.
5.2 Empirical analysis of total trade volume of agricultural productsBased on the panel unit root test results, Hausman test results and the constructed extended trade gravity model equation (1), using the time series from 2013 to 2017, we calculated the cross-seciontal data of total trade volume of agricultural products between China and ASEAN in terms of total import and export, simulated in the measurement software Stata 14.0, and performed regression analysis on the gravity model containing 8 explanatory variables using the random effect model. The regression results excluding insignificant variables are listed in Table 7.
As shown in Table 7, in terms of China’s total imports and exports to ASEAN, bothGDPiandGDPcare significantly positively correlated with dependent variables.GDPiis significant at the 1% significance level, whileGDPcis significant at the 5% significance level. The coefficient ofGDPiis 0.234 4, indicating that for every 1% increase in the economic scale of ASEAN countries, the total bilateral agricultural product trade will increase by 0.463%. The results show that economic scale is one of the most important factors influencing China-ASEAN bilateral agricultural product trade. The flow of bilateral agricultural product trade will increase significantly with the expansion the economies of all countries.Dicis negatively correlated with the dependent variable, which is significant at the 10% significance level. Due to the higher requirements for the transportation of agricultural products, the greater the distance and the higher the cost, and trade flows are restricted. The import and export volume of China-ASEAN agricultural products shows a negative correlation with the degree of trade dependence. In terms of the ratio of agricultural added value to GDP and per capita GNI measured based on PPP exchange rate, both the ratio of imports and exports to agricultural added value and per capita national income show a significant negative correlation, which is significant at the 1% significance level. The regression results of the random effect model of the above gravity model show thatGDPi, the ratio of agricultural added value to GDP, and the per capita gross national income (GNI) measured based on the purchasing power parity (PPP) exchange rate have a large impact on agricultural product trade in CAFTA in the context of "the Belt and Road".
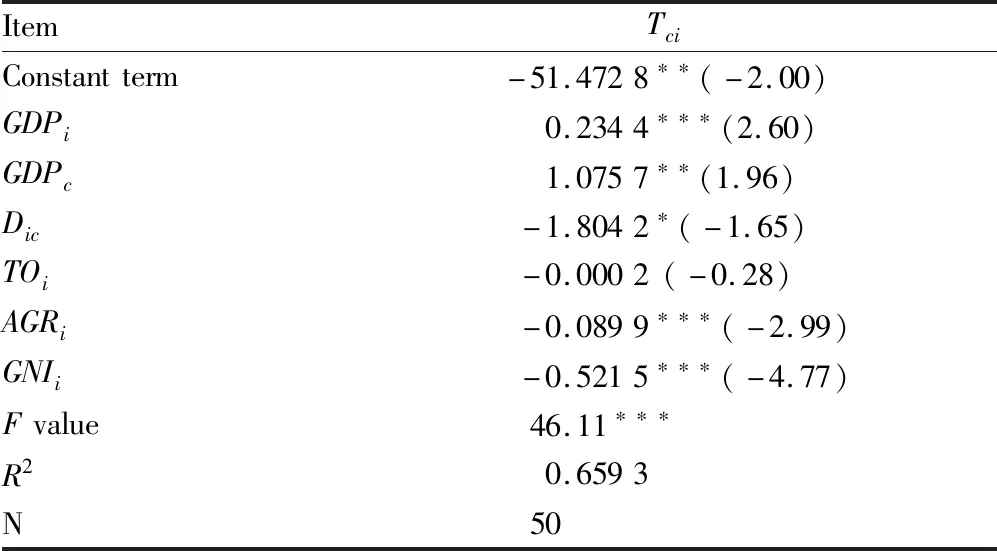
Table 7 Regression analysis results of random effect model
5.3 Empirical analysis of classification of agricultural productsDue to the differences in the import and export trade of classification of agricultural products between China and ASEAN countries, when studying the influencing factors of agricultural products trade between China and ASEAN countries, on the basis of equation (1), we built the gravity equation of agricultural product trade import volume and export volume, and then performed empirical analysis on the factors influencing the import trade and export trade of main agricultural products.
The gravity equation of agricultural product import volume:
lnIMcit=β0+β1lnGDPit+β2lnGDPct+β3lnDic+β4lnTOit+β5lnAGRit+β6lnGNIit+μict
(2)
whereIMcitrepresents the total volume of agricultural products imported by countrycfrom countryiduring the periodt.
The gravity equation of agricultural product export volume:
lnEXcit=β0+β1lnGDPit+β2lnGDPct+β3lnDic+β4lnTOit+β5lnAGRit+β6lnGNIit+μict
(3)
whereEXcitrepresents the total volume of agricultural products exported by countrycto countryiduring the periodt.
Regression analysis results of random effect model are shown in Table 8 and Table 9.
According to the regression results in Table 8, among the three categories of imported agricultural products, bothGDPiandGDPcshow a significant positive correlation with the dependent variable. For the three categories of agricultural products, the impact coefficient of category 1 beverage and tobacco and category 4 animal and vegetable oils, fats, and waxes is the largest, the coefficient of the explanatory variableGDPishows that for every 1% increase in the total economic scale of ASEAN countries, the total bilateral agricultural trade will increase by 0.778 3%; the second is the category 0 food and animal (0.517 6%), and the lowest influence is category 2 raw material (0.395 3%). Dic has a negative correlation with the import amount of agricultural products, with category 0 and category 2 at 10% significance level, and category 1 and category 4 at the 5% significance level. From the perspective of trade dependence, the import volume of only category 2 agricultural products has a significant negative correlation with trade dependence. That is, the higher the degree of trade dependence, the smaller the trade imports of the category 2 non-edible raw materials (except fuels). In terms ofAGRi, under the category 1 beverage and tobacco and category 4 animal and vegetable oils, fats, and waxes, imports have a significant negative correlation with the ratio of agricultural added value to GDP; the import of agricultural products of category 2 shows a significant positive correlation, indicating that for every 1% increase in the percentage of agricultural added value of ASEAN countries to GDP, the import of agricultural products will increase by 0.162 4%. Per capita national income is negatively correlated with the classification of imports of agricultural products of category 0 food and animal, category 1 beverage and tobacco and category 4 animal and vegetable oils, fats and waxes, which are significant at the 1% significance level.GNIiis not significant in the import amount of category 2 agricultural products.
According to the regression results in Table 9, bothGDPiandGDPchave a significant positive correlation with exports. The category 2 non-edible raw materials (except fuels) are greatly affected by the GDP of ASEAN countries, and the influence on export volume of various agricultural products by China’s GDP is similar, all remain significant at 10% level. In terms of distance, Dic is negatively correlated with the dependent variable, which is significant at the 10% significance level. The category 1 beverage and tobacco and category 4 animal and vegetable oils, fats, and waxes are greatly influenced by the distance. In terms of trade dependence, the trade dependence of ASEAN countries is negatively correlated with the export volume of the category 2 non-edible raw materials (except fuels) at 5% level, in other words, the higher the degree of trade dependence, the smaller the export volume of the category 2 agricultural products. The ratio of agricultural added value to GDP is not significant for the export value of agricultural products, and it is negatively correlated with category 0 food and animals, and is positively correlated with category 2 non-edible raw materials, except fuels, category 1 beverage and tobacco and category 4 animal and vegetable oils, fats and waxes. For agricultural products of categories 0, 1 and 4, the per capita gross national income measured based on PPP exchange rate is significantly negatively correlated with the export volume.
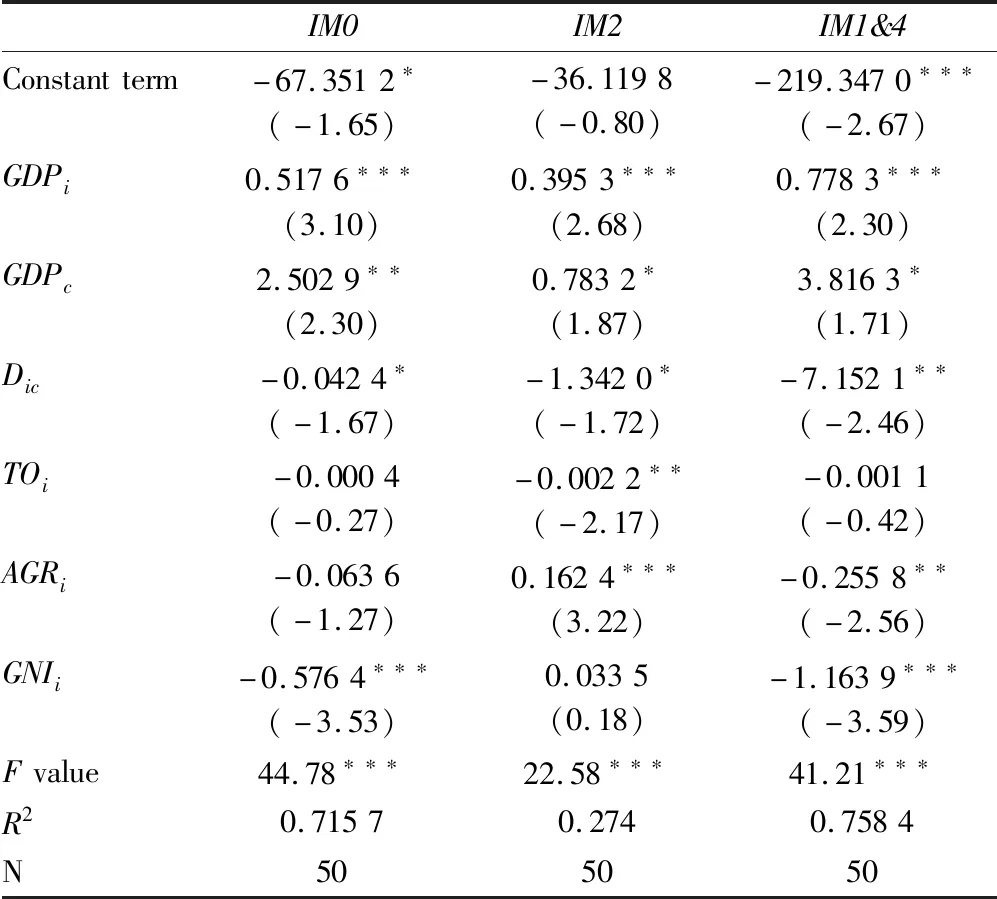
Table 8 Regression analysis of classification of agricultural products

Table 9 Regression analysis results of classification of agricultural products
6 Conclusions and recommendations
As indicated in the research results, with the deepening of the B&R, the scale of agricultural imports is constantly expanding, China’s total import trade of agricultural products with ASEAN increased from 14 840.889 million USD in 2013 to 16 143.059 million USD in 2017. Thailand and Indonesia have always been China’s the largest importers for agricultural products from ASEAN. In the export of agricultural products, China’s total export of agricultural products to ASEAN increased from 11 887.372 million USD in 2013 to 15 837.138 million USD in 2017, the growth rate is high. Vietnam is also China’s major exporter of agricultural products. Since 2016, Vietnam has surpassed Thailand to become China’s largest exporter of agricultural products. In 2013-2017, China-ASEAN agricultural product import and export trade was generally in a state of trade deficit. But in 2016, it was in a state of trade surplus.
From the regression results of the random effects model of the gravity model, in terms of China’s total imports and exports to ASEAN, bothGDPiandGDPcshow a significantly positive correlation with the dependent variable.Dicis negatively correlated with the dependent variable. The import and export volume of China-ASEAN agricultural products shows a negative correlation with the degree of trade dependence. Both import and export amount and the ratio of agricultural added value to GDP are significantly negatively correlated with the per capita gross national income, indicating thatGDPi, the ratio of agricultural added value to GDP, and the per capita GNI measured based on the purchasing power parity (PPP) exchange rate have a large impact on agricultural product trade in CAFTA in the context of "the Belt and Road".
From the analysis of the imports of categories of agricultural products, in the imported three categories of agricultural products, bothGDPiandGDPcshow a significant positive correlation with the dependent variable, and the impact coefficient of category 1 and category 4 is the largest.Dicis significantly negatively correlated with the import amount of categories of agricultural products. The import volume of the category 2 agricultural products shows a significant negative correlation with the degree of trade dependence. Besides, the imports of category 1 and category 4 have a significant negative correlation with the ratio of agricultural added value to GDP, while the imports of category 2 show a significant positive correlation. The per capita national income is negatively correlated with the imports of category 0, category 1 and category 4 agricultural products.
From the regression analysis of exports of categories of agricultural products, both the economic scale GDP and export value show a significant positive correlation, while the distance and the dependent variable have a significant negative correlation. Similar to the regression results of the imports, the trade dependence of ASEAN countries and the export volume of the category 2 agricultural products show a significant negative correlation. The ratio of agricultural added value to GDP is not significantly correlated with the exports of categories of agricultural products, and it is negatively correlated with category 0 agricultural products, and is positively correlated with category 2, category 1 and category 4 agricultural products. For agricultural products of categories 0, 1 and 4, the per capita gross national income measured based on PPP exchange rate is significantly negatively correlated with the export volume.
In view of the above analysis, it is recommended to adjust the import and export structure of agricultural products to balance the trade balance; encourage the development of deep processing and enhance the competitive advantage of agricultural products; adopt market diversification strategies to vigorously explore new export markets to reduce and alleviate the trade friction; improve the logistics system to effectively improve transportation costs caused by long distance.
杂志排行
Asian Agricultural Research的其它文章
- Impact of COVID-19 Epidemic on the International Food Supply Chain and Countermeasures of Shandong Province
- Comprehensive Evaluation on the Level of Agricultural Economic Development in Hubei Province Based on Principal Component Analysis
- Effect of Foliar Application of Selenium Fertilizer on Yield, Selenium Content and Heavy Metal Contents of Waxy Maize
- Effects of Applying Trace Clements on Yield and Quality of Flue-cured Tobacco Cuibi-1
- Analysis of the Correlation between Middle-season Rice Yield and Meteorological Factors in Jingdong County from 2009 to 2016
- Successful Cultivation of Albino Mauremys mutica for the First Time
