A novel dense descriptor based on structure tensor voting for multi-modal image matching
2020-09-25JizhenLUMoqingHUJingDONGSongliHANAngSU
Jizhen LU, Moqing HU, Jing DONG, Songli HAN, Ang SU
a School of Aeronautics and Astronautics, Central South University, Changsha 410083, China
b Aerospace Science and Engineering, National University of Defense Technology, Changsha 410073, China
KEYWORDS Dense feature descriptor;Remote sensing images;Similarity measurement;Structure tensor;Template matching
Abstract Automatic and robust matching of multi-modal images can be challenging owing to the nonlinear intensity differences caused by radiometric variations among these images. To address this problem, a novel dense feature descriptor and improved similarity measure are proposed for enhancing the matching performance.The proposed descriptor is built on a voting scheme of structure tensor that can effectively capture the geometric structural properties of images. It is not only illumination and contrast invariant but also robust against the degradation caused by significant noise. Further, the similarity measure is improved to adapt to the reversal of orientation caused by the intensity inversion between multi-modal images. The proposed dense feature descriptor and improved similarity measure enable the development of a robust and practical templatematching algorithm for multi-modal images.We verify the proposed algorithm with a broad range of multi-modal images including optical,infrared,Synthetic Aperture Radar(SAR),digital surface model,and map data.The experimental results confirm its superiority to the state-of-the-art methods.
1. Introduction
Image matching is a fundamental and critical step for a variety of computer vision applications such as vision based air craft navigation,1-2remote sensing image processing,3-4targets location,5,6and autonomous landing and hazard avoidance.2,7Template matching is an important sub-class of image matching. Despite substantial efforts having been expended by researchers in this field, automatic robust template matching for multi-images remains a challenging task owing to the significant radiometric differences among the images.8-10
Existing image-matching methods can be coarsely divided into two categories: feature-based matching methods and template-matching methods. Feature-based methods assume that shared features can be reliably detected and matched between images such that there are sufficient corresponding features to estimate the two-dimensional global transformation.11-13However, these types of methods can fail when they are applied to multi-modal images because the significant nonlinear radiometric differences between the images cause difficulty for detecting repeatable shared features.14Feature detection and matching are not required by template-matching methods. Rather, they estimate the similarity of two images using per-pixel comparison. Recent studies suggest that noise degradation,radiometric changes,and the decreasing of image size make repeatable feature detection difficult; in those cases,template methods are preferred.14,15
Template matching in multi-modal images is confronted by two major challenges including the nonlinear change of intensity and the degradation of noise.
The intensity differences between multi-modal images are sufficiently significant such that many mapping rules such as linearity, monotonicity, even the function constraints are violated.10,16This presents a serious challenge to the templatematching methods because the majority of their similarity measurement are based on these mapping rules.16
Intensity inversion is a special case of intensity change.In a common case of intensity variation, the illumination and contrast of an image can be changed; however, the orientation of the texture of the image remains unchanged. Based on this fact, texture orientation is frequently employed by imagematching algorithms to describe the geometric properties of an image.11,14,17-18However,intensity inversion can cause texture orientation reversal because the direction of the intensity changing is reversed, as displayed in Fig. 1. The Arrows indicate the direction of intensity changing from brighter to darker. In this case, the structure orientation information captured from the two images of the same object can be completely opposite. Therefore, intensity inversion frequently degrades the performance of template-matching algorithms based on texture orientation. In the experiment part we will show that even the most recent works on multi-modal image matching14,18-19have not properly addressed the problem of intensity inversion, and this dose significantly degrades the matching performance of these methods.
Remote sensing images such as Synthetic Aperture Radar(SAR),Digital Surface Model(DSM),and infrared images frequently contain strong noise, creating serious challenges for their matching. The similarity measurement suffer from the inclusion of noise because it further weakens the intensity links between two images captured from the same objects. Further,noise also has a negative effect on gradient or phase-based descriptors, which are frequently employed by imagematching algorithms to capture the structural properties of images.
Motivated by the limits of the current methods and practical demands,we propose a multi-modal image matching algorithm based on Structure Tensor Voting (STV), which try to address the three challenges listed above. There are two main contributions in the proposed work.

Fig. 1 Example of orientation reversal caused by intensity inversion.
1.1. A novel dense descriptor based on structure tensor voting
Structure tensor represents the magnitude and orientation information of the edges of an image.20Though the magnitude of the edges can be changed because of contrast variation,the orientation remains the same if the illumination or contrast is changed. Hence, we proposed a dense descriptor based on structure tensor to capture the geometric features of the image.The proposed descriptor enables the development of a robust template-matching algorithm that can adapt to significant nonlinear intensity changes.
Nevertheless,structure tensor is sensitive to noise because it is calculated based on the gradient of the gray image. It is a feasible solution to reduce the noise effect by averaging the tensors in the neighborhood with an isotropic filter. However,this also lead to undesirable blurring to the details of image,which can have a negative effect on the discriminability of the matching algorithm. To retain the details, we propose a voting scheme where the tensors in the neighborhood enforce each other based on their orientation similarity such that undesirable blurring is avoided.
The results of the experiments demonstrate that the proposed dense descriptor is robust against image degradation due to serious noise.
1.2. A novel measure for orientation comparison
Although orientation is illumination and contrast invariant, it can be reversed by the intensity inversion between multi-modal images. An example of this kind of orientation reversal is displayed Fig. 1. Apparently, in the case of intensity inversion,the orientation similarity of identical objects on two multimodal images can be completely miscalculated if Lpnorms such as the Sum of Absolute Differences (SAD) and Sum of Squared Differences (SSD) are employed.
Other matching algorithms14,17-18attempt to solve this problem by mapping the orientation to the range within(0,π] by adding π to the negative value. This remapping method works if the intensities are completely reverse(the orientations will point to opposite directions exactly). However,the nonlinear intensity variations between multi-modal images are very complicated,usually the variations are not completely reverse. In addition, noise distortion will also causes small changes for the orientation. Therefore, the orientations are not point to opposite directions exactly. In those cases, the remapping method may cause miss calculation. For an example, suppose the orientation of one pixel in the first image points to 0°. The orientation of the corresponding pixel in the second image could be change to -5° due to the noise affection or intensity variation. According to the remapping method, the difference between them is 175°, which is obviously unreasonable.
Our key observation is that the degree of parallelism or perpendicularity remains the same even when the directions are reversed. Based on this observation, we propose a novel measure using the degree of parallelism to estimate the similarity between orientations. The proposed measure returns the greatest value if the measured orientation is parallel and returns the least value if the measured orientation is perpendicular.
The results of the experiments demonstrate that the matching performance is significantly enhanced after the SAD of the angle is replaced by the proposed measure to estimate the similarity of orientation.
We developed the proposed algorithm with C++ code.Basic modules of this algorithm are available from OpenCV(http://opencv.org). To allow the proposed work to be conveniently reproducible, the source codes and testing data are available through our website (http://multi-modalImageMatching.blogspot.com/)or this link(https://pan.baidu.-com/s/1FrBzBodx479tKObTaDiH7g).
The remainder of this paper is as follows. Section 2 introduces the related works. The proposed template-matching algorithm is presented in Section 3. In Section 4 we conduct a thorough evaluation of the proposed algorithm and compare it with state-of-the-art methods and other recent efforts.Finally, the conclusions, limitations, and future work are presented in Section 5.
2. Related work
Nonlinear intensity differences are the major challenge faced by template-matching algorithms in multi-modal images.
Other template-matching algorithms have attempted to address this problem by improving the similarity or dissimilarity measurement. A well-known and frequently used similarity measure of template matching is Normalized Cross Correlation (NCC), which is invariant to linear intensity changes.21Actually, NCC can perform well even under monotonic nonlinear intensity variations because these can frequently be assumed to be locally linear.16Further, Log-Chromaticity Normalization was proposed to further improve the performance of NCC template matching under monotonic nonlinear intensity mappings.22However, NCC template matching will fail when monotonic mapping is violated.16
In Ref.16, Hel-Or et al. proposed a template-matching scheme termed Matching by Tone Mapping (MTM), which allows matching under non-monotonic and nonlinear tone mappings. MTM can be viewed as a generalization of NCC for non-monotonic and nonlinear mappings and actually reduces to NCC when the mappings are restricted to being linear. Nevertheless, MTM relies on functional dependency between the two matching images. When this assumption is violated, e.g., in multi-modal images, Mutual Information(MI) frequently outperforms MTM.14,16
MI measures similarity based on the statistical dependency between two images. More specifically, it assumes that the Joint Probability Distribution (JPD) of the intensity between matched images is less dispersed than that between mismatched images.23,24Because this assumption is valid even if the functional mapping is violated, MI is frequently employed for matching multi-modal images where the functional dependency is severely weakened by radiometric variation. However, MI is sensitive to the size of the histogram bins used to estimate the joint density,especially when small size templates are used.16Moreover,MI is time consuming because the construction of a joint histogram for each candidate window is computationally expensive.14
Other works have attempted to address the problem of nonlinear intensity changes by employing dense feature descriptors to capture the geometric structure information of the image.
The magnitude of gradient is a commonly used feature for representing image structure.25-27However, it is sensitive to the contrast variation that is typically observed among multimodal images.28Phase-based dense descriptors are also introduced to capture the geometric structure information of images. In Ref.29, Liu et al. proposed a local frequencybased descriptor for matching multi-modal medical images.In Ref.30, Wong and Orchard proposed a multi-resolution method to match multi-modal medical images by employing a dense descriptor based on phase congruency.31,32However,this method fails to capture the orientation information of an image, which has a negative effect on the discriminability.
The orientation and magnitude of structure feature have been exploited by other recent efforts17-18,33to enhance the performance of multi-modal image matching. Sibiryakov proposed a novel template-matching algorithm that projects the Histogram of Oriented Gradients (HOG) vectors of an image into binary codes and measures the similarity using Hamming distance.17Their method is not only robust against illumination and contrast variance but also extremely fast. In Ref.33,Ye et al.also propose a novel pixel wise feature representation using orientated gradients of images, which is named Channel Features of Orientated Gradients (CFOG). This novel feature is an extension of the pixel wise HOG descriptor with superior performance in image matching and computational efficiency.In Ref.14,Ye and Shen extended the phase congruency to build a novel dense descriptor called the Histogram of Orientated Phase Congruency(HOPC),which is robust against significant nonlinear radiometric changes. Their experimental results demonstrate that their method improved matching performance for multi-modal remote sensing datasets compared with the state-of-the-art methods (e.g., NCC, MI).
Nevertheless,there are two major drawbacks in their methods.First,their methods attempt to solve orientation inversion by mapping the orientations to the range (0,π], which can increase the difference between orientations by error in case of complicated nonlinear gray variation (as we introduced in Section 1). Secondly, their methods easily suffer from noise degradation because the dense descriptors employed by them are not robust to noise degradation.
Recently,DeepMatching(DM)34was proposed to compute quasi-dense correspondences by employing a hierarchical correlational architecture like Convolutional Neural Networks(CNN). DM aims at handling non-rigid deformations and repetitive textures between images,but it can’t deal with severe nonlinear intensity differences caused by cross-modality.35Learning-based approaches36-38have also proposed for dense image matching, but they are not necessarily superior to the handcrafted DM architecture in term of performance and they also can’t handle severe nonlinear intensity differences caused by cross-modality. In Ref.39, Yang et al. proposed a Deep Learning based feature descriptor for remote sensing image matching.However,it’s impractical to retrain a deep convolutional neural network with massive scale of multi-modal remote sensing images. Therefore, they have to use a Visual Geometry Group (VGG) network40which is pretrained on ImageNet dataset.41As a result, this method can’t handle multi-modal image matching with SAR or infrared images because these types of images are not contained in ImageNet dataset. One most recent work19employs a trainable model,called Dense Adaptive Self-Correlation (DASC), to estimate dense correspondences between multi-modal images. DASC achieves excellent performance on benchmark datasets.42-44However, the descriptors of DASC is based on selfcorrelation which is not invariant to the complicated radiometric variations among the remote sensing multi-model images.This was verified in the experimental part of this paper.
3. Methodology
In this section, we first provide an overview of the proposed algorithm. Then, the proposed dense descriptor and similarity measure are described in detail.
3.1. Overview

where Uwis the set of total candidate windows in the base image, O (* ) represents the function that transforms the intensity image to the vector of the dense feature descriptor, and S (* ,*) is the similarity measurement between the two vectors of the dense feature descriptor.The goal of the proposed algorithm is to locate the target window with the maximum similarity to the template among the candidates.

Fig. 2 Example of template matching between multi-modal remote sensing images.
This kind of template-matching is often used for aircraft navigation in the situation without GPS (or the GPS signal is disturbed). The position of the aircraft can be estimated by matching a few real-time images (which are the template images) to an orthographic projected reference image (which is the base image) with coordinates. Before the matching, the real-time images are corrected to orthoimages according to the information provided by inertial navigation system and altimeter (e.g., attitude, direction, and altitude), which results in the real-time images only having translation offsets relative to the reference image.
The proposed algorithm consists of five main steps.
Step 1. we calculate the structure tensor for each pixel.
Step 2. an anisotropic filter called tensor voting is performed to enforce the structure tensor.
Step 3. the tensor orientation of each pixel is calculated to generate the orientation map. The above three steps are performed on both the template and the base image.
Step 4. the orientation map of the template is compared with each candidate window of the same size in the orientation map of the base image.
Step 5. the position of the candidate window with maximum similarity will be output.
The flowchart was given in Fig. 3. In the following subsections, each step will be described in details.
3.2. Dense feature descriptor based on structure tensor
The proposed dense feature descriptor is built on tensor orientation at each pixel of image. More specifically, we first estimate the structure tensor based on the gradient of the gray image. Then, a voting scheme is introduced to enforce the structure tensor at each pixel. Finally, the tensor orientation is estimated based on the voting results.
3.2.1. Structure tensor
The structure tensor is built on the gradient of the gray image,which can be calculated using Gaussian derivative filters.Given a gray image f, the estimation of the gradient of this image can be formulized as follows:

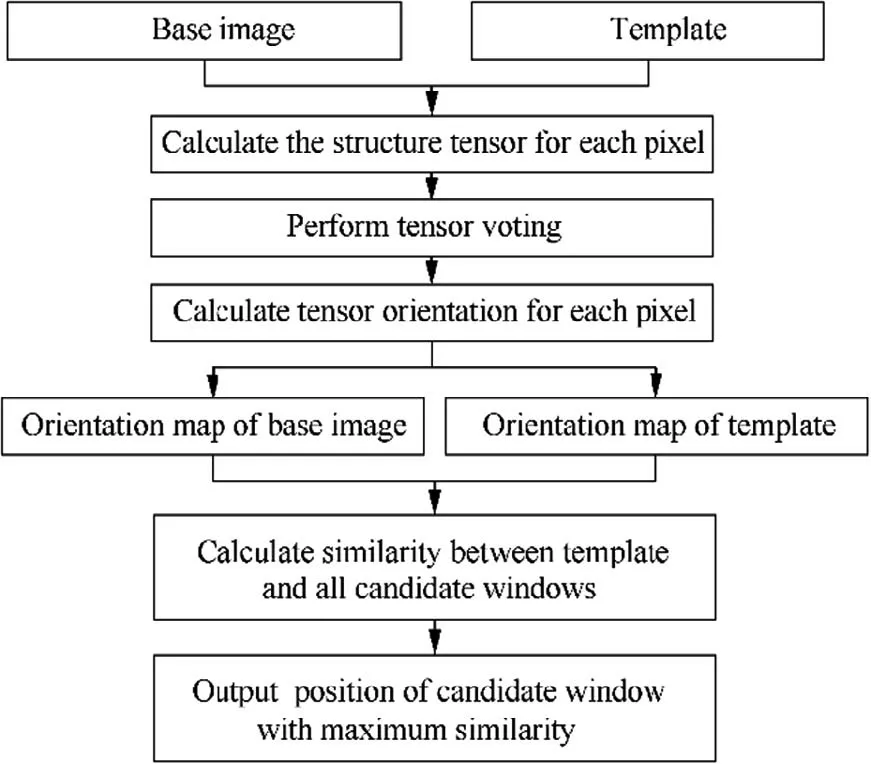
Fig. 3 Flowchart of proposed algorithm.
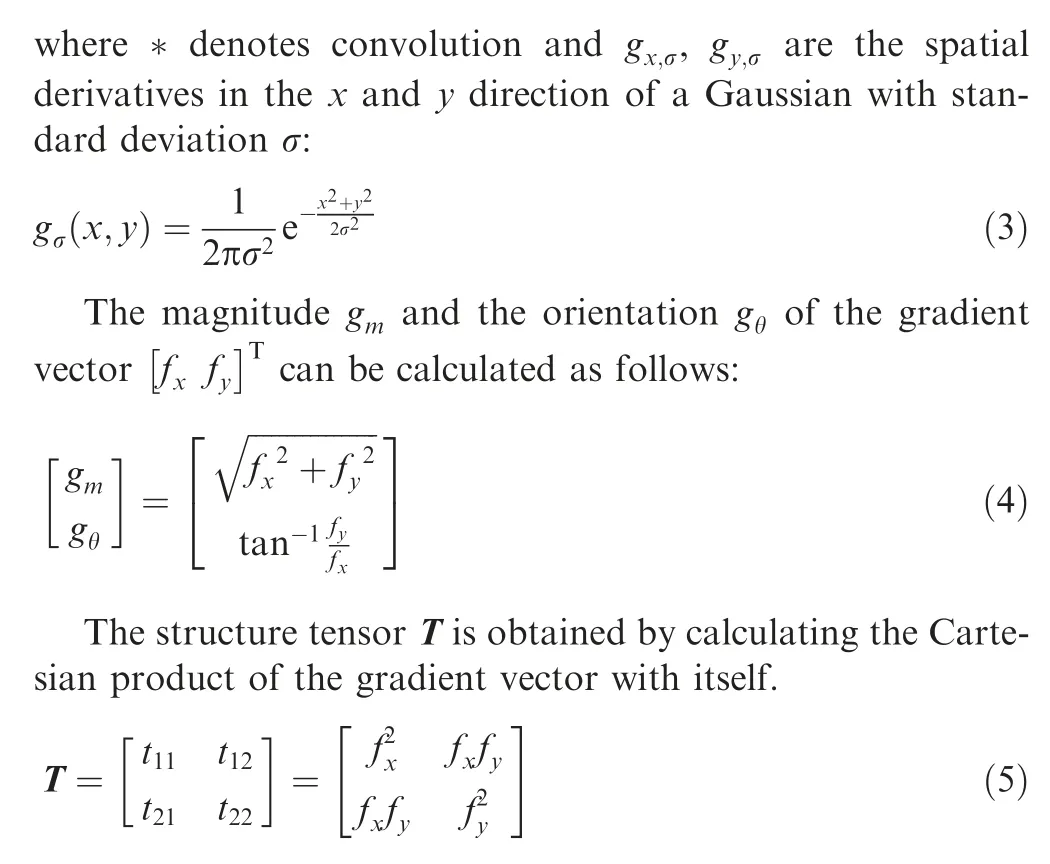
3.2.2. Tensor voting
The structure tensor directly calculated according to Eq. (5) is based on the gradient at pixel scale, which is not reliable for capturing the structure property. For example, the structure tensor could be extremely sensitive to noise because the gradient is estimated through partial derivatives of the image.
The noise can be decreased by performing spatial isotropic averaging to the tensors.However,this will lead to undesirable blurring to the fine structure. Actually, we require that structure tensors be enhanced along their orientations, not perpendicular to them; unfortunately, the isotropic averaging fails to do this. In Ref.20, a non-linear averaging filter is proposed to avoid the undesirable blurring. The kernels of this filter are polar separable functions, where the radial part is a Gaussian filter, but the angular part modulates the Gaussian so that it becomes zero perpendicular to the local edge direction.Inspired by this method, we developed a voting scheme such that the tensors in the neighborhood enforce each other based on the similarity of their gradient orientation and the distance between them.
Assuming a voting tensor with gradient orientation α and a receiving tensor with gradient orientation β, the magnitude of the vote mcan be calculated as follows:

where r denotes the distance between the voter and receiver and σ′is the scale of voting, which determines the size of the effective neighborhood. The first item on the left portion of Eq.(6)indicates that the voting magnitude from the voter that is close to the receiver will be stronger than the voting magnitude from the one that is distant to the receiver. The second item on the left portion of Eq. (6) indicates that the voting magnitude from the voter that is parallel to the receiver will be stronger than the voting magnitude from the one that is perpendicular to the receiver.
The motivation of the tensor voting derived from Eq.(6)is further described in Fig. 4. Fig. 4(a) shows that a receiver in the center of the concentric circles and its structure orientation is horizontal (which means its gradient orientation is vertical).The voters are distributed on the five concentric circles. In Fig. 4 (b), the intensity indicates the voting magnitude from all the voters to the receiver in the center.We can observe that the voters tend to parallel with the receiver have stronger voting magnitude among the voters with the same distance to the receiver. Furthermore, the voters closer to the receiver have stronger voting magnitude among the voters with identical orientation. Therefore, the nearby texture patterns with similar orientation will enforce each other through tensor voting,which helps to prevent the degradation of structure caused by noise.
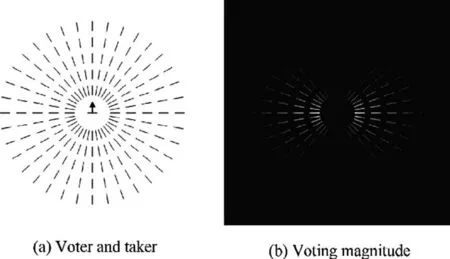
Fig. 4 Example of tensor voting.
The voting result is the summation of the votes cast by all the voters in the effective neighborhood(including the receiver itself). In practice, the integration is calculated by the tensor addition:
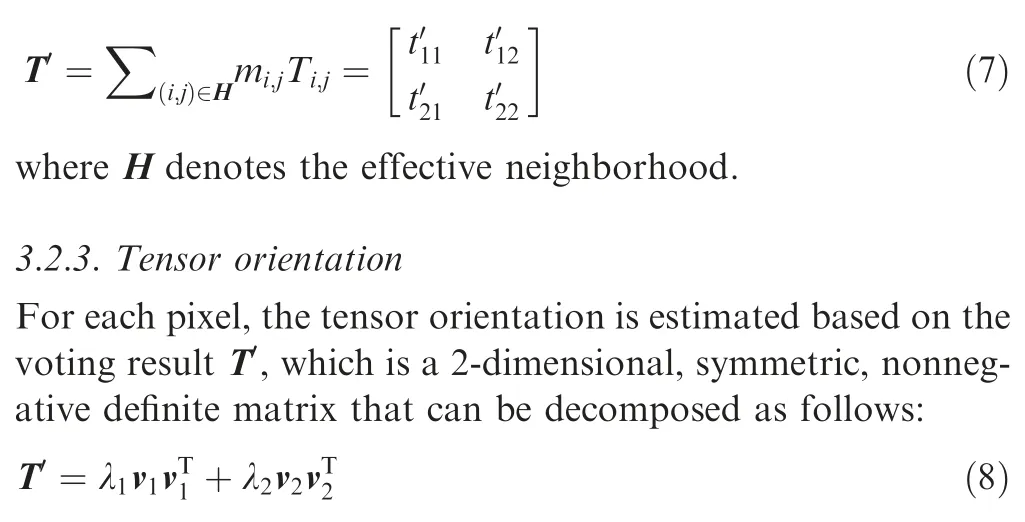
where λiare the eigenvalues in decreasing order and viare the corresponding eigenvectors.
The orientation of the tensor θ is the direction of the eigenvector that belongs to the greatest eigenvalue λ1, which is calculated according to the following equation:

A comparison between tensor orientation and gradient orientation is displayed in Fig. 5.
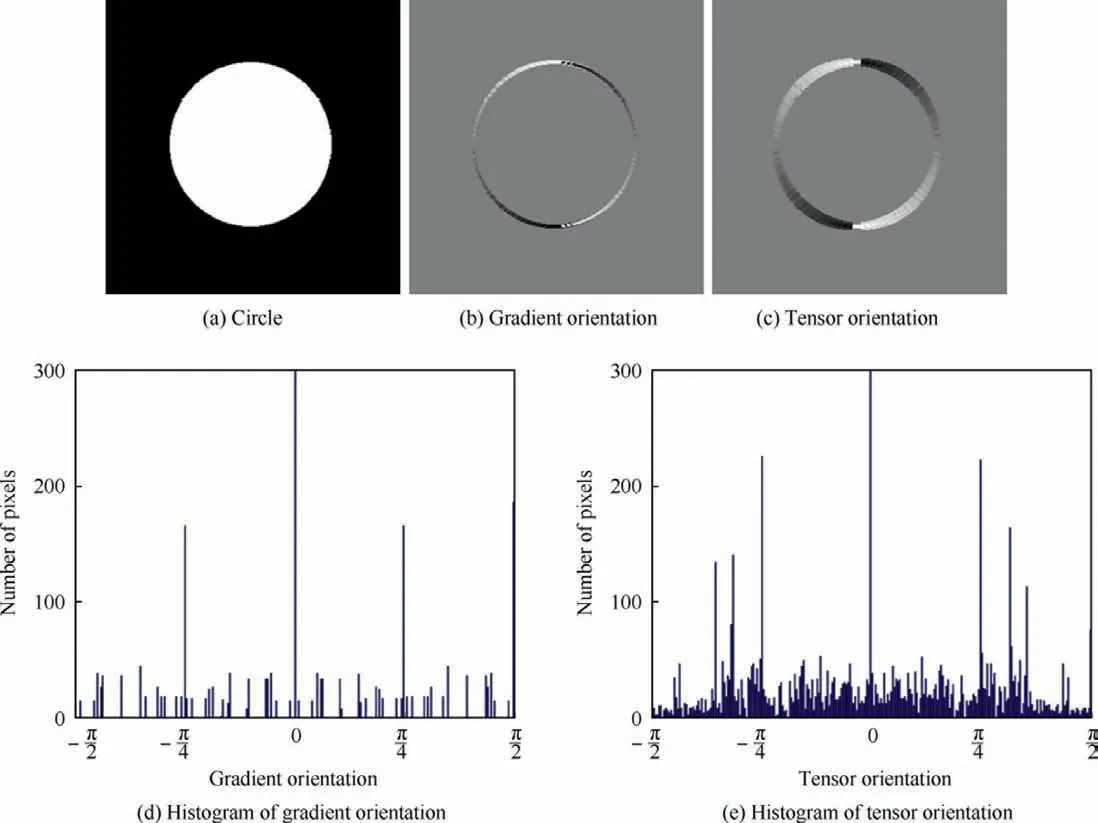
Fig. 5 Comparison between tensor orientation and gradient orientation.
Figs.5(b)and(c)display the two kinds of orientation of the circle depicted in Fig. 5(a). Fig. 5(d) is the pixel distribution over gradient orientation and Fig.5(e)is the pixel distribution over the tensor orientation.In Fig.5(d),there are many orientations with no pixels,which means that these orientations are not captured by the descriptor directly based on gradient orientation. However, the descriptor based on structure tensor captured more orientations, which means that the change of tensor orientation is smoother compared with that of the gradient orientation.The cause of the difference between the gradient orientation and tensor orientation is that the intensity change of the digital image is not continued because of the discretization. The gradient orientation is estimated from a small area.Therefore, it cannot capture the continued change of the orientation of the circle in Fig.5(a)owing to the discretization of the digital image. Conversely, tensor orientation is a summation of the votes from a relative large area and the voting process will partially recover the continuity of the orientation change.That is,the tensor orientation can capture more subtle structure changes of the real object compared to gradient orientation.
In addition, the tensor orientation is more robust against the noise degradation compared with the ordinary gradient orientation, an example of this advantage is shown in Fig. 6.Fig.6(a)shows a synthetic image,noises are added to the right part of Fig. 6(a). Fig. 6(b) shows the orientations of the concentric circles estimated with ordinary gradient. Fig. 6(c)shows the orientations of the concentric circles estimated with the structure tensor proposed in this work.Obviously,the orientations estimated with structure tensor are more accurate than the orientations estimated with ordinary gradient, especially for the noise part of Fig. 6(a).
3.3. Similarity measurement for tensor orientation
We believe the solution for the orientation inversion among the multi-modal images is to improve the similarity measure of orientation rather than to limit the range of orientation.In fact, the reversal of orientation is an inevitable fact if the intensity is inversed. Our key observation is that the degree of parallelism or perpendicularity between orientations
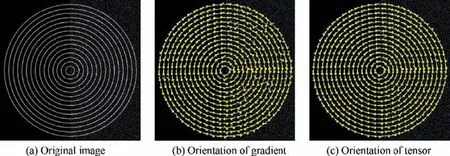
Fig. 6 Orientation estimation for concentric circles.

Fig. 7 Measure of degree of parallelism.

Suppose two orientations varied within[0,π], the relationship between the absolute difference of the two orientations and the value of the proposed similarity measure for the two orientations is displayed in Fig. 8. When the absolute difference of two orientations (x axis) is 0 or π (which is the case of parallel),the proposed similarity measure(y axis)will attain the maximum π/2;when the absolute difference of two orientations is π/2 (which is the case of perpendicular), the return value will be the minimum zero.
4. Experimental results
In this section, the matching performance of the proposed algorithm is evaluated by comparing it with other templatematching algorithms. A variety of multi-modal images are used for the evaluation.
4.1. Algorithms and dataset used for experiments
To investigate the matching performance of the proposed algorithm,it is compared with the following six template-matching algorithms:
(1) Projection Quantization Histogram of Oriented Gradients (PQ-HOG). This template-matching algorithm is based on the binary code that is encoded by projecting and quantizing the HOG of the image.17We reimplement the algorithm based on the three-byte PQHOG code and measure the similarity with Hamming distance. As reported in Ref.17, the three-byte type outperforms the one-byte type for matching multi-modal images.

Fig. 8 Proposed similarity measurement.
(2) HOPC. This template-matching algorithm is built on a descriptor called the Histogram of Orientated Phase Congruency.14,18The experimental results of14,18demonstrate its superiority to the state-of-the-art template-matching algorithms (e.g., NCC, MI, MTM).The source code of HOPC is provided in.18
(3) DASC.This template-matching algorithm is built on the dense descriptor based on adaptive self-correlation.19The experimental results of19demonstrate its superiority to the state-of-the-art descriptors.11,45-48The source code of DASC is provided in Ref.19. For calculating the similarity between the DASC descriptors, we selected different measurement and compared the matching results.Finally,we employed NCC as the similarity measurement, which allowed DASC to achieve the best matching performance on the testing datasets.
(4) MI. This algorithm matches images by directly measuring the similarity of image gray. MI is based on maximization of mutual information.24As reported in Ref.16, MI is sensitive to the size of the histogram bins.Therefore, we selected different sizes and compared the matching results. Finally, we set the size of the histogram bins to 32,which allowed MI to achieve the best matching performance on the testing datasets.
(5) ImpGO. This algorithm is similar to the proposed template-matching algorithm, except that its dense feature descriptor is directly built on the gradient orientation at each pixel, rather than tensor orientation. By comparing this algorithm with the proposed algorithm,we can verify the advantages of the proposed feature descriptor.
(6) GO. As with ImpGO, the dense feature descriptor of GO is based on gradient orientation, however, it employs the SAD of the angle to measure the similarity of orientation. By comparing this algorithm with ImpGo, we can verify the advantages of the proposed similarity measure.
NCC and MTM are widely used algorithms for matching images with light changes. However, the experimental results of Refs.14,16indicate that both NCC and MTM were inferior to MI for matching multi-modal images. Therefore, they are not included in our experiment because MI was already compared with the proposed algorithm.The standard deviation of Gaussian derivative filters σ and the scale of tensor voting σ′are the two main parameters of the proposed algorithm. We set σ=0.6 and σ′=1.2 for all the experiments in this work.The source codes of the proposed algorithm and all the compared algorithms are available on our website.
To compare the proposed algorithm with the other six algorithms listed above,we evaluated the performance of template matching with a broad range of multi-modal image pairs,including: Visible-to-Infrared, Visible-to-DSM, Visible-to-SAR, and Visible-to-Map. Examples from the dataset are displayed in Fig.9.Figs.9(a)and(b)are provide in Ref.16.Figs.9(c) and(d) are provide in Ref.49. Figs. 9(e) and(f) are provide in Ref.10. Figs. 9(g) and (h) are images from google map. The datasets can be downloaded from our website.

Fig. 9 Examples of multi-modal remote sensing image pairs from tested dataset.
4.2. Experiment 1: Different template sizes
In this experiment,we compared the matching performance of the investigated algorithms over the datasets with different template sizes. Given a base image, decreasing the size of the template frequently has a negative effect on the matching performance owing to the latent replicate pattern on the base image.
Each multi-modal image pair consisted of a sensed image and a base image. The sizes of the base images were different,from the smallest 268×268 to the largest 423×312.The templates had five different sizes, 32×32, 64×64, 96×96,128×128,and 160×160.For each template size,25 templates were evenly scattered on the sensed image and were matched to the base image.A match result was considered as correct if its distance to the true position was within a threshold. This will make sure the overlapping ratio between the matching corresponding window and the true window is more than 90%.The average matching corrected rates of the investigated algorithms on the tested datasets are indicated in Fig. 10.
The results demonstrate that the Proposed STV Algorithm(PA) achieved the best average correct rates in all template sizes of the test compared with MI, PQ-HOG, HOPC, and DASC. Moreover, ImpGO indicated a significant improvement in the average corrected rates compared with GO,which means the proposed measure employed by ImpGO and the PA is more suitable for measuring the similarity of gradient orientation between multi-modal images. Further, the PA achieved superior matching performance compared with ImpGO,which means the replacement of the gradient orientation with the proposed tensor orientation improved matching performance.
As reported in Ref.19, DASC achieves excellent performance on the multi-modal benchmark44(which consists of images taken under five different photometric variation pairs including illumination, exposure, flash-noflash, blur, and noise). However, our experiments show that DASC is not a good choice for matching the remote sensing multi-model images with significant nonlinear intensity differences caused by radiometric variations. The matching performance of DASC is obviously lower than the PA,PQ-HOG and ImpGO.We believe there are two reasons for this result.One is its limited discriminative power due to a limited set of patch sampling patterns used for modeling internal self-similarities,which is pointed out by Ref.35. The other major shortcoming of DASC is that the self-correlation employed by DASC is not invariant to the complicated radiometric variations among the remote sensing multi-model images. For an example, the intensity inversion will cause the self-correlation based des criptor of DASC completely changed, which will significantly degrade its performance.
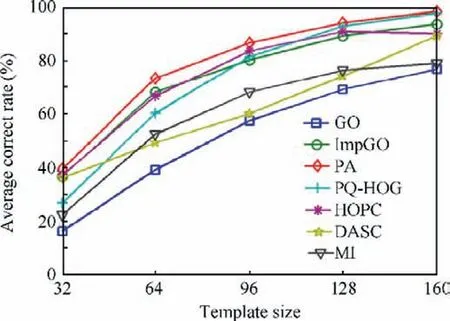
Fig. 10 Average matching correct rates of investigated algorithms over template size.
The matching performance of HOPC is comparable with the proposed algorithm for most of the tested images. However, for the image pairs with significant intensity inversion,the PA is far superior to HOPC. An example is given in Fig. 11. Fig. 11(a) displays the centers of 25 templates on the sense image. Fig. 11(b) displays the matching results of the proposed algorithm. Fig. 11(c) displays the matching results of the HOPC.
4.3. Experiment 2: Different noise levels
Noise can seriously reduce the matching correct rate of template-matching algorithms based on a dense feature descriptor because they frequently employ gradient or phasebased descriptors, which are sensitive to noise.
In this experiment, datasets with noise degradation were used to evaluate the six dense feature-based templatematching algorithms, which include GO, ImpGO, PQ-HOG,HOPC, DASC and the PA. We used the MATLAB function‘‘imnoise” to add noise to the sensed images of the multimodal image pairs. There were three different kinds of noise with four noise levels added to each image. The four different levels of Gaussian noise having variances 0.03, 0.06, 0.09, and 0.12 are referred to as G1,G2,G3,and G4,respectively.Four different levels of ‘‘salt & pepper” noise having noise densities 0.1, 0.2, 0.3, and 0.4 are referred to as P1, P2, P3, and P4,respectively. Four different levels of ‘‘speckle” noise having variances 0.2, 0.4, 0.6, and 0.8 are referred to as S1, S2, S3,and S4, respectively. Fig. 12 displays a sensed image from the tested datasets and its noise-degraded images.The average matching correct rates of the investigated algorithms on the dataset with noise are displayed in Fig.13.The size of the template was fixed to 160×160 to exclude the influence of change of template size.
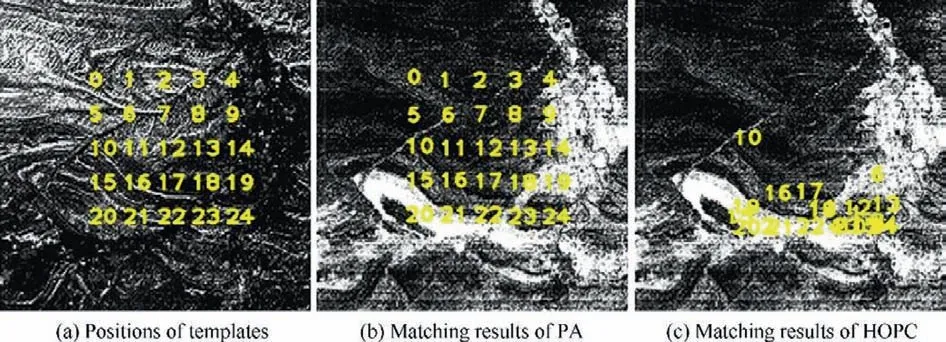
Fig. 11 Matching results of PA and HOPC for image pairs with significant intensity inversion.
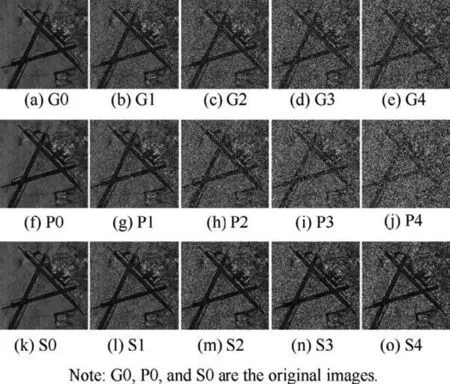
Fig. 12 Sensed image from the tested datasets and noise degraded images.
It can be observed that the average matching correct rates of the six investigated algorithms all decreased as the noise level of the three types of noise increased; the decrease of the matching correct rate of DASC was the most significant among the six. This also suggests that DASC is not a good choice for matching the remote sensing multi-model images which often carry with significant noise. After comparing the similarity surface of DASC with the similarity surface of the PA, we found that the discriminative power of DASC is severely degraded by noise degradation.
Examples of noise effect to the similarity surfaces of DASC and PA are shown in Fig. 14. Fig. 14(a) displays the sense image and the search area. In Fig. 14(b), Gaussian noise is added on the sense image.Fig.14(c)displays the similarity surfaces of DASC without noise degradation. Fig. 14(d) displays the similarity surfaces of DASC with noise degradation.Fig.14(e)displays the similarity surfaces of STV without noise degradation. Fig. 14(f) displays the similarity surfaces of STV with noise degradation. We can see that the global maximum of the similarity surface of the PA remains prominent after the noise degradation,but the global maximum of the similarity surface of DASC is significantly compromised by the noise degradation.
It also should be pointed out that the PA achieved superior results compared with ImpGO over the three datasets with noise degradation, which indicates that the replacement of the gradient orientation with the proposed tensor orientation makes the PA more robust to noise. Overall, the proposed template-matching algorithm achieved the best matching performance for all three types of noise degradation in the test.

Fig. 13 Average matching correct rates of investigated algorithms on noise datasets.

Fig. 14 Noise effect to similarity surfaces of DASC and PA.
5. Conclusions
Multi-modal image matching must address three major challenges including the nonlinear change of intensity, inversion of intensity, and degradation of noise. In this paper, we proposed a novel template-matching algorithm to address these three challenges.There are two main contributions in the proposed work. First, we proposed a dense descriptor based on structure tensor to capture the geometric features of the image.The proposed descriptor can adapt to significant nonlinear intensity changes and is also robust against image degradation caused by serious noise. Secondly, we proposed a novel similarity measure that can address the reversal of orientation caused by intensity inversion. We verified the proposed template-matching algorithm with a broad range of multimodal images including optical, infrared, SAR, DSM, and map data. The experimental results confirm the superiority of the proposed algorithm to the state-of-the-art methods.
Acknowledgements
This paper is supported by the National Natural Science Foundations of China(No.61802423)and the Natural Science Foundation of Hunan Province, China (No. 2019JJ50739).The authors would like to thank the Hyperspectral Image Analysis group and the National Science Foundation Funded Center for Airborne Laser Mapping at the University of Houston for providing the data sets used in this study,and the IEEE GRSS Data Fusion Technical Committee for organizing the 2013 Data Fusion Contest.
杂志排行
CHINESE JOURNAL OF AERONAUTICS的其它文章
- A new fatigue life prediction model considering the creep-fatigue interaction effect based on the Walker total strain equation
- State estimate for stochastic systems with dual unknown interference inputs
- Machining deformation of single-sided component based on finishing allowance optimization
- Type synthesis of deployable mechanisms for ring truss antenna based on constraint-synthesis method
- A hybrid lattice Boltzmann flux solver for integrated hypersonic fluid-thermal-structural analysis
- Positioning error compensation for parallel mechanism with two kinematic calibration methods
