Identification of stable internal control genes for accurate normalization of real-time quantitative PCR data in testicular tissue from two breeds of cattle
2020-09-17PradeepNagAnkurSharmaElangoKamarajArumugamKumaresanTirthaKumarDattaAyyasamyManimaranNilenduPaulSakthivelJeyakumarKerekoppaRamesha
Pradeep Nag, Ankur Sharma, Elango Kamaraj, Arumugam Kumaresan✉, Tirtha Kumar Datta, Ayyasamy Manimaran,Nilendu Paul, Sakthivel Jeyakumar, Kerekoppa P.Ramesha
1Theriogenology Laboratory, Veterinary Gynaecology, and Obstetrics, Southern Regional Station of ICAR- National Dairy Research Institute, Bengaluru- 560030 Karnataka, India
2Animal Genomics Laboratory, ICAR - National Dairy Research Institute, Karnal - 132 001 Haryana, India
3Southern Regional Station of ICAR-National Dairy Research Institute, Bengaluru - 560030 Karnataka, India
ABSTRACT
KEYWORDS: Cattle bulls; Gene expression; Internal control genes; Normalization; qPCR; Testis
1.Introduction
Male infertility/sub-fertility is a significant problem in bovine,leading to colossal losses to farmers.The incidence of male infertility/sub-fertility varies among breeds with a reported higher incidence among Taurine × Indicine crossbred bulls in tropical countries.More than 50% of crossbred young bulls are rejected from the breeding programs due to infertility/sub-fertility.Further,the production of inferior quality ejaculates ranged from 23.02% to 100.00%, with an average of 52.46% in crossbred bulls[1,2];however, the etiology remains unknown in most of the cases[3-5].Several researchers, across the globe, are striving hard to find out the molecular differences at spermatozoa[6-10]and testicular level[11,12]between high- and low-fertile bulls, but with variable results.Since the quality of the ejaculated spermatozoa is determined by the testicular environment, assessing the testicular transcriptome would help in identifying the possible mechanisms associated with infertility in bulls[13].In this direction, an increasing number of studies analyzed testicular transcripts in different mammalian species[14-16].However, the results reported on the relative expression of genes of interest, even in the same breed, were highly variable among different studies, partly implicated to the internal control genes (ICGs) used in these study.
Quantitative real-time polymerase chain reaction (qPCR) is the most widely adopted technique for studying the gene expression pattern and validating the transcriptomics data obtained through microarray and RNA sequencing.However, the accuracy of the qPCR technique relies upon several factors, including sample type,primer designing, enzyme efficiency, annealing temperature, and precise normalization of expression data using stable ICGs[17].To detect the minute difference in the expression of genes of interest using qPCR, the inclusion of an ICG stably expressed under different experimental conditions/cells/tissues is of utmost priority for the accurate normalization of gene expression data.In most of the previous qPCR studies, glyceraldehyde 3-phosphate dehydrogenase(GAPDH), β- actin (ACTB), and 18S ribosomal RNA (18S rRNA)were used as ICGs for normalization of gene expression data[18,19].However, numerous researchers have reported that the expression levels of these ICGs varied in different tissues, cell types, or even within the same cell type after experimental treatments[20-22].Dheda et al[23]reported that some reference genes are highly specific for a particular tissue and that experimental validation for each situation is a crucial requirement.Thus, the selection of an ideal housekeeping gene for each experimental condition is crucial for accurate results[24].
Further, it was recommended that for every new experiment,multiple ICGs should be evaluated to find the panel of most stable ICGs to avoid faulty interpretations.In this context, identification of a panel of the optimal ICGs expressed stably in testicular tissue from Zebu and crossbred bulls is crucial for the accurate normalization of gene expression data.To the best of our knowledge, minimal information is available regarding the comparative evaluation of the stability of ICGs in testes samples from different breeds of cattle.With this backdrop, the present study was undertaken to identify the panel of most stable ICGs for accurate normalization of transcription data from testes samples collected from Zebu and crossbred bulls.
2.Materials and methods
2.1.Collection of testicular tissues
The present study was carried out at Theriogenology Laboratory,Southern Regional Station of Indian Council of Agricultural Research- National Dairy Research Institute, Bengaluru, India.All the chemicals and consumables used in the present study were procured from Thermo Fisher Scientific (USA) unless specified otherwise.The testicular tissues from Zebu and crossbred bulls(n=6 each) between 2-8 years of age were collected from an abattoir aseptically in RNA later and snap-frozen in liquid nitrogen till downstream processing.
2.2.RNA isolation and cDNA synthesis
Total RNA was isolated from the testicular tissue by using the PureLink RNA Mini Kit as per the manufacturer’s instructions and subjected to DNase treatment by using TURBO DNA-free Kit to remove possible genomic DNA contamination.Quantity and quality of RNA were assessed by using the NanoDrop spectrophotometer(ND-1000, Thermo Fisher Scientific, USA).RNA samples with a 260/280 ratio between 1.9 to 2.0 were further used for reverse transcription.The cDNA was synthesized for 1 μg of total RNA by using Revertaid First-Strand cDNA Synthesis Kit as per the manufacturer’s protocol.The primer details for reference genes were given in Table 1.Before qPCR, the primer specificity and annealing temperatures were determined by using Prima 96 plus gradient PCR(Himedia, India).The reaction mixture (25 μL) consisted of Dream Taq Green PCR Master Mix 12.5 μL, forward primer and reverse primer (0.5 μL each), cDNA template 2 μL and nuclease-free water of 9.5 μL.The PCR conditions used were 95 ℃ for 5 min and 30 cycles of 95 ℃ for 30 s, 60 ℃ for 30 s and 72 ℃ for 60 s, and the final extension was done at 72 ℃ for 5 min.Primer specificities were evaluated by running the amplified PCR products on 2% agarose gel electrophoresis.
2.3.Selection of internal control genes
Ten ICGs, belonging to different functional classes, were selected for evaluation: glyceraldehyde 3-phosphate dehydrogenase(GAPDH),β- actin (ACTB), ribosomal protein L23 (RPL23),ribosomal protein S15A (RPS15A), ATP synthase, H+ transporting,mitochondrial Fo complex subunit B1 (ATPSF1), solute carrier family 2 (facilitated glucose/fructose transporter), member 5(GLUT5), hydroxymethylbilane synthase (HMBS), ATPase, Ca++transporting, plasma membrane 4 (ATP2B4), peptidylprolyl isomerase A (PPIA) and bovine ribosomal protein PLO (BRP) (Table 1).The primer sequences were adopted from the literature [21,25-27].
2.4.qPCR
qPCR was performed by using Instaq 96 plus Real-time PCR(Himedia, India).A total of 15 μL reaction mixture was prepared by using 7.5 μL (2X) SYBR green master mix, 0.25 μL each of 10 μM forward and reverse primer, 1 μL of cDNA template and 6 μL of nuclease-free water.The amplification conditions used were 95 ℃ for 20 s, 40 cycles of 95 ℃ for 15 s, 60°℃ for 15 s and 72 ℃ for 45 s, followed by a dissociation protocol 95 ℃ for 15 s plus 60 ℃ for 15 s with an increment of 0.3 ℃ per minute.Each run included a non-template control.The qPCR expression data for each gene were extracted in the form of the quantification cycle, and data were subjected for subsequent analysis.The specificity and integrity of PCR products were ensured by melt curve analysis, and the appropriate size of amplified products was ensured by 2% agarose gel electrophoresis (Supplementary Figure 1).
2.5.Evaluation of expression stability of ICGs
For the evaluation of the expression stability of ICGs, four different statistical algorithms: geNorm, NormFinder, BestKeeper,and Reffinder, were used.The geNorm software (Version v3.5;17) measured the expression stability (M value) by comparing the pairwise variations among the reference genes.The ICGs were ranked based on the calculated M value, which was inversely correlated to gene expression stability.The input data for geNorm were created by converting the cycle threshold (Ct) values into relative quantities as described by Livak and Schmittgen[28]and Vandesompele et al[17].Moreover, geNorm was also used to calculate the pair-wise variation (V) of the ICGs to select the optimal number of ICGs to be used for normalization of expression data for Zebu and crossbred testes.This was achieved by comparing the normalization factor of the best reference gene (NFn) with the normalization factor of the next stable reference gene (NFn+1).NormFinder algorithm(Version 0.953; 29) considered the intra- and inter- group variations of expression of each of the ICG to calculate the gene stability and ranked the ICGs accordingly[29].For Normfinder also, the Ct values were transformed into linear scale expression quantities,and it ranked the ICGs and gave corresponding expression stability taking into account the possible variation across the different sample groups.Bestkeeper software (Version 1; 30) was used to find out the pair-wise correlations among the candidate ICGs.The input data used for Bestkeeper were raw Ct values instead of relative quantities.The program had its assumption that the stably expressed genes should be highly correlated to each other.The geometric mean of the Ct values of highly correlated genes was used for the calculation of the Bestkeeper index, which ranked the stability of reference genes.The gene with the least standard deviation and a high correlation was considered a highly stable reference gene.
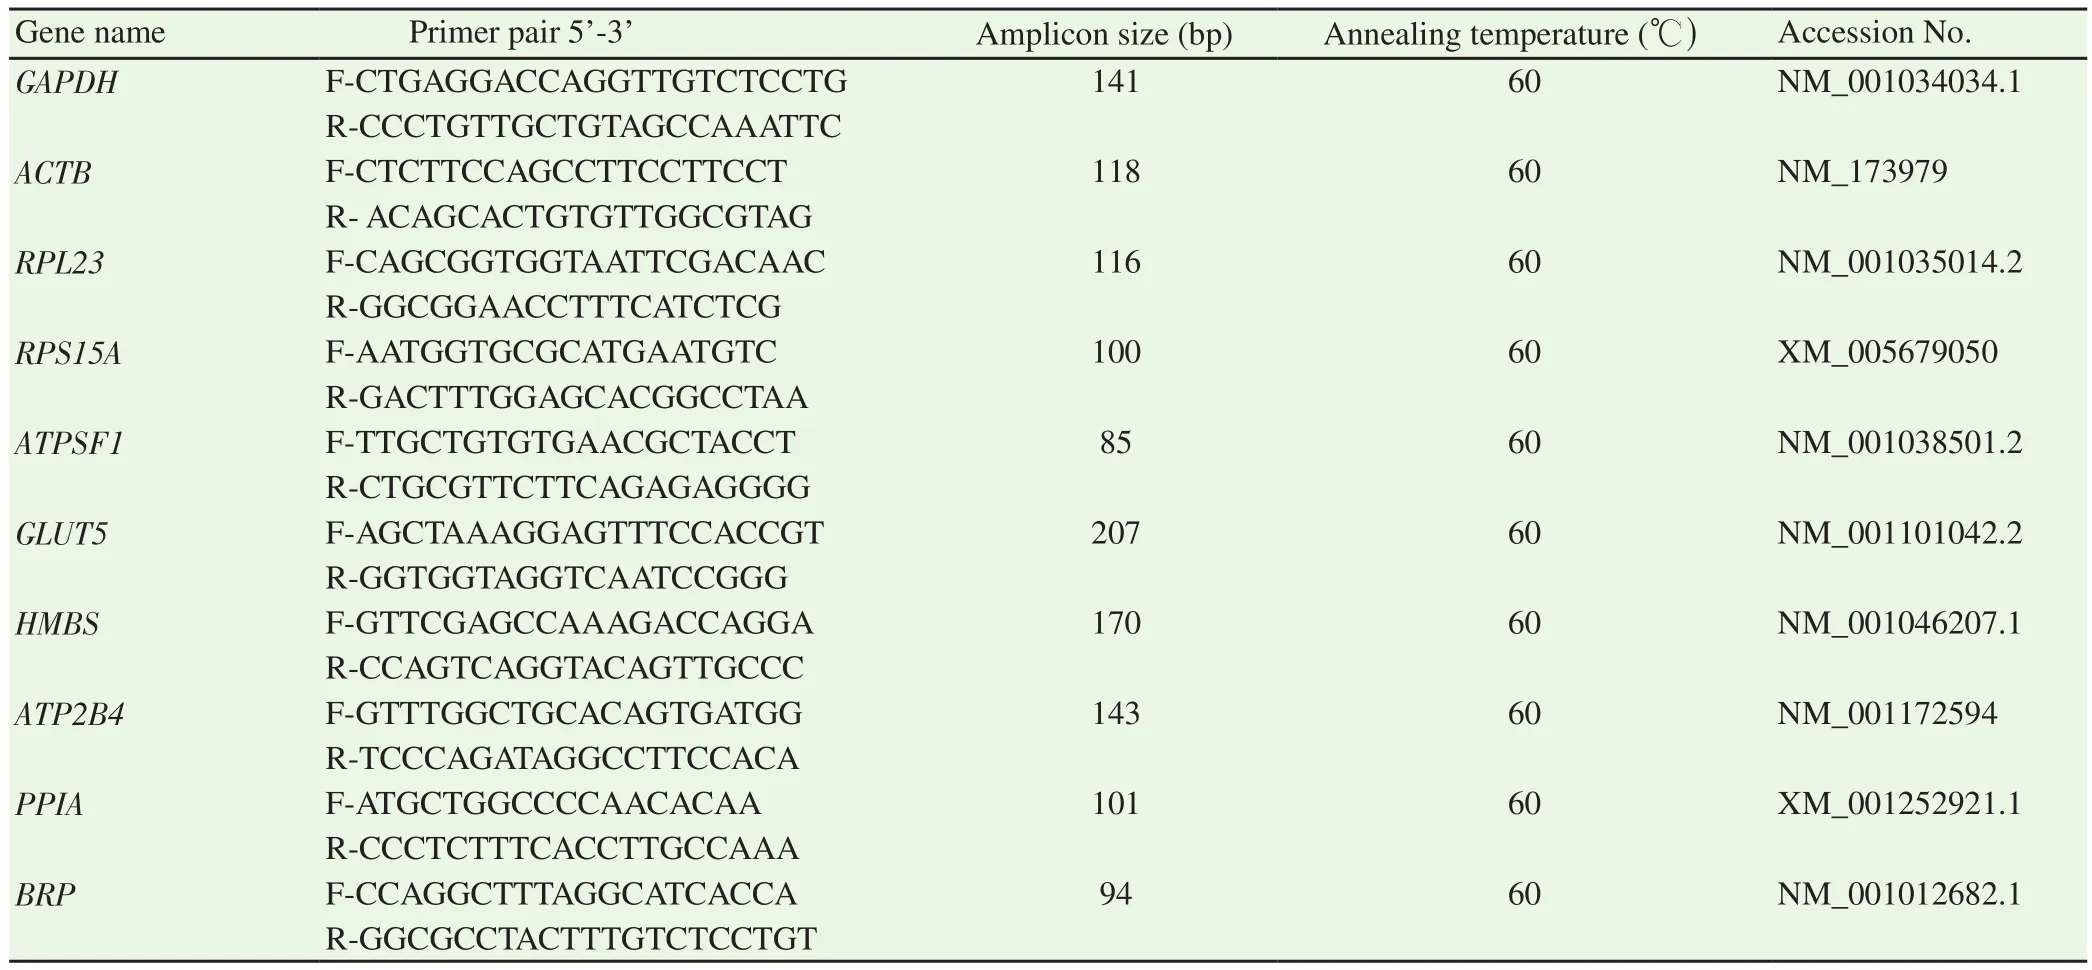
Table 1.List of housekeeping genes used in the study and their annealing temperatures.
RefFinder algorithm compared the stability of the genes by using different algorithms viz.Genorm, Normfinder, Delta Ct, and the Bestkeeper and provided the comprehensive ranking for the reference genes.The gene with the lowest-ranked geometric mean was considered highly stable.
2.6.Ethics statement
The experimental procedure was duly approved by the Institute Animal Ethics Committee (CPCSEA/IAEC/LA/SRS-ICAR-NDRI-2019/No.18) and performed per relevant guidelines and regulations.
3.Results
All the ICGs showed a single peak in melt curves and appropriate amplicon size in 2% agarose gel electrophoresis (Supplementary Figure 1).The qPCR expression data of all the ICGs for both Zebu and crossbred testes were collected in the form of Ct values(Figure 1), which were further subjected to different algorithms either as raw data values or after converting in expression quantities.
3.1.Analysis of gene expression stability by geNorm
geNorm algorithm ranked the ICGs from most stable (lowest M value) to least stable (highest M value) genes separately for both Zebu and crossbred testes (Figure 2).ATPSF1 and RPL23(M value=0.365) were the most stable genes for crossbred testes,whereas ATPSF1 and HMBS were the most stable genes in Zebu cattle testes (M value=0.492).ATP2B4 and GLUT5 were the least stable genes in both groups having M values above the acceptable range (< 1.5).Further, the pairwise variation analysis(V value) identified the optimal number of ICGs essential for the normalization of expression data.For this, genes were sequentially added in decreasing order of stability to the combination of two most stable genes for both Zebu (ATPSF1 and HMBS) & crossbred testes (ATPSF1 and RPL23) and the V values were calculated after addition of third (V2/V3), fourth (V3/V4), fifth (V4/V5), and so on until the recommended threshold, cut-off value (0.15) was achieved.In the case of Zebu testes, the addition of the 4th gene gave the V3/V4 value of 0.158; therefore, the combination of four most stably expressed genes viz.ATPSF1, HMBS, BRP, and RPL23 was considered as the panel of most stable ICGs.Regarding crossbred testes, the panel of most stable ICGs included ATPSF1, RPL23, and ACTB with a V2/V3 value of 0.188.
3.2.Analysis of gene expression stability by NormFinder
The NormFinder based expression stabilities of 10 ICGs were determined after converting the Ct values into relative quantities.The NormFinder based ranking of ICGs was given in Figure 3.For Zebu testes, ATPSF1 was found to be the most stable gene with stability value 0.170, followed by HMBS, PPIA, and RPS15A with stability values of 0.266, 0.447, and 0.489, respectively.The panel of three most stable genes for crossbred testes was PPIA, ATPSF1, and BRP with stability values 0.198, 0.232, and 0.285, respectively.
NormFinder analysis revealed both inter and intragroup variations in the expression of ICGs.In Zebu testis, ATPSF1, HMBS, and PPIA were found to be the most stable ICGs, whereas PPIA, ATPSF1,and BRP were the most stable ICGs in crossbred testis.On the other hand, BRP, RPS23, and ATPSF1 were the most stable ICGs in both the breeds.
3.3.Analysis of gene expression stability by Best keeper
Bestkeeper ranked the ICGs in both the groups based on standard deviation and coefficient of variation in gene expression (Table 2).The stable panel of ICGs for Zebu testes was HMBS, ATPSF1,RPS15A, and GLUT5 with the lowest standard deviation values of 0.39, 0.51, 0.65, and 0.71, respectively.The panel of most stably expressed ICGs for crossbred testes was RPL23, ATPSF1, and HMBS, with the lowest standard deviation values of 0.35, 0.39, and 0.49, respectively.
3.4.Analysis of gene expression stability by RefFinder
RefFinder analysed the ranking of geNorm, NormFinder,Bestkeeper, and Delta Ct algorithms to provide a more refined stability order of ICGs.The stability order of ICGs based on geomean of ranking values, as depicted in Figure 4.Moreover, the ranking of ICGs based on their expression stability, as determined by all the algorithms investigated in the present study as well as the comprehensive ranking by the RefFinder, were presented in Table 3.Based on the comprehensive ranking, we determined the panel of four genes viz.ATPSF1, HMBS, PPIA, and RPS15A as the most stable ICGs for Zebu testes, whereas ATPSF1, RPL23, and PPIA for crossbred testes.
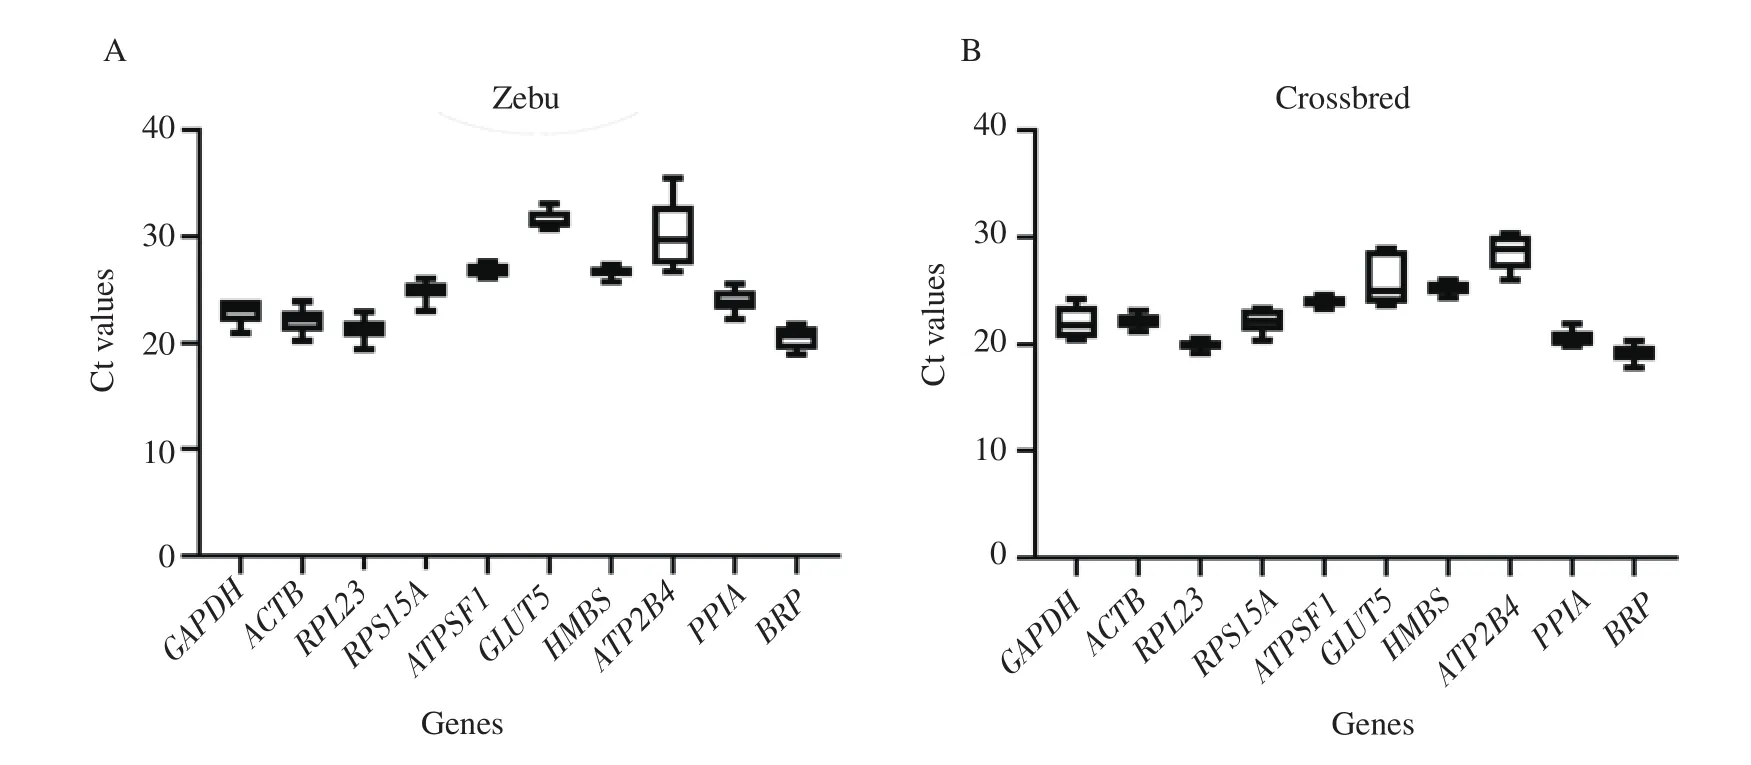
Figure 1.Overall expression pattern of 10 candidate internal control genes evaluated in Zebu testes (A) and crossbred testes (B).The data are presented as qPCR cycle threshold (Ct) values of each gene in the box-whisker diagram.The median is shown as a line across the box, while whiskers indicate maximum and minimum values.
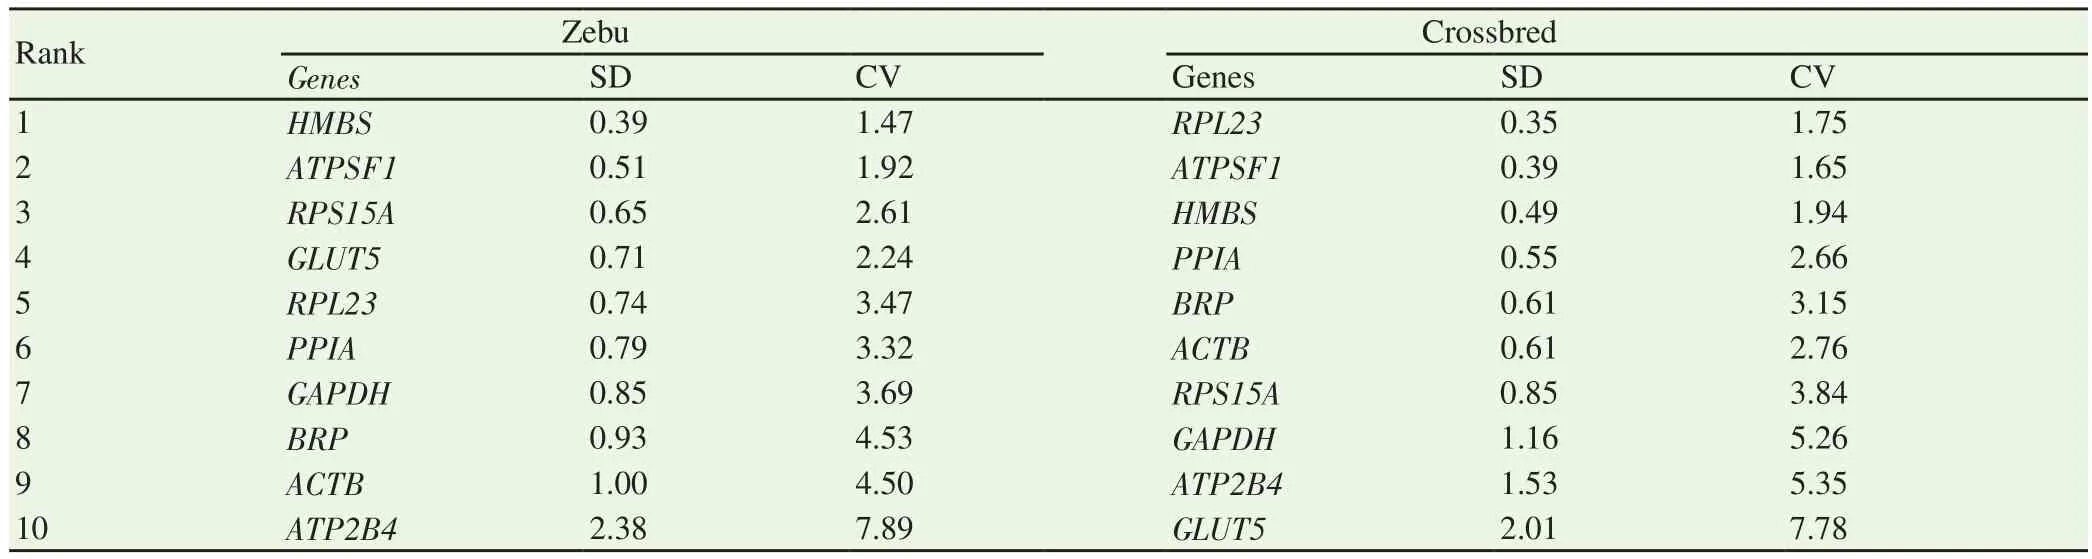
Table 2.Expression stability of candidate reference genes as calculated by the Bestkeeper.

Figure 2.geNorm based average expression stability measure (M) for internal control genes in Zebu testes (A) and crossbred testes (B).A' and B' are corresponding values of pairwise variation (V) of normalization factor ratios of different genes.Genes are sequentially added in decreasing order of stability to the combination of two most stable genes for both Zebu (ATPSF1 and HMBS) and crossbred testes (RPL23 and ATPSF1 ) and the V values were calculated after addition of third (V2/V3), fourth (V3/V4), fifth (V4/V5), and so on until the recommended threshold, cut-off value (0.15) is achieved.
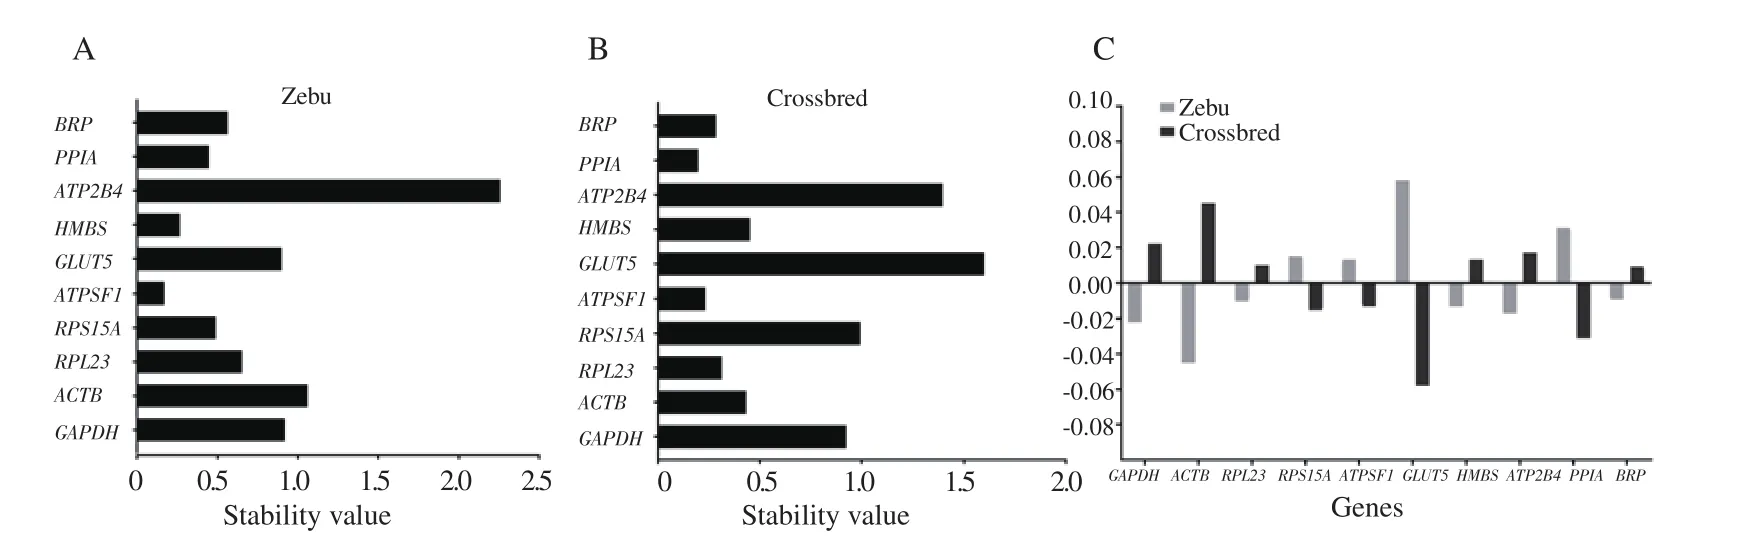
Figure 3.NormFinder-based intragroup (A, B) and intergroup (C) variation analysis of candidate internal control genes in Zebu and crossbred testes.

Figure 4.RefFinder based comprehensive ranking of stability of internal control genes in Zebu (A) and crossbred (B) testes.

Table 3.Expression stability and ranking of the 10 candidate housekeeping genes as calculated by RefFinder.
4.Discussion
Several studies have demonstrated the significance of ICGs to normalize the expression data under specific experimental conditions.The selection of stable ICGs is of extreme importance for this purpose as even the selection of one wrong ICG could lead to faulty interpretation of the minute difference in the target gene expression.The chosen ICGs should exhibit stable expression among various sample types (cell/tissue/developmental stages) or experimental conditions.Therefore, the use of multiple ICGs is deemed as an appropriate method for the accurate normalization of gene expression data.To select the stable ICGs for a given experimental condition, several algorithms are available such as geNorm, NormFinder, BestKeeper, and Reffinder that facilitate the accurate identification of the panel of stable ICGs for this purpose.
Considering the differences in the fertility status of crossbred and Zebu cattle, several studies have been carried out to identify the transcriptomic differences between these breeds, and few transcripts have been identified, which could be the promising markers for fertility[31-33].However, the validation of these transcripts requires the identification of stable ICGs for Zebu and crossbred testes,although any information regarding the evaluation of the stability of ICGs in Zebu and crossbred testes is still unavailable.The 10 ICGs were chosen from different functional classes based on the assumption that the genes having similar functions would be regulated similarly, thus could drift the inference from the actuality.All the ICGs selected in the present study were expressed in both Zebu and crossbred cattle.These genes showed a single melting peak in qPCR, and appropriate amplicon size was observed in agarose gel electrophoresis.Subsequently, the expression stability of all the ICGs was measured by using geNorm, Normfinder, Bestkeeper,and RefFinder tools.All the four algorithms above were utilized successfully in the present study to identify the panel of ICGs with stable expression in testes samples from Zebu and crossbred bulls.
The comprehensive ranking by RefFinder showed that ATPSF1,HMBS, PPIA, and RPS15A were the most reliable and stable ICGs for Zebu testes, whereas ATPSF1, RPL23, and PPIA for crossbred testes.Earlier, Vandesompele et al[17]recommended the use of at least three most stable ICGs for calculation of qPCR normalization factor (NFn, n=3).Therefore, we determined the optimal number of ICGs for normalization of gene expression data by pairwise variation analysis (V value) using the geNorm algorithm.We found that for Zebu testes, a panel of four ICGs with a V3/4 value of 0.158, and three ICGs with V2/3 value of 0.188 was found suitable for crossbred testes.These V values were close to the suggested threshold value of 0.15 by Vandesompele et al[17].
Further, it was observed that ATP2B4, ACTB, and GAPDH were the three least stable reference genes in testes samples from Zebu bulls,whereas GLUT5, ATP2B4, and RPS15A were the unstable reference genes in crossbred testes.The highest variability in expression of these reference genes renders them unsuitable to be used for the normalization of expression data.Although GAPDH and ACTB are the most commonly used ICGs in qPCR studies across the species and tissues/cells, and even have been used as single reference genes for normalization of gene expression data in numerous earlier reports, their expressions were found to be unstable in the present study.Our results affirm the notion that the use of single ICG for normalization of gene expression data across all the tissues and species might lead to erroneous results.
Majority of the previous studies aimed at evaluating the stability of ICGs in testis among various other tissues from the same species.In this context, a previous study in buffalo reported RPS23, RPS9,RPL4, and UXT as the most stable ICGs for twelve different tissues,including testis, although GAPDH and ACTB remained unstable[22].Contrastingly, a combination of B2M and GAPDH exhibited the least variability in equine testes[34].Likewise, PPIA, GAPDH, and ACTB were the most stable ICGs for developing mouse testis[35].The discrepancy among these results may be attributed to the variations in experimental procedures in terms of the use of testis samples either alone or in combination with several other tissues.Moreover,the sets of ICGs chosen for the investigation were also different in all the studies.Based on these observations, it can be elucidated that the careful selection of the stable ICGs for any cell type or tissue of interest is strongly recommended for the correct interpretation of qPCR results.
The present study was confined to identify the stable ICGs in two breeds of cattle only.However, there are several other commonly used ICGs reported that were out of the scope of this study.Future research should focus on identifying the stable ICGs in multiple breeds of cattle, incorporating a higher number of candidate internal control genes.
In conclusion, our results demonstrated that a panel of most stable ICGs for normalization of qPCR data in testes samples from Zebu bulls was ATPSF1, HMBS, PPIA, and RPS15A, whereas ATPSF1,RPL23, and PPIA were found to be the most stable ICGs for crossbred testes and their geometric means would provide accurate normalization for gene expression data in Zebu and crossbred testes.
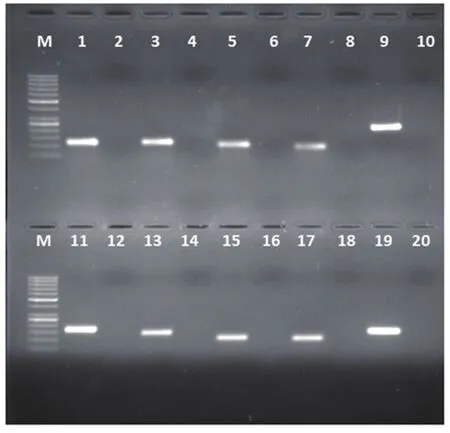
Supplementary Figure 1.Quantitative real-time PCR products for various housekeeping genes in bovine testes.M: 50 bp DNA marker.1: ACTB (118 bp);3: RPL23 (116 bp); 5: RPS15A (100 bp); 7: ATPSF1 (85 bp); 9: GLUT5 (207 bp); 11: HMBS (170 bp); 13: ATP2B4 (143 bp); 15: PPIA (101 bp); 17: BRP (94 bp); 19: GAPDH (141 bp).2, 4, 6, 8, 10, 12, 14, 16, 18, 20: non-template control.
Conflict of interest statement
None of the authors have any conflict of interest to declare.
Funding
The present study was carried out under the project “Molecular markers for improving reproduction in cattle and buffaloes” under the funding of Bill and Melinda Gates Foundation, USA and Indian Council of Agricultural Research - National Dairy Research Institute.
Authors’ contributions
Pradeep Nag and Ankur Sharma conducted experimental studies and data analysis.Elango Kamaraj and Nilendu Paul contributed to the literature search and manuscript preparation.Tirtha Kumar Datta and Ayyasamy Manimaran contributed to research design and manuscript preparation.Sakthivel Jeyakumar and Kerekoppa P.Ramesha performed data acquisition & analysis, manuscript editing,and review.Arumugam Kumaresan contributed to the concept,definition of intellectual content, manuscript review, and guarantor.
杂志排行

Asian Pacific Journal of Reproduction的其它文章
- Possible links between COVID-19 and male fertility
- Predictors of caring behaviors of mothers of premature infants based on the health belief model
- Protective and therapeutic effect of protocatechuic acid in assessment of letrozoleinduced polycystic ovary syndrome in rats
- Semen collection methods and cooling rates affect post-thaw sperm motility and kinematic parameters of Saanen goat