Measurement of tungsten impurity spectra with a two-crystal X-ray crystal spectrometer on EAST
2020-08-26LiangHE何梁JunCHEN陈俊FudiWANG王福地JinjiaCAO曹锦佳HongmingZHANG张洪明JiaFU符佳YingyingLI李颖颖YichaoLI李义超BinBIN宾斌QingjiangYU余青江ShunkuanWAN万顺宽JinYANG杨进XunyuWANG王勋禹BoLYU吕波4andXueyuGONG龚学余
Liang HE (何梁), Jun CHEN (陈俊), Fudi WANG (王福地),Jinjia CAO (曹锦佳), Hongming ZHANG (张洪明),4, Jia FU (符佳),Yingying LI (李颖颖), Yichao LI (李义超), Bin BIN (宾斌),Qingjiang YU (余青江), Shunkuan WAN (万顺宽), Jin YANG (杨进),Xunyu WANG (王勋禹), Bo LYU (吕波),4and Xueyu GONG (龚学余)
1 Institute of Plasma Physics, Chinese Academy of Sciences, Hefei 230031, People’s Republic of China
2 School of Nuclear Science and Technology, University of South China, Hengyang 421001, People’s Republic of China
3 Department of Engineering and Applied Physics, University of Science and Technology of China, Hefei 230026, People’s Republic of China
4 Authors to whom any correspondence should be addressed.
Abstract Spectral measurement of tungsten (W) impurity is essential to study impurity transport.Therefore, an X-ray crystal spectrometer (XCS) on EAST was used to measure the line spectra from highly ionized W ions. On EAST, both poloidal XCS and tangential XCS have been developed to measure the plasma temperature as well as the rotation velocity.Recently,He-like and H-like argon spectra have also been obtained using a two-crystal setup.W lines are identified in this study.Through a careful analysis,the W lines of 3.9336,3.9321,and 3.664 Å are found to be diffracted by He-like or H-like crystals.The lines are confirmed with the NIST database.We also calculated the ion temperature with Doppler broadening of these lines.The ion temperature from the W lines is entirely consistent with that from Ar line spectra.The measurement of these W line spectra could be used to study W impurity transport in future work.
Keywords: tungsten spectra, X-ray crystal spectrometer, two-crystal
1. Introduction
As the main plasma facing component material of the future fusion reactor, tungsten (W) has high heat and erosion resistance and low sputtering yield. However, W is highZimpurity and is prone to accumulate in the plasma core,leading to radiation loss,cooling of the plasma core,and even disruption. Impurity behavior plays one of the key roles in a steady-state operation with a high performance in magnetic confinement fusion devices since impurity results in energy loss by impurity radiation and dilutes the main ions [1]. In a fusion reactor, a central W concentration of only 3 × 10⁻⁵increases the minimum triple product for ignitionnTτ Eby 20% and at 1.9 × 10⁻⁴the ignition condition cannot be satisfied[2].Radiation loss from heavy ion impurity can cool down the main ions and quench plasma with heavy impurity accumulation in the core[3-5]. W transport has been studied in several fusion devices, e.g. ASDEX Upgrade [6]and JET[7]. W has been chosen as the material for divertor plates in ITER due to its high heat resistance and high erosion resistance. How to control the W content is a major challenge for the future fusion reactor to achieve steady-state operation[8].
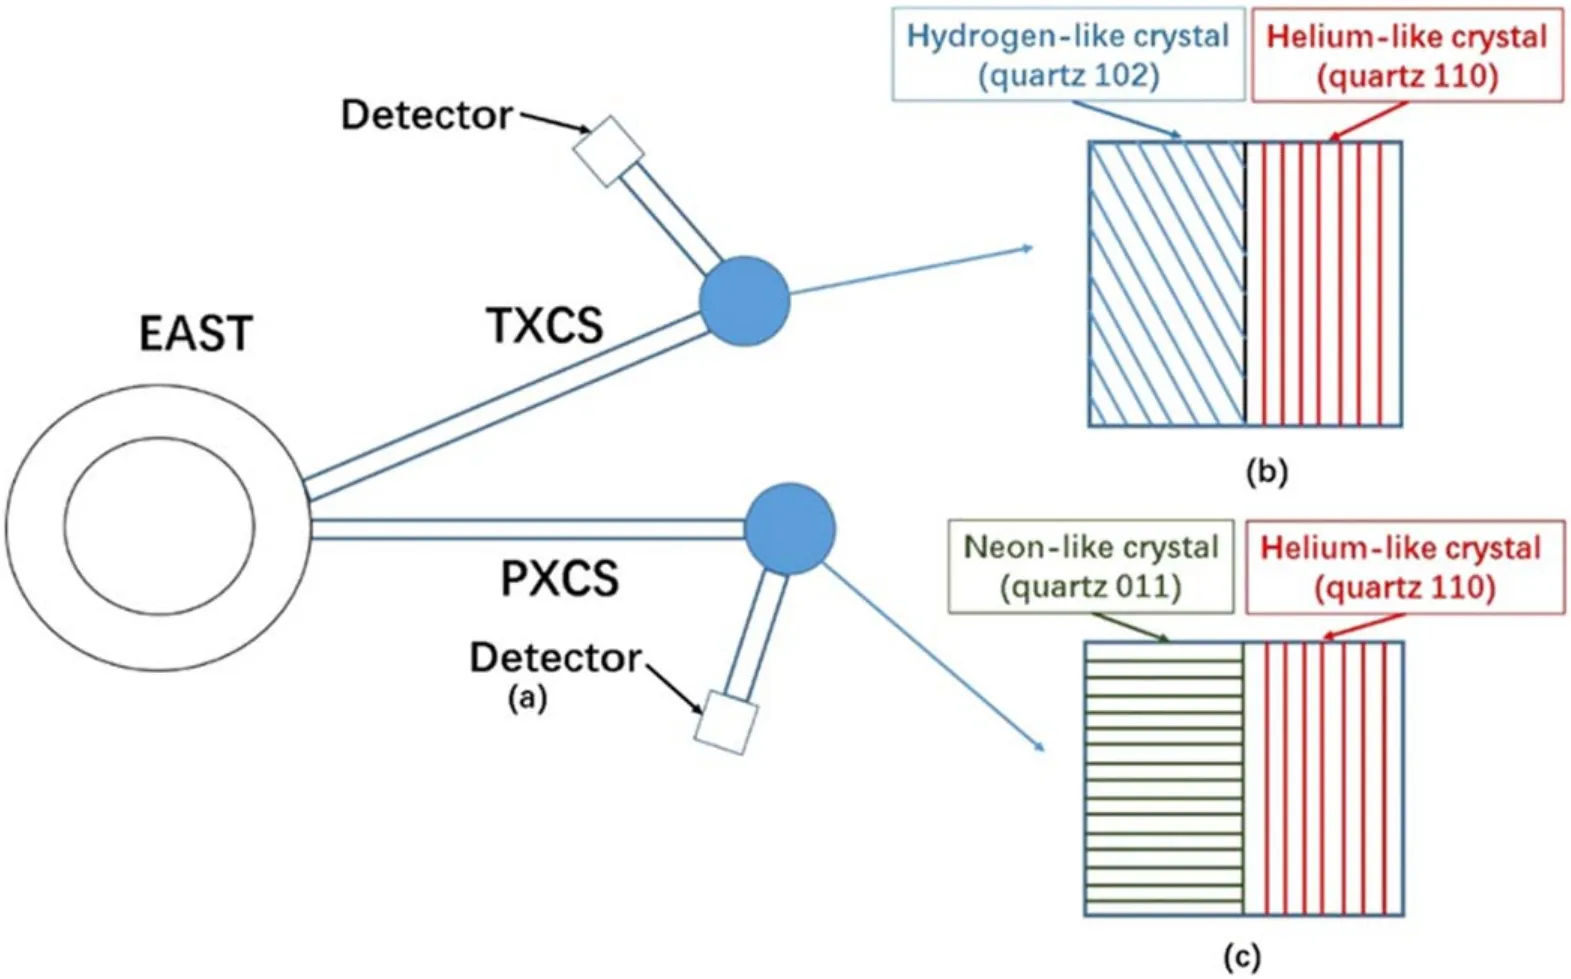
Figure 1. (a) Top view of the XCS on EAST. (b) and (c) are a two-crystal assembly in the TXCS and PXCS, respectively.

Table 1. Parameters of the two spectra crystal for the PXCS.
W divertor plates have also been applied in EAST [9].However, plasma disruption often occurs when W impurity accumulated in the core region. It is a crucial issue to control impurity accumulation in the core region in order to achieve high performance and stable discharge in EAST.Therefore,it is important to study the W impurity transport by measuring impurity emissions from the core plasma.
In order to observe the W emissions from the core region,several grazing-incident extreme ultraviolet (EUV) spectroscopies have been developed on EAST [10-13]. W line emission has been measured from different ionization stage ions, i.e., W26+-W45+. However, most of the W line spectra in the EUV range are overlapped due to the complicated configuration of the electron energy levels, which is difficult to resolve with the spectral resolution of the widely used EUV spectroscopies. An X-ray crystal spectrometer (XCS) has been developed on EAST to measure ion temperature and plasma rotation by analyzing argon (Ar) spectra [14, 15].Many newly appeared impurity lines,besides Ar line spectra,were observed after W divertors were commissioned on EAST. It is thought that some of these lines are from W.Since the spectral resolution of XCS is much better than that of EUV spectroscopy on EAST, it has become possible to identify individual line spectra with XCS.
In this paper, the newly appeared impurity lines are identified. The experimental setup of an XCS on EAST is described in section 2. Then, the experimental results are shown in section 3. Finally, this paper is summarized in section 4.
2. Experimental setup
As one of the key diagnostics on EAST, two sets of XCS have been developed on EAST to measure ion temperature and plasma rotation. One is a poloidal XCS (PXCS) and the other is a tangential XCS(TXCS)[16].The PXCS and TXCS are installed at port C on EAST, as shown in figure 1. The TXCS is used to measure ion temperature and the toroidal rotation of plasma[17],and the angle between the TXCS line of sight and the major radial direction is 22.5°.As the electron temperature of EAST plasma gradually rises, a two-crystal assembly is placed in the XCS to extend the temperature measurement limit while ensuring the original measurement capability. Figure 1(b) shows Ar16+and Ar17+spectra lines from the TXCS measured with quartz 102 and quartz 110 crystal, respectively [18]. Ar16+and Ar17+line spectra represent helium-like (He-like) and hydrogen-like (H-like)spectra lines, respectively [19]. Figure 1(c) shows Xe44+and Ar16+line spectra in the PXCS with quartz 011 and quartz 110 crystal, respectively. Xe44+and Ar16+spectra lines are neon-like (Ne-like) and He-like spectra lines, respectively[20]. The Ne-like spectra line is from the second order diffraction.
The parameters of the two-crystal assembly of the PXCS are shown in table 1.Line spectra from Xe44+and Ar16+ions are measured by the PXCS with quartz 011 and quartz 110 crystals, respectively. Typical wavelengths of Xe44+and Ar16+are 2.7368 and 3.9494 Å, respectively. The latticespacing 2dof the quartz 011 and quartz 110 crystals are 6.686 and 4.913 Å, respectively.

Table 2. Parameters of the two spectra crystal for the TXCS.
Table 2 shows the parameters of the two-crystal assembly in the TXCS. As the main measured impurities Ar16+and Ar17+in the TXCS system, the typical wavelengths of Ar16+and Ar17+are 3.9494 and 3.7311 Å, respectively. The 2dof the quartz 110 and quartz 102 crystals are 4.9130 and 4.5622 Å, respectively. The Bragg angles for the quartz 110 and quartz 102 crystals are 53.5010° and 54.8432°, respectively.
3. Experimental results
The incident light diffracted by the crystal are recorded by a two-dimensional detector with 487 pixels in the dispersion direction and 1891 pixels in the spatial resolution direction.The size of each pixel is 172 × 172 μm2.The wavelength can be relatively calibrated according to the dispersion relationship based on Bragg diffraction. Although an absolute wavelength calibration has been proposed to be done based on the fluorescence from an external X-ray tube, absolute wavelength calibration is still not finished at present. Therefore,a relative wavelength is calculated from one known line,e.g. thewline of the He-like Ar16+, in order to infer the unknown lines. For example, the wavelength calculation λ based on thewline can be described as

whereθwis the Bragg angle of thewline,θλis the Bragg angle of the other lines,Pwis the pixel position of thewline,λPis the pixel position of the other lines, ΔXis the pixel size with a width of 172 μm,Ris the curvature radius of the spherical crystal, and 2drepresents double lattice spacing.
Figure 2 shows the typical spectra from a TXCS for one discharge with the plasma currentIpof 500 kA heated with a lower hybrid wave (LHW) of 2.3 MW and electron cyclotron wave (ECW) of 0.2 MW. The electron temperature in the core regionTe0from the TXCS is about 2.5 keV. It can be seen clearly that He-like Ar16+spectra in the left side and H-like Ar17+spectra in the right side are recorded simultaneously and that the gap between them is large enough to distinguish each other. Although the relative abundance of Ar16+is lower than that of Ar17+when the core electron temperatureTeis higher than 2 keV,the intensity of Ar16+is still stronger than that of Ar17+due to the line integration effect becauseTein the edge region is lower than 2 keV. It should be mentioned that the spectra from the He-like crystal(quartz 110) are actually overlapped by those from the H-like crystal (quartz 102). For the discharge shown in figure 2, Ar16+or Ar17+merely provides some negligible background to the other.
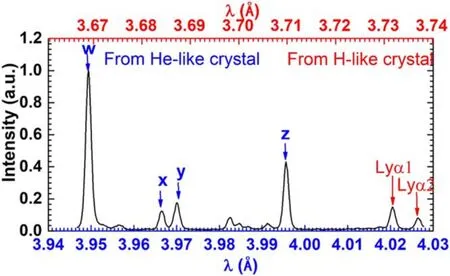
Figure 2. He-like and H-like spectra observed by the TXCS.
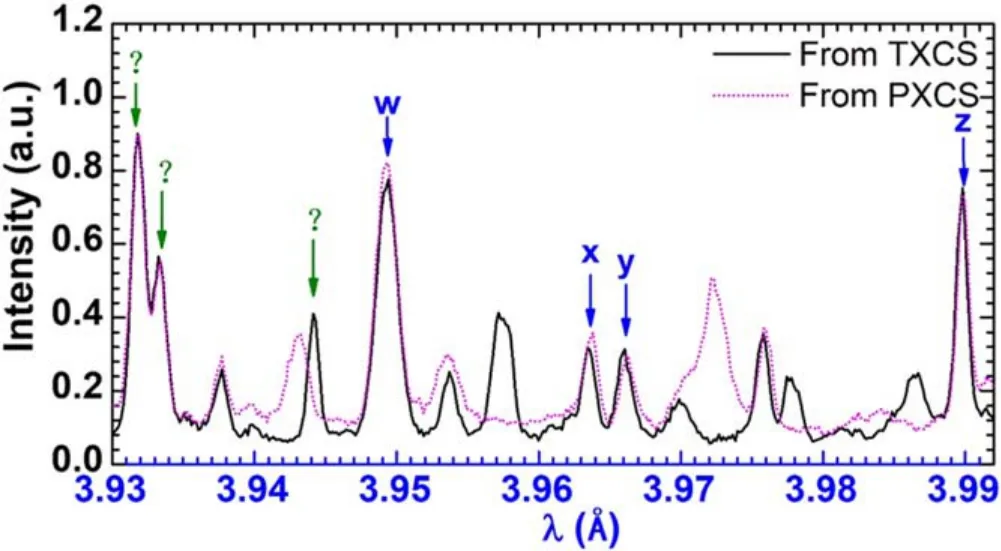
Figure 3.Spectra observed by the TXCS and PXCS with a rotating crystal.
In order to achieve the goal of long pulse discharges with high confinement, in recent years, an upper W divertor with W plates has been installed and high-power auxiliary-heating systems for electrons have been upgraded on EAST as well.Te0has been greatly enhanced since the upgrade. In highTe0discharges, some additional impurity lines have been observed by the XCS [18]. Figure 3 shows the spectra from the TXCS and PXCS.Since each XCS consists of two sets of spectra due to the two-crystal assembly, it is helpful to calibrate the spectra with the same line in order to confirm which crystal the spectra are diffracted from.Therefore,thewline of Ar16+is chosen as the reference because both the TXCS and PXCS have the capability of measuring He-like Ar16+. By using this method, the impurity lines diffracted from quartz 110 will be located in the same position and those from the other crystals (quartz 102 for Ar17+or quartz 011 for Xe44+)could show different line shifts. The impurity lines except Ar16+and Ar17+in the long wavelength side of Ar16+wline have been investigated in previous works as shown in figure 3[20].W and Mo from the plasma facing components could be the candidate.Therefore,more attention is paid to those in the short wavelength of the Ar16+wline.

Table 3. W atomic spectra from the NIST database.
The wide observed wavelength range of the XCS is achieved by moving the detector,which is installed on the rail driven by a linear slider [16]. As a result, the spectra of interest in the short wavelength range can be recorded when the detector is moved toward the short wavelength direction.As shown in figure 3,some strong impurity lines are observed on the left side of the Ar16+wline in one discharge with an upper single null configuration. Three lines among them are observed in both the TXCS and PXCS, one ‘two-peak’structure and one single line,are located at the same position.Therefore, all these lines are diffracted from quartz 110 as discussed before. With the assumption of the first order diffraction, their wavelengths are calculated according to equations(1)and(2)and are approximately 3.932,3.933,and 3.937 Å, respectively. By comparing to the NIST Atomic Spectra Database, the ‘two-peak’ structure could be the spectra of W45+[21, 22], which is also confirmed on the ASDEX Upgrade[23].However,another characterized W45+line with high intensity near the Ar16+xline on the ASDEX Upgrade is not observed here. As for the single line, there is no identification at present. In addition, another uncharacterized single line near the Ar16+wline is found in both the TXCS and PXCS. Since they appear in different locations,the line in the TXCS should be diffracted from quartz 102.The wavelength of the line calculated by quartz 102 first order diffraction is 3.6644 Å. Based on a comparison with the line spectra in the NIST Atomic Spectra Database, the single line in the TXCS could be the spectra of W44+[24]. Table 3 shows the W atomic spectra from the database [25].
As shown in figure 4, double-Gaussian fitting is used to verify the spectra. Based on Doppler broadening, the ion temperature is obtained by fitting with the mass of the W atom and the wavelength of the two-peak line. It could be seen that the ion temperature calculated from W by the twopeak spectra,Ti,W= 2.65keV is much higher thanTi,Ar=1.47keV of the Ar16+wline att= 4 s. There are multiple W spectral lines overlapping in the wavelength range in the NIST Atomic Spectra Database,which could lead to the higher ion temperature.
In addition, the ion temperature is obtained by single Gauss fitting with the mass of the W atom and the wavelength of the single line as shown in figure 5.The ion temperature of the single line is about 0.2 keV higher than that from the Ar16+wline att= 4 s.Therefore,the ion temperature of the single line is consistent with that of the Ar16+wline.
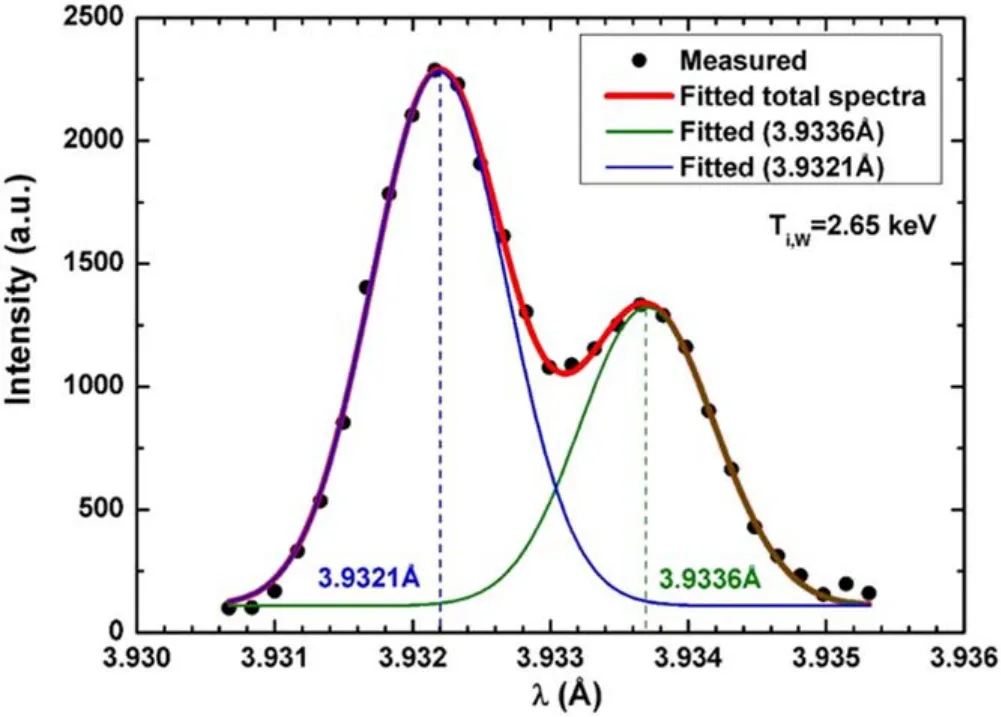
Figure 4.Two peaks fitted by a double-Gauss fitting with ion temperature.
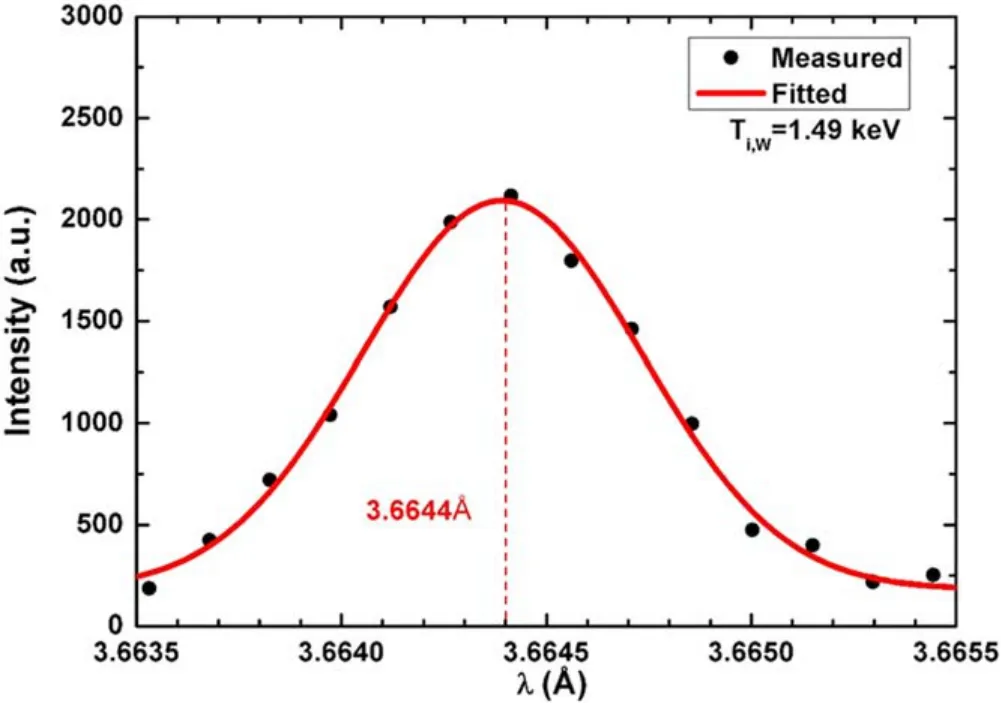
Figure 5.Single peak fitted by single Gauss fitting with ion temperature.
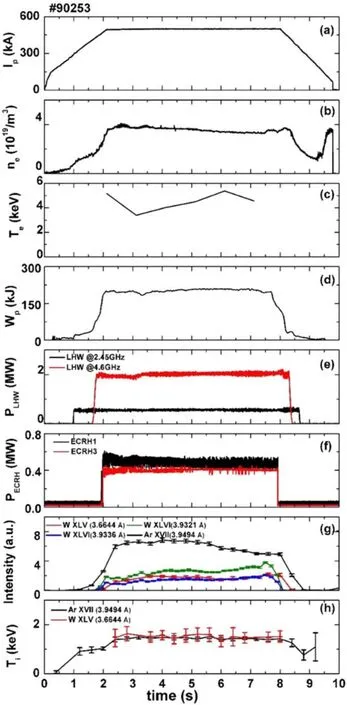
Figure 6. (a) Plasma current, (b) central line average density, (c)electron temperature, (d) stored energy, (e) LHW power, (f) ECRH power,(g)each peak’s spectra intensity,(h)ion temperature with Ar XVII and W XLV.
As shown in figure 6, the discharge (#90253) with a plasma currentIpof 500 kA, an electron densityneof 4.11 × 10¹⁹m−3, and a stored energyWpof 200 kJ was heated with an LHW of 2.5 MW and an ECRH of 0.9 MW.The time evolutions of impurity emissions and the ion temperature are also shown in the figure. As shown in figure 6(h), the time evolution of the ion temperatures calculated from the W44+spectra is almost the same as that calculated from the Ar16+spectra. Thermal equilibrium is expected between two different types of ions in the plasma due to high density, so the single line from W44+could be used to calculate the ion temperature in the core region in future fusion devices. In figure 6(g), the intensities of different W lines show a similar time evolution. However,the time evolutions of the Ar and W line intensities are quite different. The time evolution of the line intensity of the spectra with the two-peak structure is similar to that of the spectra with a single peak, indicating that W lines may exist in the two-peak spectra group.
4. Summary
As heating power increases,several newly appeared impurity spectra are measured by the XCS on EAST. There are three lines observed in the short wavelength side of the TXCS and PXCS simultaneously. These lines consist of a two-peak structure and one single line. On the basis of the Bragg diffraction, they are diffracted by quartz 110 and quartz 102 crystals, respectively. Therefore, the wavelengths of the spectra with the two-peak structure and a single line are 3.932, 3.933, and 3.6644 Å, respectively. Based on a comparison with the line spectra in the NIST Atomic Spectra Database, the line spectra with the two-peak structure and a single line could be spectra of W45+and W44+, respectively.The ion temperature is calculated by the Doppler broadening of the newly appeared impurity lines and well-known Ar lines separately.It is found that the ion temperature calculated from the line spectra with a two-peak structure is much higher than that from the Ar lines,indicating that the line spectra with the two-peak structure is not two simple W lines. However, the ion temperature calculated from the single line is almost similar to that calculated from the Ar line, verifying that this line is emitted by W44+ions. The time evolutions of the line intensities of the line spectra with the two-peak structure and single peak structure are quite similar. Therefore, other W lines could be in the two-peak structure.The W line at 3.6644 Å found in this study is very useful for studying W impurity transport in fusion devices.
Acknowledgments
The authors are grateful to the diagnostic group and the operation team of the EAST tokamak. This work is partially supported by the National Magnetic Confinement Fusion Science Program of China (Nos. 2017YFE0301300 and 2018YFE0301100), the Key Program of Research and Development of the Hefei Science Center (No. 2017HSCKPRD002), National Natural Science Foundation of China(Nos. 11805231 and 11705151), the ASIPP Science and Research Grant (No. DSJJ-17-03), the Anhui Provincial Natural Science Foundation (Nos. 1808085QA14 and 1908085J01), the Instrument Developing Project of the Chinese Academy of Sciences (No. YJKYYQ20180013), the Collaborative Innovation Program of Hefei Science Center,CAS(No.2019HSC-CIP005),the Nature Science Foundation of Hunan Province (2017JJ3268), the Hunan Nuclear Fusion International Science and Technology Innovation Cooperation Base (No. 2018WK4009), and the Key Laboratory of Magnetic Confinement Nuclear Fusion Research in Hengyang(No. 2018KJ108).
ORCID iDs
猜你喜欢
杂志排行
Plasma Science and Technology的其它文章
- Design and control of the accelerator grid power supply-conversion system applied to CFETR N-NBI prototype
- Identification of heavy metal-contaminated Tegillarca granosa using laser-induced breakdown spectroscopy and linear regression for classification
- Automated electron temperature fitting of Langmuir probe I-V trace in plasmas with multiple Maxwellian EEDFs
- The influence of defects in a plasma photonic crystal on the characteristics of microwave transmittance
- Multi-scale interaction between tearing modes and micro-turbulence in the HL-2A plasmas
