γ-Fe2O3@carboxymethyl Cellulose as Potential Oral Nanomedicine for Iron Deficiency Anemia Treatment on Rats
2020-07-16BoChenPengZhaoQiweiWangZhanhangGuoXinLiuYanLiYueZhangMinJiandNingGu
Bo Chen, Peng Zhao, Qiwei Wang, Zhanhang Guo, Xin Liu, Yan Li, Yue Zhang, Min Ji and Ning Gu*
(1.Jiangsu Key Laboratory for Biomaterials and Devices, State Key Laboratory of Bioelectronics, School of Biological Sciences &Medical Engineering, Southeast University, Nanjing 210096, China; 2. Materials Science and Devices Institute, Suzhou Universityof Science and Technology, Suzhou 215009, Jiangsu, China)
Abstract: Oral iron supplements such as ferrous iron salts are major treatment agents for iron deficiency anemia (IDA) due to the convenience of large dose administration and good patient compliance. However, the gastrointestinal adverse impact caused by Fe2+ stimulus and low bioavailability severely impedes its therapeutic effects. In recent years, it has been found that nano iron-based nanoparticles with high surface-to-volume ratio and low iron ion leakage can alleviate the toxic effect and improve the gastrointestinal absorbance. For further clinical development, nano materials need to meet the pharmaceutical quality demand. Carboxymethyl cellulose (CMC) is a significant pharmaceutical ingredient applied in approved drug formulations, and polyglucosorbitol carboxymethylether (PSC) has been utilized in iron-based nanomedicine ferumoxytol synthesis, both of which can be firmly anchored on iron oxide by carboxyl chelation. In this work, iron oxide nanoparticles (NPs) modified with CMC were designed and synthesized, and the structure composition and physicochemical properties were distinctly characterized. Oral supplement effects on rat IDA were investigated and compared with other recently reported iron supplements including NPs modified with PSC. Results show that the oral nano iron supplement achieved the recovery of hemoglobin and serum iron level in only two weeks with high safety. The nano iron oxide modified with pharmaceutical excipients provides new potential approach for oral iron supplement available in clinics.
Keywords: iron oxide nanomedicine; carboxymethyl cellulose; polyglucosorbitol carboxymethylether; oral agent; iron deficiency anemia
1 Introduction
To date, oral nano iron agents are rare in clinics, but several intravenous nano iron supplements have been approved. Ferumoxytol (FMT) is the first nano iron supplement that was approved in 2009 in the USA for the treatment of chronic kidney patients with IDA, and is regarded as “off-label” drug in many preclinical or clinical trials of magnetic resonance imaging (MRI)[10-11]. Owing to the corroborative biocompatibility and magneto responsiveness, FMT has also been employed in many new biomedical fields such as tumor ablation[12-14]and regenerative medicine[15-18]. FMT can be considered as the model drug for the investigation of oral iron-based nanomedicine. Therefore, polyglucosorbitol carboxymethylether (PSC), as the coating material of FMT, is qualified to participate in iron-based nanomedicine construction.
It is well known that carboxymethyl cellulose (CMC) is a typical drug excipient as thickening agent and bulking agent, and dietary fiber in CMC can accelerate intestinal movement and improve the luminal microenvironment[19]. In this work, iron oxide NPs modified with CMC were fabricated as novel oral nano iron supplement, since CMC can effectively bind on the iron oxide surface via the carboxyl groups, which may intensify the iron absorption and ameliorate the adverse impact. Iron oxide NPs modified with polyglucosorbitol carboxymethylether (PSC) were also prepared for comparison, whose nanoscale physicochemical signatures were investigated and gastrointestinal stability was determined. For further evaluation on the iron supplement effect, IDA models in rats were constructed. The iron oxide nanomedicine was added into the feeds for iron-containing diet treatment. The iron supplement effectinvivowas assessed and compared with some recently reported iron supplements, providing new idea for developing oral nano iron supplement available in clinics.
2 Materials and Methods
2.1 Materials
CMC (Blanose©7M1F PH) and PSC were received from Shanghai Chineway Medicinal Ingredients Technology Co., Ltd. and Chiatai Tianqing Pharmaceutical Group Co. Ltd., respectively, both of which are drug use grade. Rat diets with low iron content and different iron supplements were processed by Opensource Animal Diets (Changzhou) Co., Ltd. All reagents, including iron salts, ammonia aqueous solution, and other raw materials, were used as chemical pure grade.
2.2 Methods
2.2.1Synthesisofγ-Fe2O3NPsmodifiedwithCMC(γ-Fe2O3@CMC),γ-Fe2O3NPsmodifiedwithPSC(γ-Fe2O3@PSC),andnakedironoxidewithoutcoatingmaterials
γ-Fe2O3@CMC was synthesized by optimized chemical coprecipitation (Fig.1), following the process as below: CMC (1.5 g) was dissolved with ultrapure water (200 mL) in a three-neck bottle (250 mL) which was placed in water bath (50 ℃). 6 N HCl aqueous solution was dropped into the obtained solution to modulate pH at 2-3 with mechanical stir, and meanwhile nitrogen gas was bubbled to build oxygen-free environment. Then, iron salts solution (300 mg FeCl3·6H2O and 150 mg FeCl2·4H2O in 5 mL water) was mixed with the CMC solution at 50 ℃. Under nitrogen gas bubbling and violent mechanical stir, ammonia aqueous solution (28%, 15 mL) was immediately poured into the solution. Next, rise temperature to 80 ℃ and heat for 1 h with air bubbling. Remove the water bath, stir, and gas, and cool down the solution. Lastly, purify the product with dialysis bag (300 kDa MWCO) and filtrate to obtain γ-Fe2O3@CMC NPs. γ-Fe2O3@PSC with high magnetization was synthesized by using our previously reported method[20-22]. Naked γ-Fe2O3with no materials coating was fabricated with the common coprecipitation method[23], which was used for gastric acid lability test in Section 2.2.3.
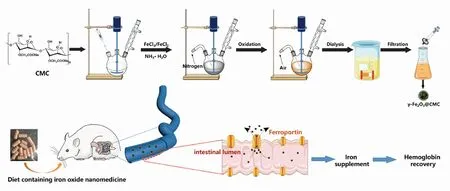
Fig.1 Schematic illusion of γ-Fe2O3@CMC synthesis and iron supplement diet treatment on rats with IDA
2.2.2Characterizationofas-synthesizedironoxidenanomedicine
The microscopic morphology was visualized by TEM images (JEOL 2100) and SEM images (Ultra Plus, Zeiss), and the element analysis was detected by Energy Dispersive Spectrometer attached to SEM. The hydrodynamic size and zeta potential were measured by particle size and potential analyzer (Nano ZS90, Malvern). The crystal properties and structure composition were recorded by X-ray diffractometer (X’TRA, ARL), Fourier transform infrared spectrometer (FT-IR, Nicolet iS50, Thermo), and thermogravimetric analyzer (Pyris 1 DSC, PerkinElmer), respectively. The rheology properties were investigated by rotating variable temperature rheometer (MCR302, Anton Parr). The magnetic hysteresis loop and saturation magnetization were detected by vibrating sample magnetometer (LakeShore 7407). The magnetic susceptibility was measured by magnetic susceptibility balance (Sherwood MK1). The electromagnetic characterization was measured by electron paramagnetic resonance spectrometer (EMX-10/12, Bruker). The iron concentration was measured by inductively coupled plasma mass spectrometry (Optima 5300DV, PE) with physical method and UV-Vis spectrophotometer (UV-3600, Shimadzu, Japan) with chemical colorimetric method. The hematological indexes were determined by automatic blood cell analyzer (BC-2800Vet, Mindray).
The stairs creaked with his weight. He paused by the nursery door, studying the shadowy shapes of the crib and the changing table, the stuffed animals arranged on shelves. The walls were painted a pale sea green. His wife had made the Mother Goose quilt that hung on the far wall, sewing with tiny stitches, tearing out entire panels if she noted70 the slightest imperfection. A border of bears was stenciled71 just below the ceiling; she had done that too.
2.2.3Stabilityandcytotoxicitytestinvitro
1)Simulation gastric acid dissolution test. The operation process followed the methods reported by Pereira and Powell[3,7]. First, add lyophilized γ-Fe2O3@PSC, naked nano γ-Fe2O3, and γ-Fe2O3@CMC powder (4 mg iron respectively) into glass beaker with HCl aqueous solution (pH = 3, 10 mL), and then immediately transfer the solution into oscillating incubator (37 ℃) at the speed of 130 rpm. Take sample solution (200 μL) from the beaker at 10 min, 30 min, and 60 min, and supplement with the same amount of HCl aqueous solution. The dissolved iron was collected by centrifugation and ultrafiltration (MWCO 3 000 Da). The total iron content was 0.4 mg/mL, and the dissolved iron ion concentration was measured by chemical colorimetric method with UV-Vis spectrum.
2)Ultrafilterable free iron. The test was determined by the modified ultrafiltration method reported in Refs.[21,24]. In brief, the iron supplement solution (0.59 mg/mL, 5 mL) was transferred into ultrafiltration centrifuge tube (30 K MWCO). After centrifuging for 30 min at 3 000 g, the amount of iron in the filtrate was determined by 1, 10-phenanthroline colorimetric method.
3)Cell viability assay. Thiazolyl Blue Tetrazolium Bromide (MTT) test was carried out for cytotoxicity assessment. Caco-2 cells were selected as the experiment cell line due to the similarity with intestinal epithelial cell. Caco-2 cells were seeded at 104cells/mL in 96-well plates and incubated for 24 h prior to exposure to different iron concentrations (10-200 μg/mL) of the two nano agents. Then, the cells were processed with MTT assay kit, and the absorbance values were recorded at 490 nm using microplate reader.
2.2.4IDAtreatment
1)IDA rat model construction. Rats (Sprague-Dawley, about four-week old, male) were received from the Medical Laboratory Animal Center of Nanjing Medical University. All the animal experiments were performed in strict accordance with the Animal Research: Reporting ofinvivoexperiments guidelines and were approved by the Institutional Animal Care and Use Committee at the Medical School of Southeast University (Nanjing, China). The rats were divided into two groups fed with low-iron diet and normal diet for 25 d respectively (Table 1), and the body weights of the rats were recorded every fourth day.
2)Hemoglobin content detection: Collect the blood sample from the eyeball of random three rats in each group, immediately transfer the sample into EDTA anticoagulant tube, and store at 16-25 ℃. Detect the hemoglobin content within 4 h.
3)Serum iron content detection: Cut off the tail and collect the blood sample into centrifuge tube. Tilt the tube at 45 degrees to extend the serum precipitation area. Stand for 30 min at 25 ℃, and then transfer them into refrigerator (4 ℃) for more than 5 h. Detect the serum iron content following the instructions of serum iron kit with UV-Vis spectrum at 520 nm.
Table 1 Animal experiment groups for IDA model construction
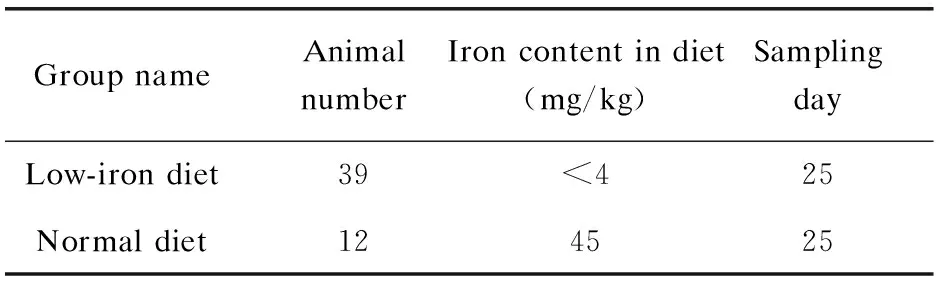
Group nameAnimal numberIron content in diet (mg/kg)SamplingdayLow-iron diet39<425Normal diet124525
4)Iron supplement treatment and blood sample detection. The anemic rats were divided into four groups (9 in each group): a) low-iron diet group (0-2 mg/kg Fe in diet); b) diet containing FeSO4group (45 mg/kg Fe in diet); c) diet containing γ-Fe2O3@CMC group (45 mg/kg Fe in diet); d) diet containing γ-Fe2O3@PSC group (45 mg/kg Fe in diet). Groups b, c, and d were fed with absent iron diet doped with FeSO4, γ-Fe2O3@CMC, and γ-Fe2O3@PSC, respectively. Record the body weights of the rats every third day. Collect blood sample from the eyeball of one rat in each group every other week, and then detect the hemoglobin level. Meanwhile, collect the blood sample of another rat from the tail in each group, and detect the serum iron content following the kit instructions.
2.3 Statistical Analysis
Differences between groups were determined with one-way ANOVA followed the Student-Newman-Keuls test using Sigma Stat version 3.5. The significance level was fixed as *P< 0.05, **P<0.01,n= 3.
3 Results and Discussion
3.1 Synthesis Optimization for Iron Oxide Nanomedicine
CMC and PSC were selected as the coating materials in this work due to their biocompatibilityinvivoas pharmaceutical ingredients in commercial drugs, and thereby gastrointestinal adverse impact can be potentially avoided.
1)γ-Fe2O3@CMC structure and composition: CMC is composed of glucoses withβ-1, 4-glycosidic bond, typically forming hydrogen bonds between molecules, which displays a rigid planar structure. Therefore, CMC presents strong viscidity and low solubility in water. In order to obtain well-dispersed NPs, the fabrication was optimized by extended swelling duration, higher bath temperature, and lower solution concentration compared with γ-Fe2O3@PSC synthesis.
2)γ-Fe2O3@PSC synthesis: γ-Fe2O3@PSC was synthesized based on the method of nanomedicine FMT with the same coating material PSC. PSC is a kind of dextran derivatives constructed by glucose mainly with α-1, 6-glycosidic bond. PSC has long flexible chain and great solubility in water, readily anchoring on iron oxide surface through the carboxyl groups chelating.
3.2 Structure and Physicochemical Properties Analysis of As-Synthesized Nanomedicine
The average iron oxide core size of γ-Fe2O3@PSC (7.38 nm) was close to that of γ-Fe2O3@CMC (7.63 nm) in TEM images (Fig.2(a)-(b)) owing to the same iron salts precursor ratios. The thick layer of CMC wrapped on the particle surface can be observed in SEM images (Fig.2(c)-(d)), which may be attributed to the high content CMC application in the process for effective modification. The ratio of carbon content in γ-Fe2O3@CMC exceeded that in γ-Fe2O3@PSC in the element analysis results, further indicating that more CMC was modified on the crystal surface. Additionally, the naked iron oxide NPs demonstrated large aggregations and clusters due to the absence of stabilizer agent (Fig.S1). The average hydrodynamic diameter of γ-Fe2O3@CMC (45 nm) was evidently larger than that of γ-Fe2O3@PSC (18 nm) (Fig.3(a)), which was consistent with the SEM detection data. XRD results (Fig.3(b)) confirmed that the two iron based NPs have typical maghemite crystal structure (JCPDS card: 39-1346)[21], and the characteristic lattice plane was corresponding to the diffraction fringes in selected area diffraction pattern in TEM images (Fig.2(a)-(b)). FT-IR spectrum (Fig.3(c)) presented the characteristic absorption peaks of the critical functional groups. Specially, the peaks at 1 430 cm-1assigned to -C=O stretching vibration indicated the carboxyl groups in CMC and PSC, the peaks at 1 080 cm-1and 1 010 cm-1assigned to -C-O-C- vibration were the evidence of ether bond in CMC and PSC molecules, and that at 620 cm-1was the signature peak of Fe-O bond. The above results validated the successful construction of PSC and CMC complexing with iron oxide. The thermogravimetic analysis plots (Fig.3(d)) demonstrated that the first inflection points of γ-Fe2O3@CMC and γ-Fe2O3@PSC were at the temperatures of 270 ℃ and 290 ℃ respectively, which were in accordance with the initial decomposition temperatures of CMC and PSC. The nanomaterials surface modification was also presented by zeta potential measurement (Fig.3(e)). The naked Fe2O3was merely -6.93 mV, correspondingly, γ-Fe2O3@PSC was -23.2 mV, and γ-Fe2O3@CMC was -17.1 mV. Compared with the value of the naked particles, the high negative zeta potential values of the two iron-based nanomedicines were due to the carboxyl groups (COO-) in the coating materials extending on the surface, which rendered the nanoparticles more stable dispersion in the solution. The viscosity of NPs was related to the surface materials, and the modulus of γ-Fe2O3@CMC was two order-of-magnitude higher than that of γ-Fe2O3@PSC attributed to the structure discrimination of CMC and PSC (Fig.3(f)).

Fig.2 TEM images and selected area electron diffraction images of (a) γ-Fe2O3@PSC and (b) γ-Fe2O3@CMC; SEM images and element analysis spectrum of (c) γ-Fe2O3@PSC and (d) γ-Fe2O3@CMC
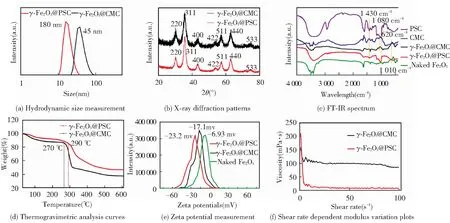
Fig.3 Structure and physicochemical properties characterization of as-synthesized iron supplement
3.3 Magnetic Properties Analysis of As-Synthesized Nanomedicine
Fe2+ion existing in FeSO4displayed regular diamagnetic properties, and γ-Fe2O3showed typical superparamagnetic properties in the two nano agents. As revealed in hysteresis loops (Fig.4(a)), γ-Fe2O3@PSC presented higher saturation magnetization (79 emu/g Fe) than that of γ-Fe2O3@CMC (11 emu/g Fe). The magnetic susceptibility values were in agreement with the results of VSM detection, where γ-Fe2O3@PSC was 26 223×10-6c.g.s/g Fe and γ-Fe2O3@CMC was merely 5 500×10-6c.g.s/g Fe (Fig.4(b)). In addition, γ-Fe2O3@PSC exhibited broadened electron spin spectrum compared with that of γ-Fe2O3@CMC, indicating stronger spin-spin coupling inside the γ-Fe2O3@PSC NPs (Fig.4(c)). The magnetic properties detected above might be relevant to the more ordered and intact surface structure in γ-Fe2O3@PSC than that of γ-Fe2O3@CMC. Hence, based on the characterization results, the magnetic responsiveness order is as below: γ-Fe2O3@PSC >γ-Fe2O3@CMC > FeSO4.
3.4 Stability and Cytotoxicity Evaluation
The stability test in acid demonstrated that γ-Fe2O3@PSC and γ-Fe2O3@CMC have strong tolerance to acid. Concretely, the iron ion concentration reached about 37.5% at 15 min in γ-Fe2O3@CMC solution, while that in γ-Fe2O3@PSC solution was only 25% (Fig.4(d)). As the time extended to 60 min, the former reached 62.5% and the latter was 37.5%, while the rest of the materials still maintained nanoparticle composition, suggesting that the iron absorbance might be absorbed in the form of intact nanostructure. Ultrafilterable free iron concentration is another indispensable parameter for iron supplement stability assessment. Both the nano iron agents were less than 0.1% on the iron ion content (Table 2), which proved that the two agents have excellent biosafety with extremely low iron ion leakage. Besides, the cytotoxicity assay further demonstrated the biosafety of the nano iron supplement (Fig.4(e)-(f)). The Caco-2 cell viability approached to 100%, even though the iron concentration of the two nano agents reached 200 μg/mL. Conversely, Fe (Ⅱ) salt (ferrous sulfate and ferrous ascorbate) was found to evidently reduce Caco-2 cell viability once the iron concentration exceeded 0.5 mM (about 28 μg/mL) in previous experiment[3].
Table 2 Free iron ion detection of nano iron supplement solution
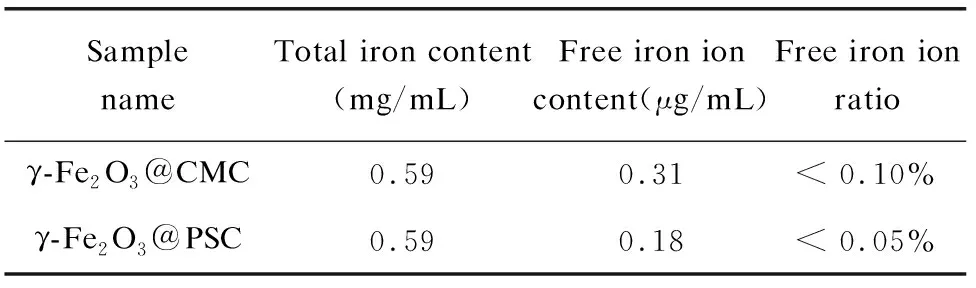
Sample nameTotal iron content(mg/mL)Free iron ion content(μg/mL)Free iron ion ratioγ-Fe2O3@CMC0.590.31< 0.10%γ-Fe2O3@PSC0.590.18< 0.05%
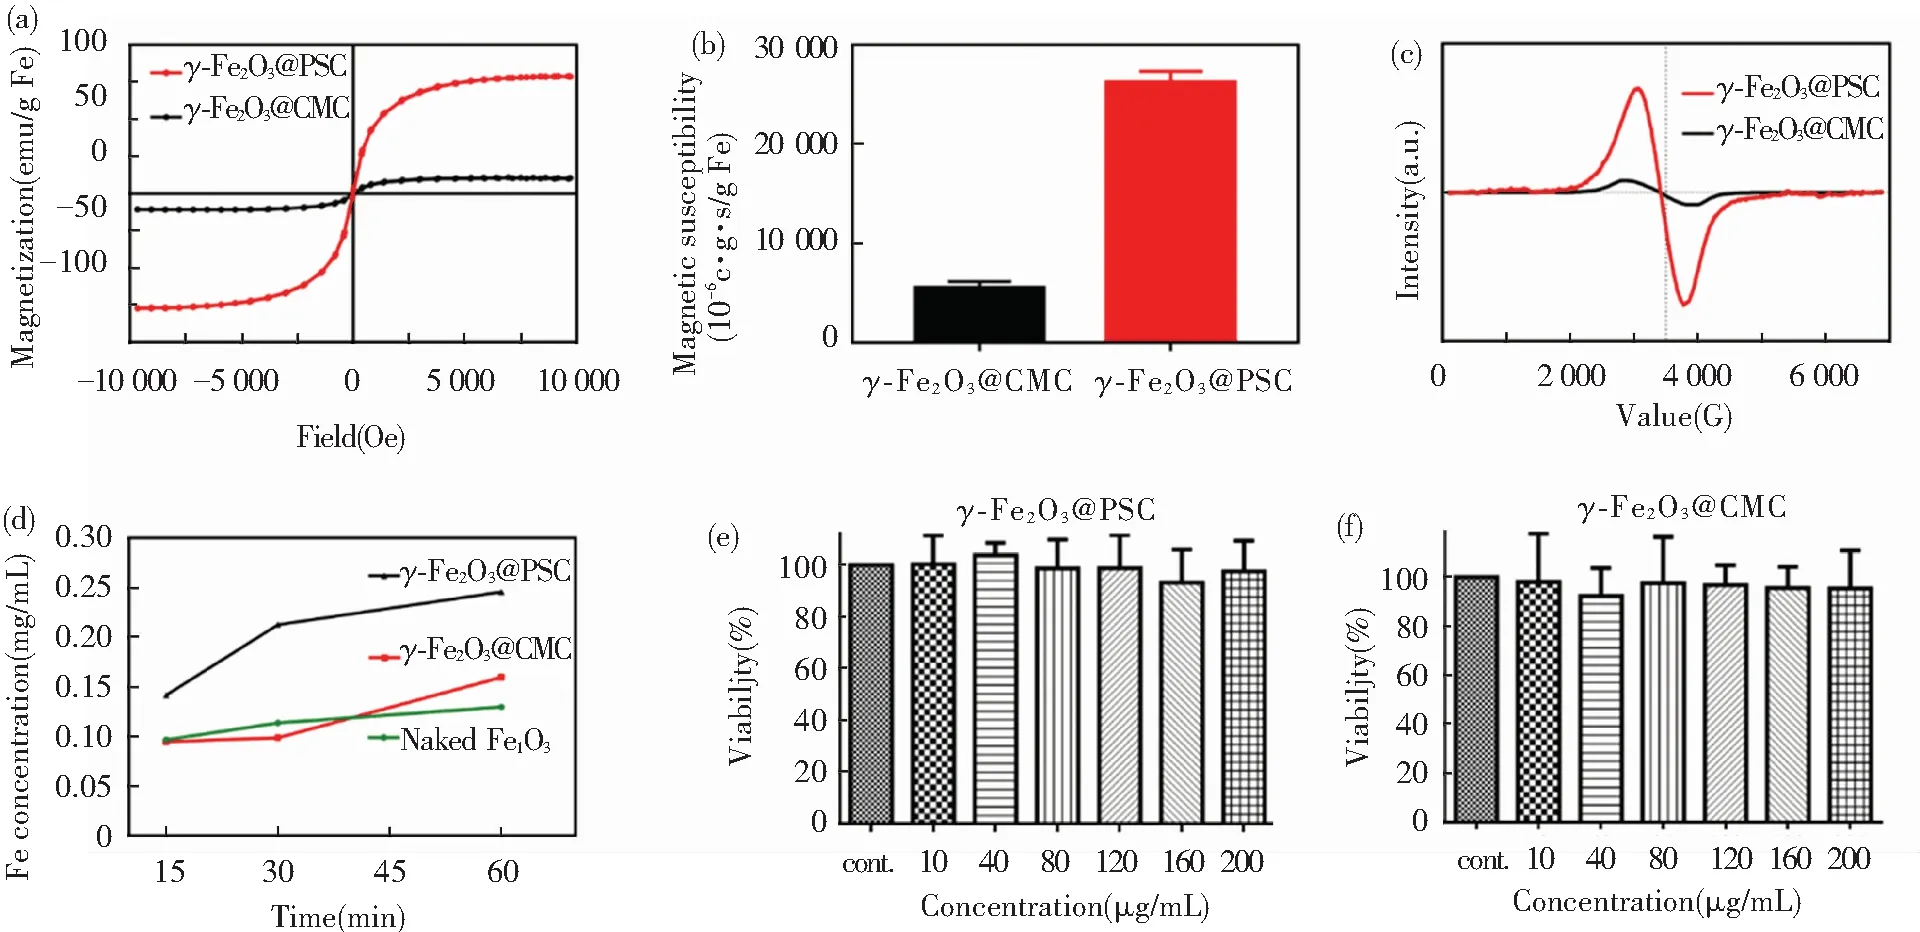
Fig.4 (a)Field dependent magnetic hysteresis loops; (b) Magnetic susceptibility comparison histograms; (c) Frequency dependent electron paramagnetic resonance intensity curves; (d) Acid dissolution iron ion released curves; (e) Caco-2 cell viability after treatment with γ-Fe2O3@CMC at different iron concentrations; (f) Caco-2 cell viability after treatment with γ-Fe2O3@PSC at different iron concentrations (error bars indicate standard deviation,n=3)
3.5 Assessment on IDA Therapy Effect
The bioavailability of the nano iron supplement in normal healthy rats was assessed. After the intragastric (50 mg/kg) and intravenous (1.5 mg/kg) administration of γ-Fe2O3@PSC, the plasma concentrations-time profiles were recorded. As depicted in Fig.S2, compared with intravenous administration, the intragastric iron was scarcely absorbed into the plasma with the highest content less than 6 μg/mL, while the value of the intravenous administration group was 72.1 μg/mL. Other pharmacokinetic parameters of intragastric administration were all inferior to those of the intravenous administration group (Table S1). The extremely low bioavailability (F 0.66%) might be attributed to the normal iron state in healthy rats. The normal rat without iron deficiency symptom could not absorb massive iron. Therefore, the IDA model construction is validated to investigate the iron supplement effect. There are three typical methods adopted in building IDA model, including regular low-iron diet feeding, intragastric administration of low-iron material, and regular bloodletting. Among them, low-iron diet feeding was the mildest with least harm to rats, which was thus chosen in our experiment.
In general, the iron contents in normal rats are: hemoglobin level ranging from 120 g/L to 150 g/L and serum iron from 5.60 mg/L to 7.89 mg/L. After low-iron diet feeding for 24 d, the iron deficiency models of the rats were successfully built by blood sample analysis. Specifically, the hemoglobin and serum values reduced to 84.7 g/L and 1.58 mg/L, respectively (Fig.5(a)-(b)). The rats’ weights in all the groups exhibited steady increase with little differences (Fig.5(c)). The rats’ feeds were fabricated by iron supplement addition (Fig.S3). As iron supplement proceeded, the increase of rats’ weight had no distinct differences among the five groups (Fig.6(a)). Notably, after 14 d of iron supplement diet therapy, the hemoglobin and serum iron levels of the three groups (Fig.6(b)-(c)) were both elevated approaching to those of the normal control group, which also presented significant differences on those of iron deficiency groups, suggesting that the IDA in the rats were successfully reversed by the three types of iron supplement diets. It is noteworthy that the two nano agents groups achieved lower hemoglobin and serum iron levels than those of the FeSO4group, but the iron contents in both groups exceeded the normal value, and IDA was well cured by the two nano agents. The lower iron level of the nano agents groups may be originated from the slow absorbing rate in nanoscale. It can be speculated that the iron level in the nano agents groups would approach to those of the ferrous salt group in an extended time. In addition, comparisons of recently reported iron supplements, including ionic and nanoscale type, were made (Table 3). The hemoglobin recovery levels with FeSO4treatment were different in our work and those reported by Powell et al.[7], which may mainly be attributed to the initial hemoglobin level in rats IDA model. The value in our work was 84.7 g/L whilst that in Powell’s work was around 65 g/L, so it is readily comprehensible that the final hemoglobin content after iron supplement in our work (about 158 g/L) is higher than that in Powell’s work (around 105 g/L). It can be found that γ-Fe2O3@CMC and γ-Fe2O3@PSC exhibited advantages on hemoglobin level recovery and treatment duration. Moreover, the iron-based nanomedicine should be absorbed as nanostructure in intestinal lumen (Fig.1), and thus bypass the ferrous ion negative influence, indicating their great potential for further useinvivo.
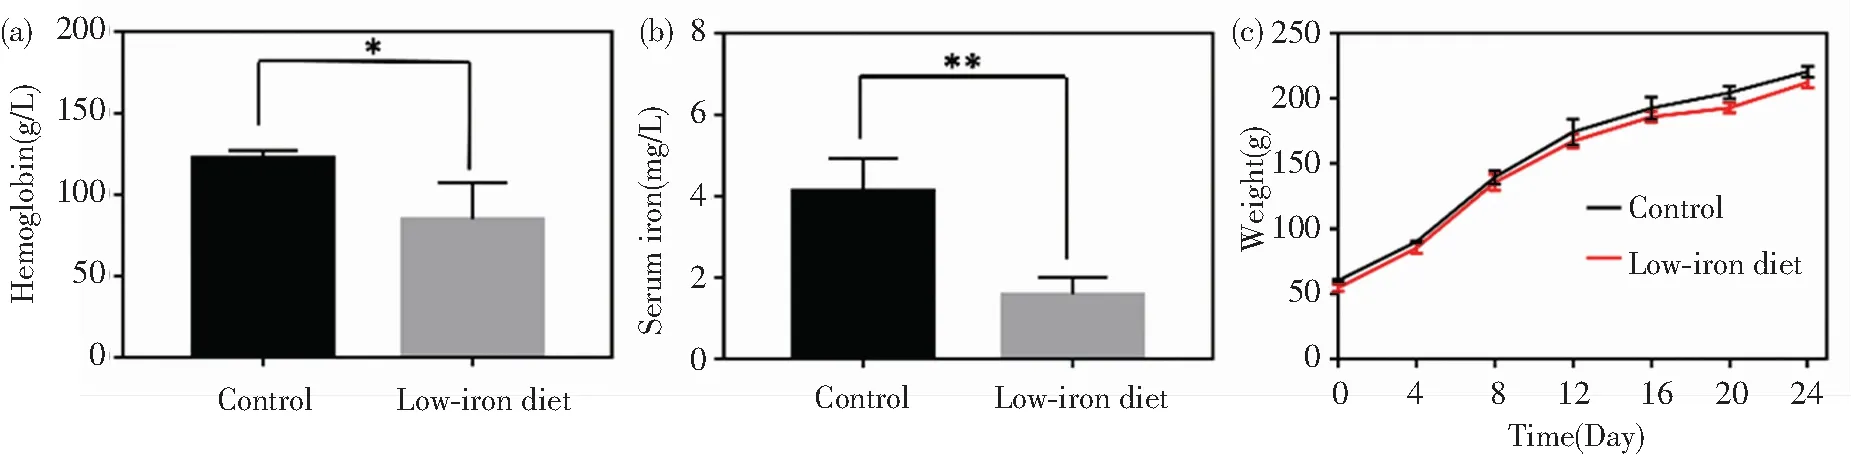
Fig.5 Iron deficiency model construction: (a) Hemoglobin and (b) serum iron content detection of rats in control group and iron deficient group after three-week low-iron diet; (c) Average body weight of rats in control group and iron deficient group during model building process (error bars indicate standard deviation, *P< 0.05, **P< 0.01,n=3)
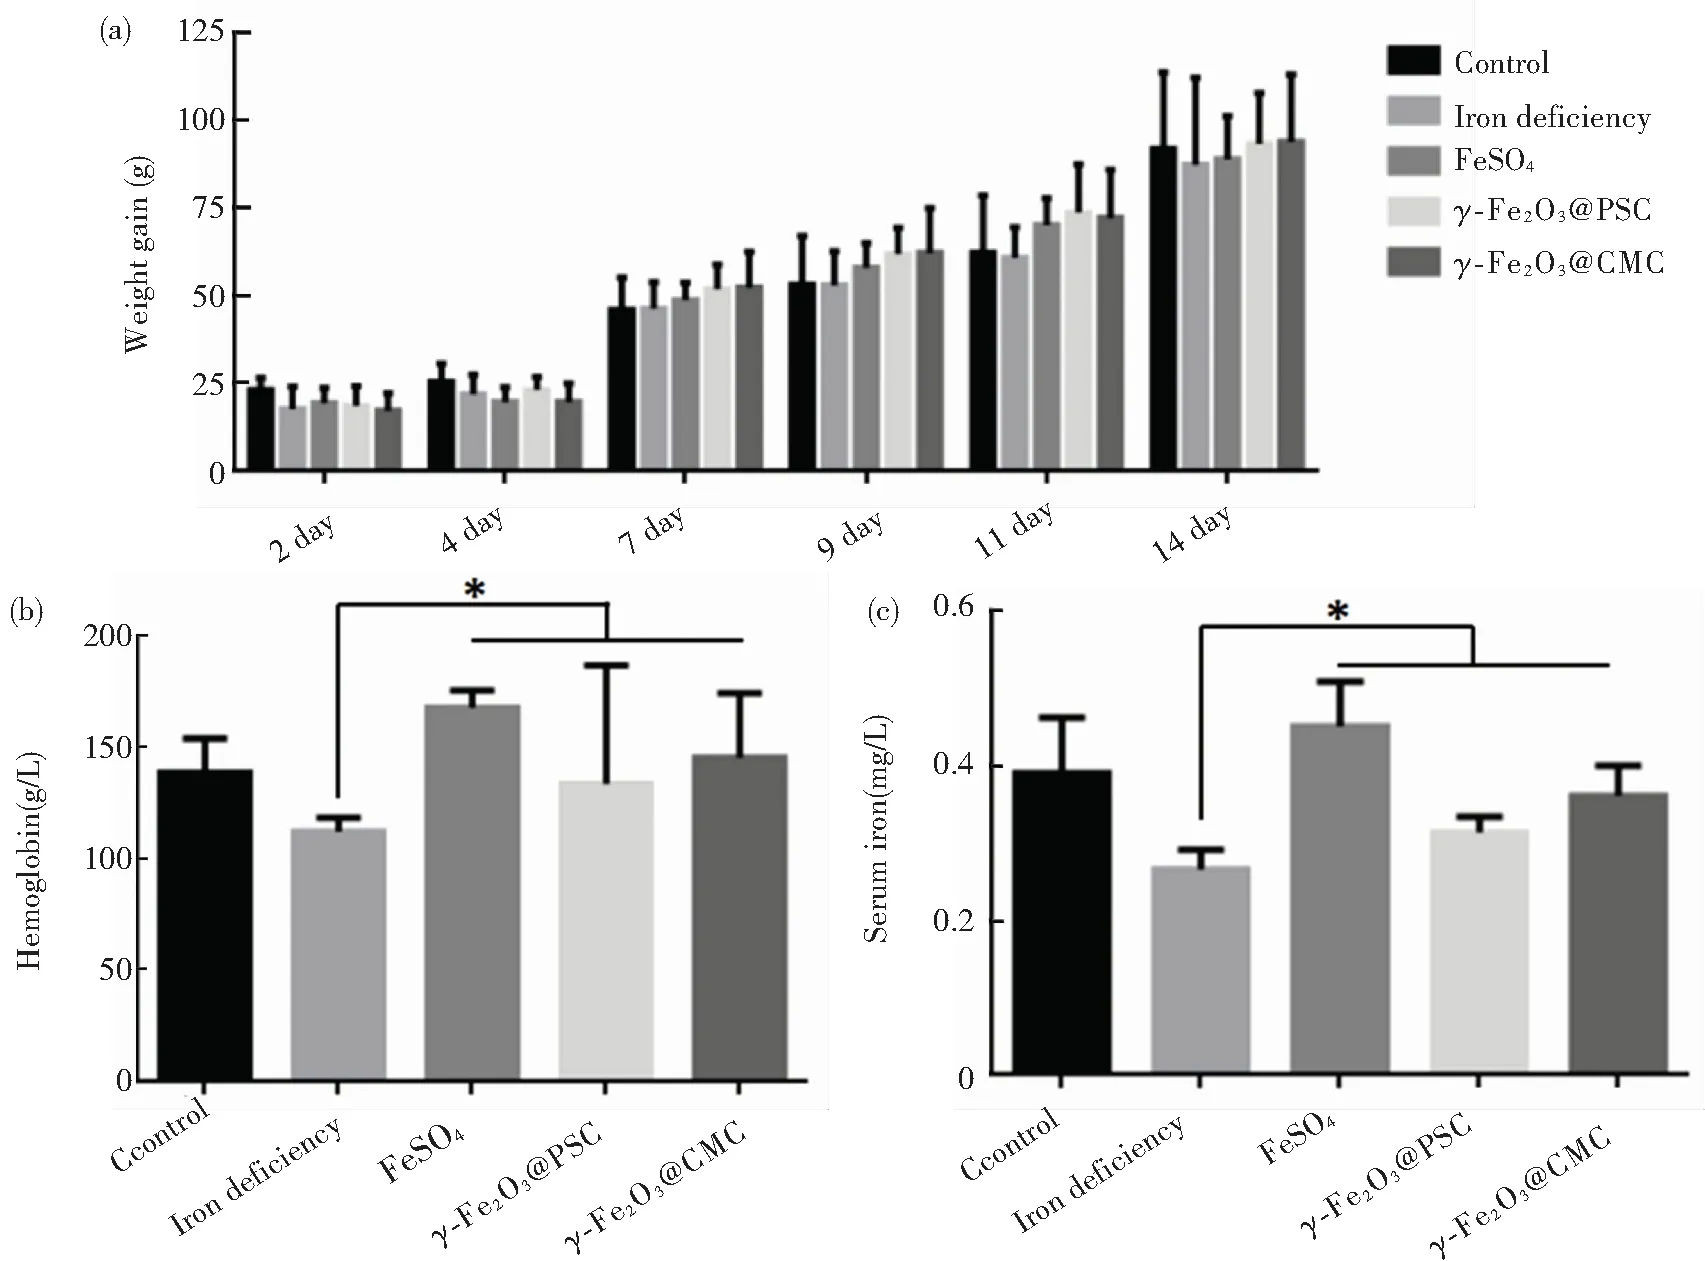
Fig.6 Iron supplement treatment evaluation: (a) Average body weights of rats in different groups during iron supplement period; (b) Hemoglobin and (c) Serum iron content detection of rats in different groups after two-week iron supplement diet (error bars indicate standard deviation, *P< 0.05,n= 3)
Table 3 Comparison of structures, preparation methods, and hemoglobin elevation levels of recently reported oral iron supplements
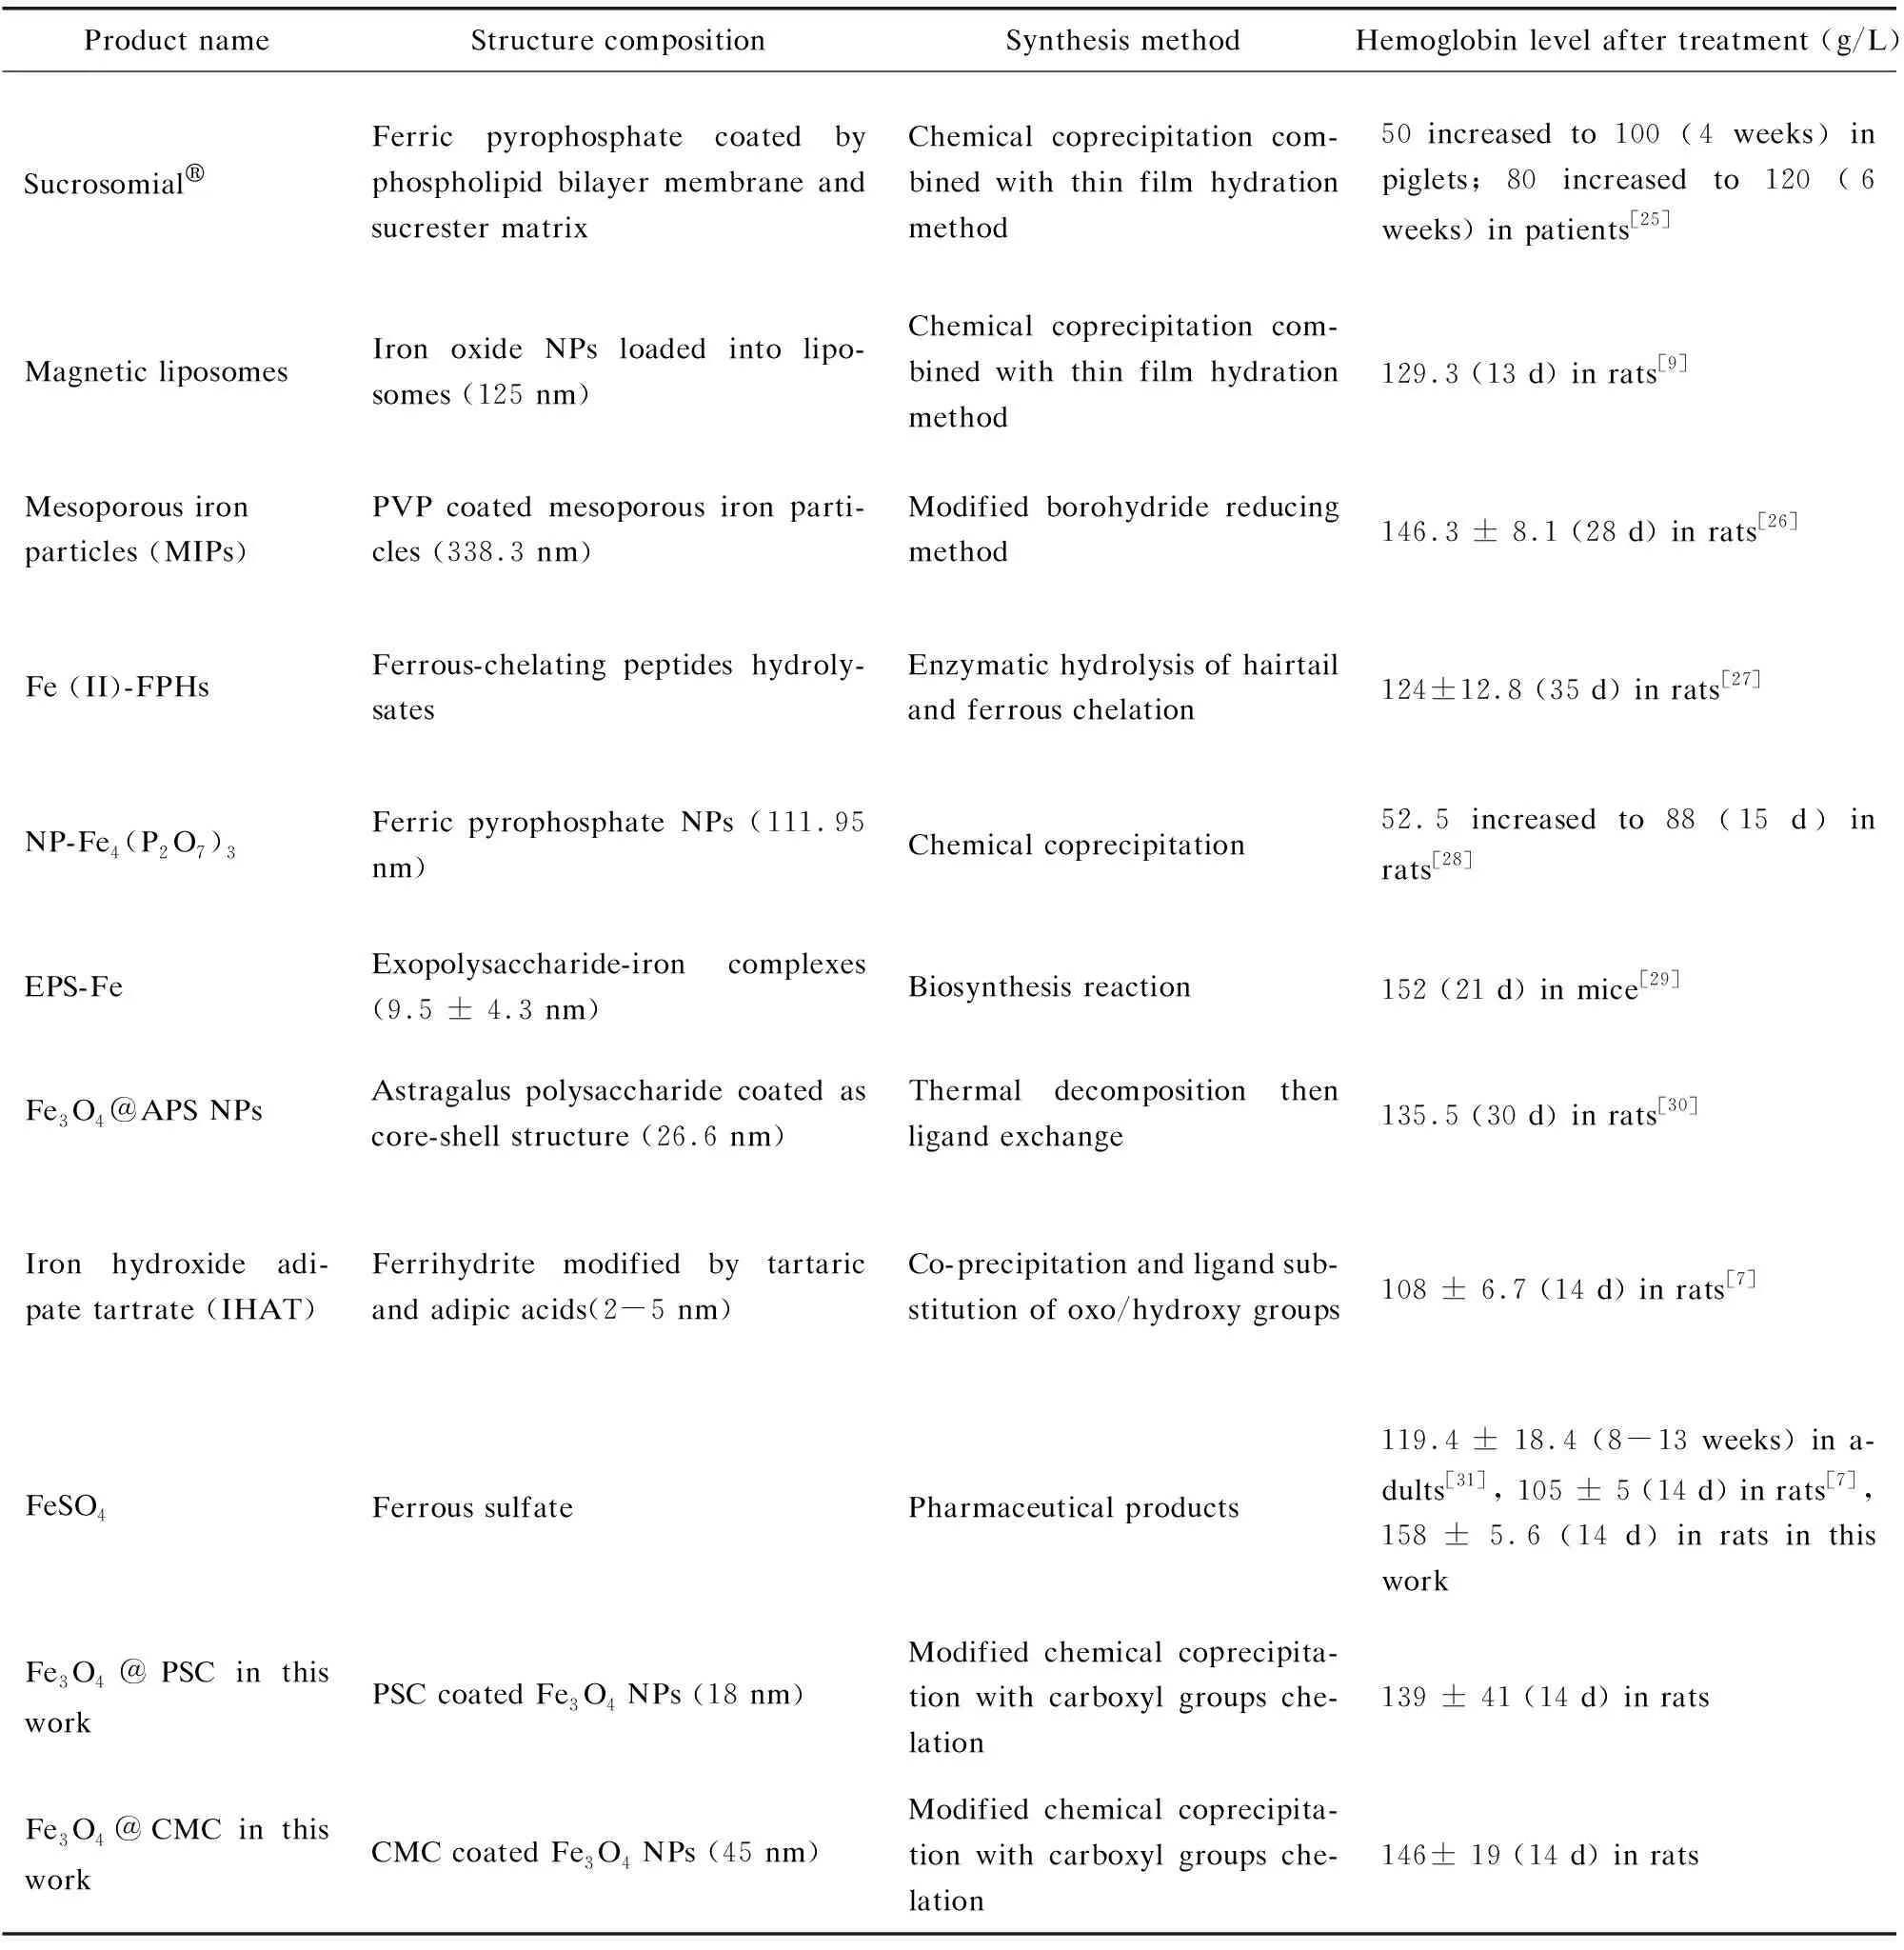
Product nameStructure compositionSynthesis methodHemoglobin level after treatment (g/L)SucrosomialFerric pyrophosphate coated by phospholipid bilayer membrane and sucrester matrixChemical coprecipitation com-bined with thin film hydration method50 increased to 100 (4 weeks) in piglets; 80 increased to 120 (6 weeks) in patients[25]Magnetic liposomesIron oxide NPs loaded into lipo-somes (125 nm)Chemical coprecipitation com-bined with thin film hydration method129.3 (13 d) in rats[9]Mesoporous ironparticles (MIPs)PVP coated mesoporous iron parti-cles (338.3 nm)Modified borohydride reducing method146.3 ± 8.1 (28 d) in rats[26]Fe (II)-FPHsFerrous-chelating peptides hydroly-satesEnzymatic hydrolysis of hairtail and ferrous chelation124±12.8 (35 d) in rats[27]NP-Fe4(P2O7)3Ferric pyrophosphate NPs (111.95 nm)Chemical coprecipitation52.5 increased to 88 (15 d) in rats[28]EPS-FeExopolysaccharide-iron complexes (9.5 ± 4.3 nm)Biosynthesis reaction152 (21 d) in mice[29]Fe3O4@APS NPsAstragalus polysaccharide coated as core-shell structure (26.6 nm)Thermal decomposition then ligand exchange135.5 (30 d) in rats[30]Iron hydroxide adi-pate tartrate (IHAT)Ferrihydrite modified by tartaric and adipic acids(2-5 nm)Co-precipitation and ligand sub-stitution of oxo/hydroxy groups108 ± 6.7 (14 d) in rats[7]FeSO4Ferrous sulfatePharmaceutical products119.4 ± 18.4 (8-13 weeks) in a-dults[31], 105 ± 5 (14 d) in rats[7], 158 ± 5.6 (14 d) in rats in this workFe3O4@PSC in this workPSC coated Fe3O4 NPs (18 nm)Modified chemical coprecipita-tion with carboxyl groups che-lation139 ± 41 (14 d) in ratsFe3O4@CMC in this workCMC coated Fe3O4 NPs (45 nm)Modified chemical coprecipita-tion with carboxyl groups che-lation146± 19 (14 d) in rats
4 Conclusions
In summary, iron oxide NPs modified with pharmaceutical excipients CMC as novel oral iron supplement were achieved for the treatment of IDA in rats. The recoveries of iron and hemoglobin levels were rapid for only two weeks without any adverse effect, which were exhibited in cytotoxicity assay and rats weight measurement. Unlike the manner that massive ferrous ion releasing in the gastrointestinal tract from FeSO4, γ-Fe2O3@CMC might be absorbed by the direct nanostructure transportation via Ferroportin[32-34]. In addition, CMC modification shielded the iron oxide core thus avoiding severe Fe2+stimulus. Owing to the high safety and effectiveness, it is convincible that iron oxide nanomedicine offers possible alternative for IDA treatment and motivates clinical development of oral nano iron supplement.
SupplementaryMaterials

Fig.S1 SEM images of naked Fe2O3 particle in different scale bar of (a) 2 μm and (b) 200 nm
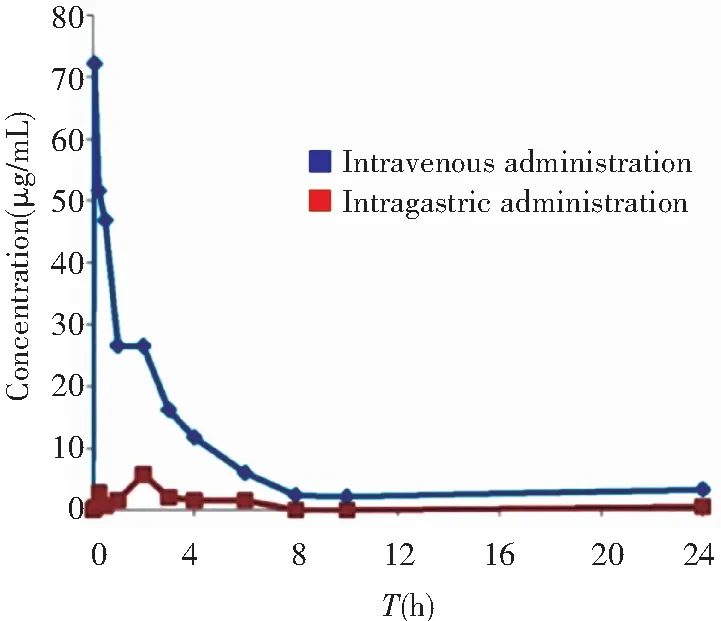
Fig.S2 Iron concentration in plasma at different time points after intravenous and intragastric administration of γ-Fe2O3@PSC
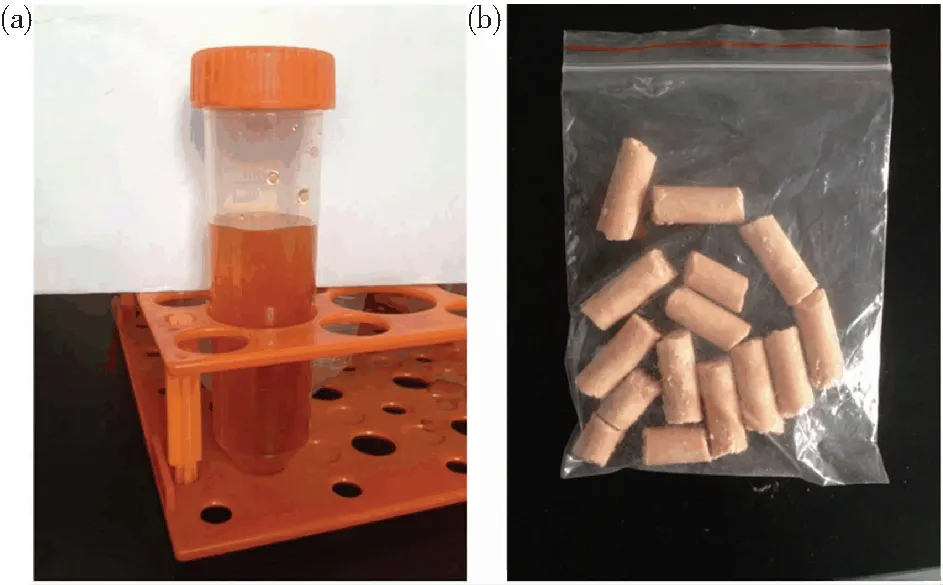
Fig.S3 The photos of (a) γ-Fe2O3@CMC solution and (b) rats feeds with γ-Fe2O3@CMC addition

Table S1 Pharmacokinetic properties of γ-Fe2O3@PSC in normal rats
杂志排行

Journal of Harbin Institute of Technology(New Series)的其它文章
- Investigations about the Atomic Structure and Mechanical Behavior of Metallic Glasses after Melt Hydrogenation
- Evolution Toward Artificial Intelligence of Things Under 6G Ubiquitous-X
- Optimal Micro-Task Scheduling for Multi-Hop D2D-Enabled Mobile Edge Computing
- Review: Layer-Number Controllable Preparation of High-Quality Graphene for Wide Applications
- Review: Research Progress for Electric Vehicle Hub Motor Driving Technology
- Review:Chromatic Dispersion Manipulation Based on Optical Metasurfaces