Fragment spatial distribution of prismatic casing under internal explosive loading
2020-07-02TianbaoMaXinweiShiJianLiJianguoNing
Tianbao Ma, Xinwei Shi, Jian Li, Jianguo Ning
State Key Laboratory of Explosion Science and Technology, Beijing Institute of Technology, Beijing,100081, China
Keywords:Fragment spatial distribution Prismatic casing Internal explosive loading Numerical fitting formula Marker-point weighted method
ABSTRACT Non-cylindrical casings filled with explosives have undergone rapid development in warhead design and explosion control. The fragment spatial distribution of prismatic casings is more complex than that of traditional cylindrical casings.In this study,numerical and experimental investigations into the fragment spatial distribution of a prismatic casing were conducted. A new numerical method, which adds the Lagrangian marker points to the Eulerian grid, was proposed to track the multi-material interfaces and material dynamic fractures. Physical quantity mappings between the Lagrangian marker points and Eulerian grid were achieved by their topological relationship. Thereafter, the fragment spatial distributions of the prismatic casing with different fragment sizes,fragment shapes,and casing geometries were obtained using the numerical method. Moreover, fragment spatial distribution experiments were conducted on the prismatic casing with different fragment sizes and shapes,and the experimental data were compared with the numerical results. The effects of the fragment and casing geometry on the fragment spatial distributions were determined by analyzing the numerical results and experimental data.Finally,a formula including the casing geometry parameters was fitted to predict the fragment spatial distribution of the prismatic casing under internal explosive loading.
1. Introduction
Metal casings under internal explosive loading have been used extensively in warhead design,explosion protection,and explosion control.Numerous experimental and numerical investigations have been performed on metal casings under internal explosive loading.Gurney [1] studied the velocities of the fragments of a cylindrical casing under internal explosive loading and proposed a velocity distribution formula including the Gurney coefficient.This formula can describe the specific relationship between the fragment velocity,and the ratio of the explosive mass to the casing mass.Based on the research of Gurney, Lloy [2] improved and extended the formula to a cylindrical casing with a finite length.Huang[3]fitted the correction term of the Gurney formula by measuring the fragment velocity distribution of a cylindrical casing detonated at one end.Li[4]comprehensively considered the above several cases,and obtained a correction formula considering the incident angle of the detonation wave by means of numerical simulations. Ning [5]conducted experimental and numerical investigations into the fragment velocity distribution of prismatic casing under internal explosive loading, and proposed an empirical formula for the fragment velocity. Furthermore, various studies have investigated the fragment mass distribution of cylindrical casings under internal explosive loading.Mott[6]suggested that the mass distribution of fragments depends on the defects and weakening points in the casing material.Arnold[7]studied the fragment mass distribution of cylindrical casings with different materials and thicknesses,and proposed a model for predicting the circumferential mass distribution of fragments. Grisaro [8] studied the fragment spatial mass distributions of cylindrical casings, and proposed a model for predicting the fragment spatial mass distribution. Wang [9] investigated the influence of the explosive initiation manners on the scattering characteristics of grooved cylindrical casings,and found that the initiation manners have a significant influence on the scattering characteristics.
To date,the majority of research on metal casings under internal explosive loading has focused on cylindrical casings, and only several studies have investigated prismatic casings.Moreover,most research has focused on the velocity and mass distributions of fragments, and little research has considered the fragment spatial distribution. As the fragments produced by prismatic casings are directional, these are suitable for use in directional warheads[10,11]. It is therefore necessary to study the fragment spatial distribution of a prismatic casing under internal explosive loading,as this problem exhibits extreme conditions, including high temperature, pressure, and strain rate, which often involve localized extreme deformations and failure. Computational simulations are necessary to investigate the fragment spatial distribution of a prismatic casing under internal explosive loading.
According to the coordinates adopted, the numerical methods used can be classified as Lagrangian or Eulerian methods[12].The Lagrangian method is effective at multi-material interfaces. However,large deformation will lead to element distortion[13]and the computation will terminate if the volume becomes negative [14].The Eulerian method is favorable for explosion and high-velocity impact problems, because it allows for arbitrary deformation of materials [15]. However, multi-material interfaces and material dynamic fracture are difficult to determine using the Eulerian method, particularly in complicated, large-scale engineering problems. Although the ALE [16] method incorporates the advantages of the Lagrangian and Eulerian methods and overcomes their disadvantages to a certain extent, difficulties remain in solving complex three-dimensional (3D) problems. Meanwhile, several mesh-free methods have been thoroughly developed, such as smoothed particle hydrodynamics(SPH)[17,18],the material point method (MPM) [19,20], and the element-free Galerkin method[21,22]. The mesh-free method offers advantages in tracking the material flow, but the increased computational scale will cause a sharp increase in the computational cost. For the structure of the metal casing studied in this work, the size of the groove is very small considering the structural dimensions of the metal casing.Hence, the deformation and moving processes of the grooves can only be described precisely by decreasing the grid size at the expense of computational efficiency, which will result in a larger memory footprint and computational scale.Therefore,based on the Eulerian shock hydrocode pMMIC-3D [23], the marker-point weighted method is proposed to solve this problem. This approach combines the advantages of both the Lagrangian and Eulerian methods, and the calculation efficiency can be improved with no loss of accuracy or additional computational expenses. By using the marker capability, the material interface and failure material can be precisely traced.
In this study, the fragment spatial distribution of a prismatic casing under internal explosive loading was studied experimentally and numerically. A new numerical method, which adds the Lagrangian marker points to the Eulerian grid, was proposed to track the multi-material interfaces and material dynamic fractures.In this method, the Lagrangian marker points move with the flow,and mappings of the physical quantities between the Lagrangian marker points and Eulerian grid are achieved by their topological relationship. The fragment spatial distributions of the prismatic casing with different fragment sizes, fragment shapes, and casing geometries were obtained using the numerical method. The numerical simulation results were validated using experimental data.Moreover, fragment spatial distribution experiments were conducted on the prismatic casing with different fragment sizes and shapes, and the experimental data were compared with the numerical results. The comparison shows that the new numerical method can effective deal with the fragment spatial distributions under internal explosive loading. The effects of the fragment size,fragment shape, and casing geometry on the fragment spatial distribution were investigated by analyzing the numerical results and experimental data. Finally, a formula including casing geometry parameters was fitted to predict the fragment spatial distribution of the prismatic casing under internal explosive loading.
2. Mathematical model and numerical method
2.1. Mathematical model
2.1.1. Governing equations
The hydrodynamic model consists of the following governing equations: mass conservation, momentum conservation, energy conservation, and equation of state. If the viscosity and heat conduction are neglected, the Eulerian equations can be written in a tensor form, as follows [24]:
Mass conservation equation:

Momentum conservation equation:

Energy conservation equation:

where t is the time; e , u , and ρ are the specific internal energy,velocity,and density of the flow,respectively;and σ is the Cauchy stress tensor.
2.1.2. Stress update
The Cauchy stress tensor σ can be divided into the hydrostatic pressure P, which is obtained from the state equation, and the deviatoric stress S, which is calculated by constitution equations[23]:

Within the elastic range, the generalization of Hooke’s law can be written as follows:


Because the Cauchy stress rate is not an objective rate, the Jaumann rate of the Cauchy stress is calculated by Ref. [25]:

where Ω is the spin rate tensor:

2.1.3. Yield criterion
In the hydrocode, the deviatoric stress correction factor β is defined.If the material yields,0 <β ≤1,and the deviatoric stress is corrected by β.If the material is elastically deformed,β >1,and the
deviatoric stress is not corrected [23].

The plastic flow regime is determined by the von-Mises criterion, in which the flow is considered as plastic when the second stress invariant J2satisfies Eq. (8).

where Y0is the von-Mises yield stress, which is calculated by the material strength model.When,the material is in an elastic state,and the stress-strain relationship satisfies the generalization of Hooke’s law. When, the material enters the plastic phase.The deviatoric stress correction factor β is defined as follows:

2.2. Operator splitting method
The operator splitting method [26] is adopted for the computation,and the three governing conservation equations are divided into two phases: diffusion and convection. The conservation equations can be expressed in the general form:

where φ represents e, ρ, and u. Therefore, u·∇φ and H are the convection and source terms, respectively. Furthermore, Eq. (10)can be split into the following forms [26]:

Eqs.(11)and(12)are referred to as the Lagrangian and Eulerian steps, respectively. In the Lagrangian step, the intermediate of the velocity u and specific internal energy e can be calculated according to Eq. (11), which is discretized using central differencing [5]:

where Δt is the time step,Δ(I)=[Δx(i),Δy(j),Δz(k)]Trepresents the mesh size of each direction,and I=[i,j,k]Trepresents the index of each grid. In the Eulerian step, the variables of mass, momentum,and energy are redistributed by computing the transport quantities between the grids [27].
2.3. Marker-point weighted method
The Lagrangian marker points with an influence domain are placed in the Eulerian grid.The transportation of variables between the Larangian marker points and Eulerian grids is achieved through the weighted average of the influence domain and their relative position relationship. This method overcomes the problem of the numerical fluctuations in the traditional particle-in-cell (PIC)method[28].The material interface is tracked by the changes in the marker point position. This method includes two mappings: the forward mapping is from the Eulerian grids to the Larangian marker points, whereas the inverse mapping is from the marker points to the Eulerian grids, as illustrated in Fig.1. In the forward mapping,the variables ~U(pk), carried by the marker point pk, can be calculated by weight-averaging according to the grid variables ~U(Iλ),such as the velocity components ui(I), increments of the strain components Δεij(I),and increments of the equivalent plastic strain Δεp(I), of the neighboring grids, as per Eq. (14):

where ωλis a weighted coefficient obtained from the volume of the influence domain mapped in the neighboring grids,and it is given by:
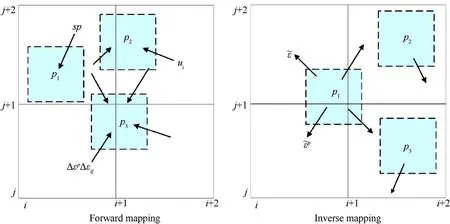
Fig.1. Sketch of mutual mapping algorithm: forward mapping maps variables from grid to point, and inverse mapping maps variables from point to grid.
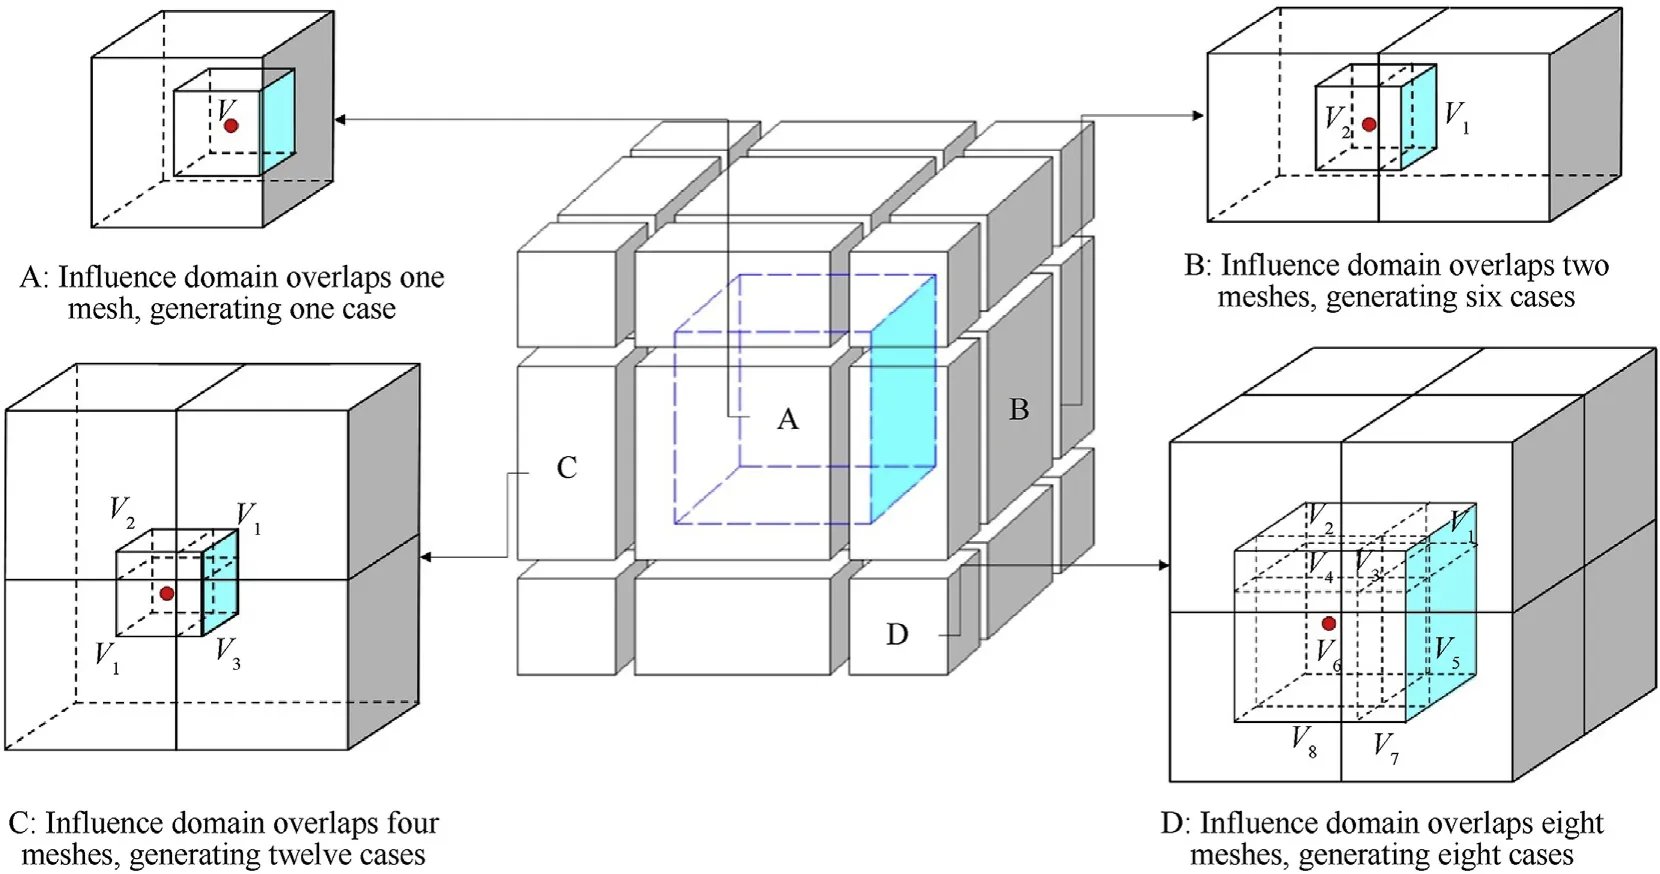
Fig. 2. Volume-weighted model of influence domain: A, B, C, and D indicate the relative positional relationships between the point and grid.

In this case,λ represents the grid that overlaps with the marker point influence domain. According to the positions of the marker points in the grid, one grid can be divided into 27 pieces that are categorized into the four classes A, B, C, and D, as illustrated in Fig. 2. Here, ~Vλ, the volume of the marker point influence domain that overlaps with grid λ, is calculated as follows:

The velocity and strain increments of the marker points are obtained by forward mapping. The displacement of the Larangian marker point is calculated by integrating the velocity to describe the material interface. Once the change in the positions of the marker points has been completed, inverse mapping from the marker points to the Eulerian grids is performed, in which the variables are mapped from the marker point to the grid, as illustrated in Fig. 1. The calculation of the weighting coefficient and volume of the influence domains is the same as in the above equations for the forward mapping. The grid variables are calculated as follows:

2.4. Material properties and failure model
2.4.1. Material strength model
The Johnson-Cook (JC) strength model [29] is widely used to describe materials subjected to large deformation,high strain rate,and thermosoftening. The strength of the yielded stress is dependent on the state of the equivalent plastic strain, strain rate, and temperature.In this study,the above model is adopted to describe the material behavior of the prismatic casing and fragment plate.

where A, B, C, n, and m are the constants of the material; εpis the equivalent plastic strain;and0is the relative plastic strain rate at a reference strain rate of ˙ε0= 1s-1. The homologous temperature is defined as T*= (T - Tr)/(Tm- Tr), in which T is the current temperature, Tris the room temperature, and Tmis the melting temperature of the material.
The casing and fragment plate materials are 7075-T6 aluminum and AISI 1045 steel,respectively.The parameters of their JC models are referenced from previous studies,and these are listed in Table 1[4,30].
The increments of the equivalent plastic strain Δεpare calculated as follows:

where ˙εpis the equivalent plastic strain rate, which is given by

The increments of the temperature ΔT can be calculated by the specific internal energy e. The relationship between the temperature and specific internal energy is given by

where Cpis the specific heat capacity. The increments of the temperature ΔT are calculated by incorporating the increment of the specific internal energyinto Eq. (21).

Table 1 JC model parameters [4,30].

2.4.2. Equation of state
The Mie-Grϋneisen [31] state equation is used in the metal material equation of state,and the specific form is as follows:

where

in which Γ is the Grϋneisen gamma, μ =- 1, ρ0is the initial density,and e is the specific internal energy.Moreover,k1= ρ0C2,k2= k1[1 + 2(λ - 1)], k3=k1[2(λ-1)+3(λ-1)2], and λ are the material coefficients, while C is the sound velocity. The material parameters are listed in Table 2 [31,32].
The JWL equation of state[4]is adopted as the material model of the explosive in this study:

where P is the pressure;E is the internal energy per initial volume;v is the initial relative volume; and ω, C1, C2, r1, and r2are the material constants. In this work, the explosive in the casing is Composition B (COMP-B), the properties and parameters of which are listed in Table 3.
2.4.3. Material failure model
The JC failure criterion is adopted.The failure strain is given by Eq. (26) [29]:
where D1to D5are the failure parameters,the values of which are listed in Table 4. Moreover, σ*=p/σeffis the hydrostatic pressure divided by the effective stress. In the JC failure criterion, fracture occurs when the damage parameter D reaches the value of 1. The damage parameter D can be expressed as Eq. (27).

In this study, the damage parameter D is calculated on the maker point.Once the update of the marker point coordinates has been completed, the damage parameter D is mapped back to the grid by inverse mapping and the damage parameter D of the grid is calculated. When D reaches the value of 1, the Eulerian grid is considered as ineffective. The failure grid can only operate under hydrostatic pressure, as opposed to deviatoric stress, and the material failure interface can be traced.

Table 3 Properties and parameters of COMP-B [4].

Table 4 JC failure parameters [30,33].
3. Numerical simulations
3.1. Numerical modeling
A prismatic casing consisting of a metal casing,explosive,upper cover,lower cover,and fragment plate was proposed in this study,as illustrated in Fig. 3. The fragment plate was assembled in a prismatic casing,and it could be divided into four types,according to the fragment sizes and shapes. Fragments of different sizes and shapes could be achieved by machining grooves on the fragment plate. The initiation point was located furthest from the fragmentation plate at one end of the explosive. The fragment plate and casing geometric parameters are displayed in Tables 5 and 6.In the simulations,the grid step was 0.5 mm,and 8 marker points existed in each grid at initialization, as illustrated in Fig. 4. The computational domain was divided into 28.8 million grids, and a total of 3,866,624 marker points were arranged in the fragment plate region.
3.2. Rupture process of prismatic casing
Fig. 5 illustrates the detonation wave propagation process and fragmentation process of the prismatic casing in the vertical and horizontal sections. The process could be divided into two stages:the first stage was from the explosive initiation to the detonation wave contact with the fragment plate, and the second stage was from the detonation wave contact the fragmentation plate to the fragment being completely formed.The detonation wave contacted the fragment plate at 6.18 μs, following which the fragment plate began to deform plastically owing to the high pressure of the detonation product. As the detonation wave continued to spread,cracks began to appear along the groove, and leaking detonation products emerged from the cracks. With the detonation product overflow, the pressure inside the casing decreased rapidly. Finally,the fragment plate was completely broken to form regular fragments.
The nephogram of the damage parameter D at different moments on the fragment plate during the fragment formation is presented in Fig. 6. The figure indicates that the shock wave was transmitted from the detonation end into the fragment plate.Under the action of the shock waves, the fragment plate damage parameter began to increase and the damaged area coincided with the area in which the shock wave propagated.The damaged area on theback side of the fragment plate was larger than that on the front side, indicating that damage and fracture mainly occurred on the side of the fragment plate that was in contact with the explosive.The value of the damage parameter D at the grooves was higher than that at other positions on the fragment plate.In the numerical method,when the damage parameter D reached the value of 1,the material was considered as ineffective. The failure material could only operate under hydrostatic pressure, as opposed to deviatoric stress, and the fracture expanded with the shock wave along the groove. Eventually, the entire fragment plate ruptured into fragments.

Table 2 Mie-Grϋneisen state equation parameters [30,31].
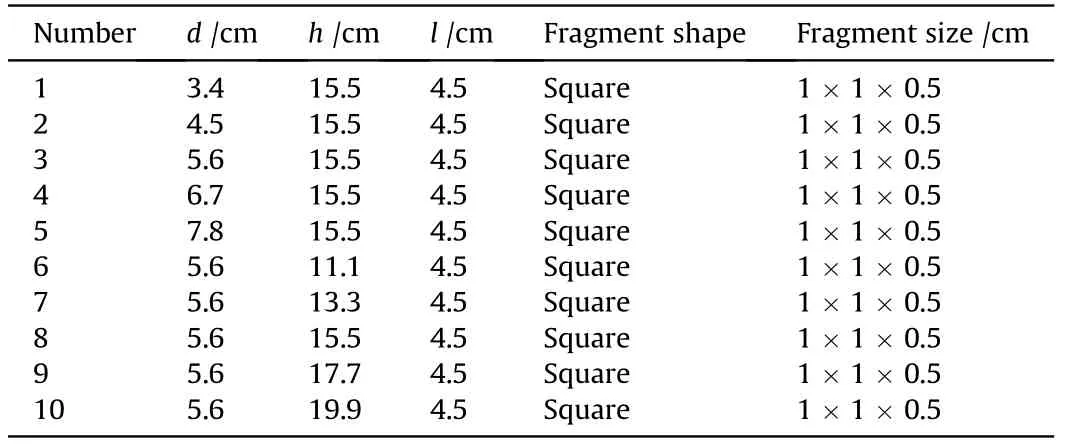
Table 6 Casing geometric parameters.
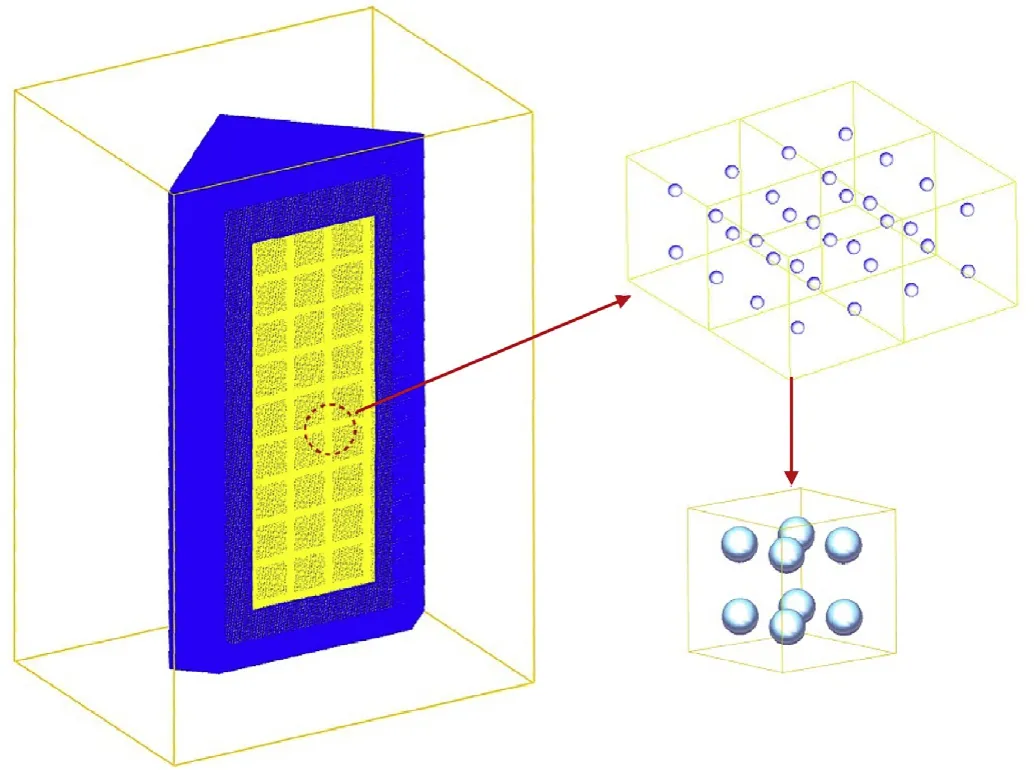
Fig.4. Computational model of prismatic casing:the grid step is 0.5 mm,and 8 marker points exist in each grid at initialization.
3.3. Numerical simulation results
Four types of fragment spatial distributions of the fragment plates were simulated, and the fragment spatial distributions at a distance of 6 m from the prismatic casing are illustrated in Fig. 7.The fragment spatial distribution area was roughly rectangular.The spatial position of the fragments exhibited a multi-column distribution,and the number of columns was consistent with that of the fragments on the fragment plate. The distances between columns became smaller with a decrease in the vertical height. In general,the sizes of the spatial distribution areas of the different fragment types were approximately the same.
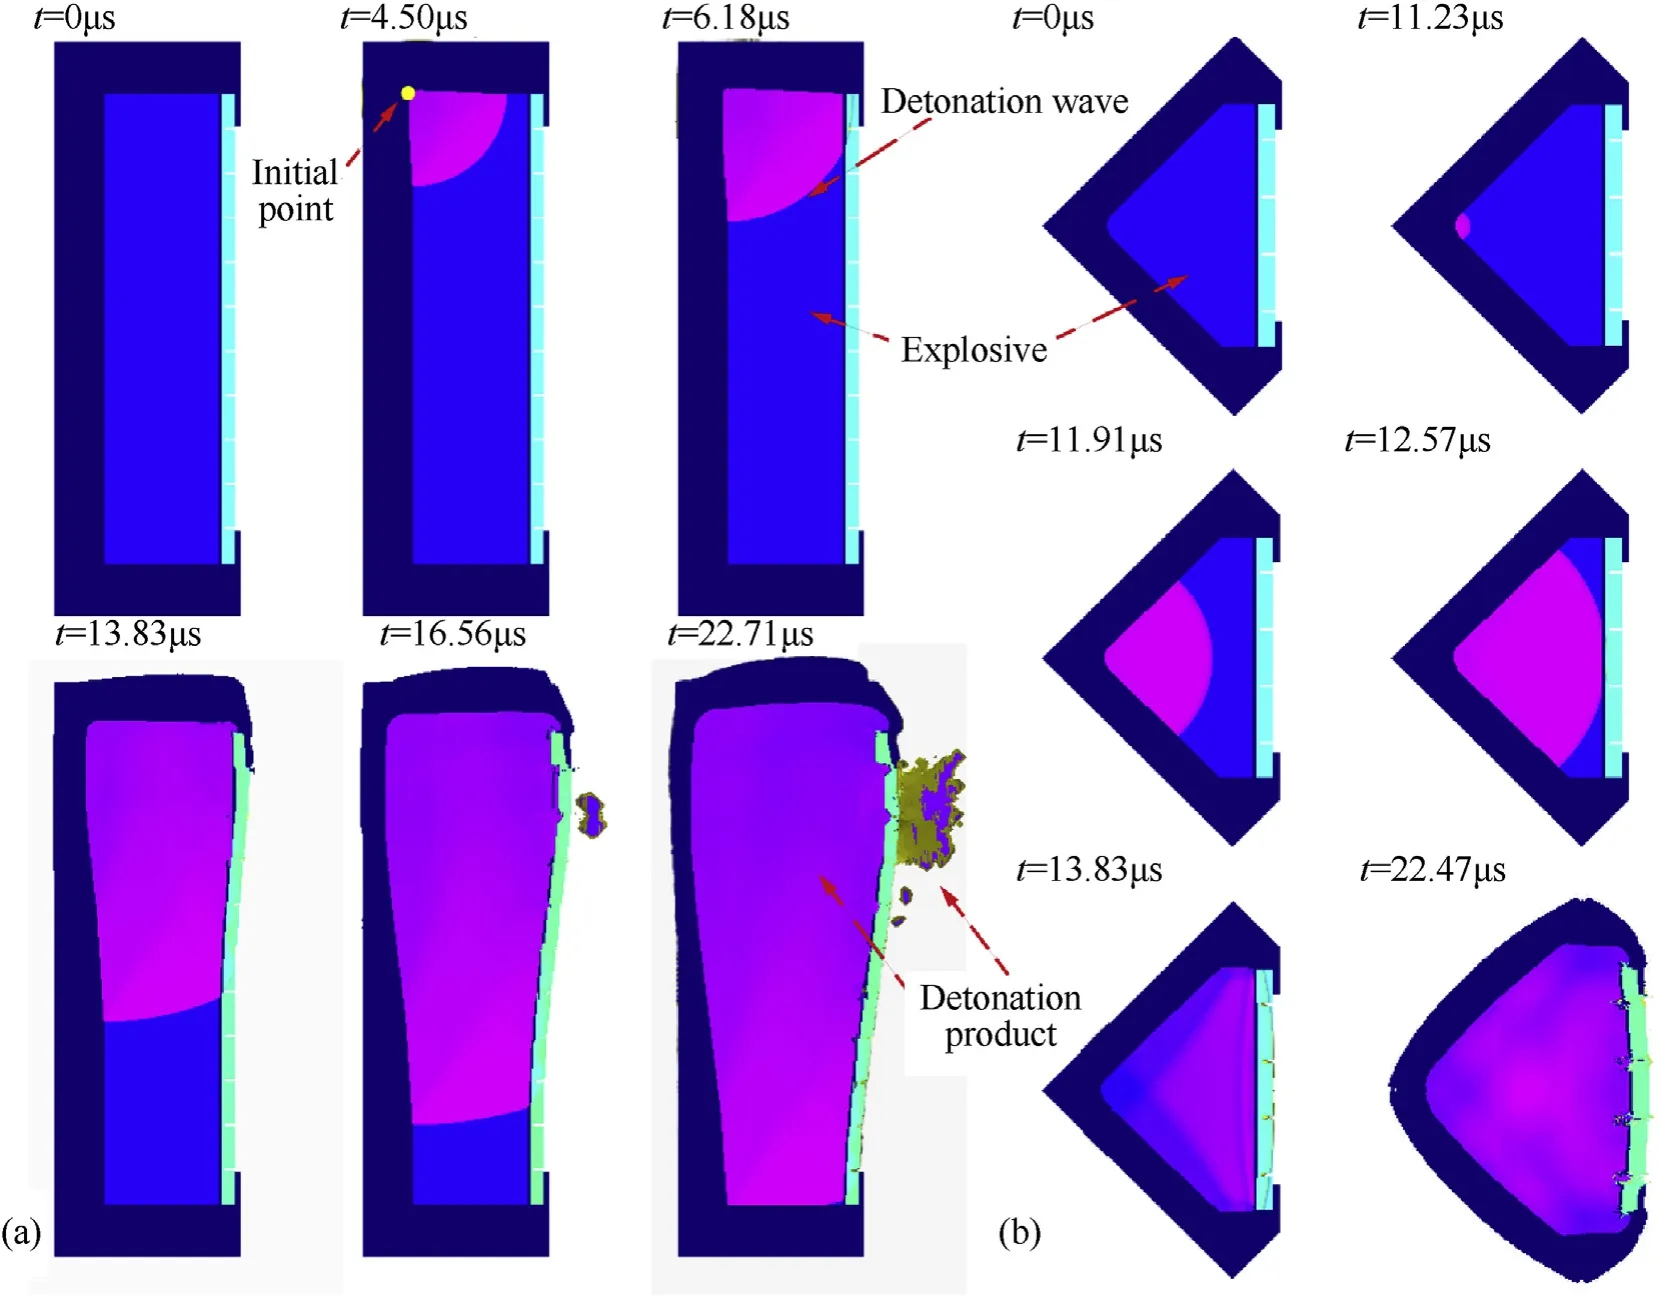
Fig. 5. Detonation wave propagation and fragmentation process of prismatic casing in (a) vertical section and (b) horizontal section for type III.
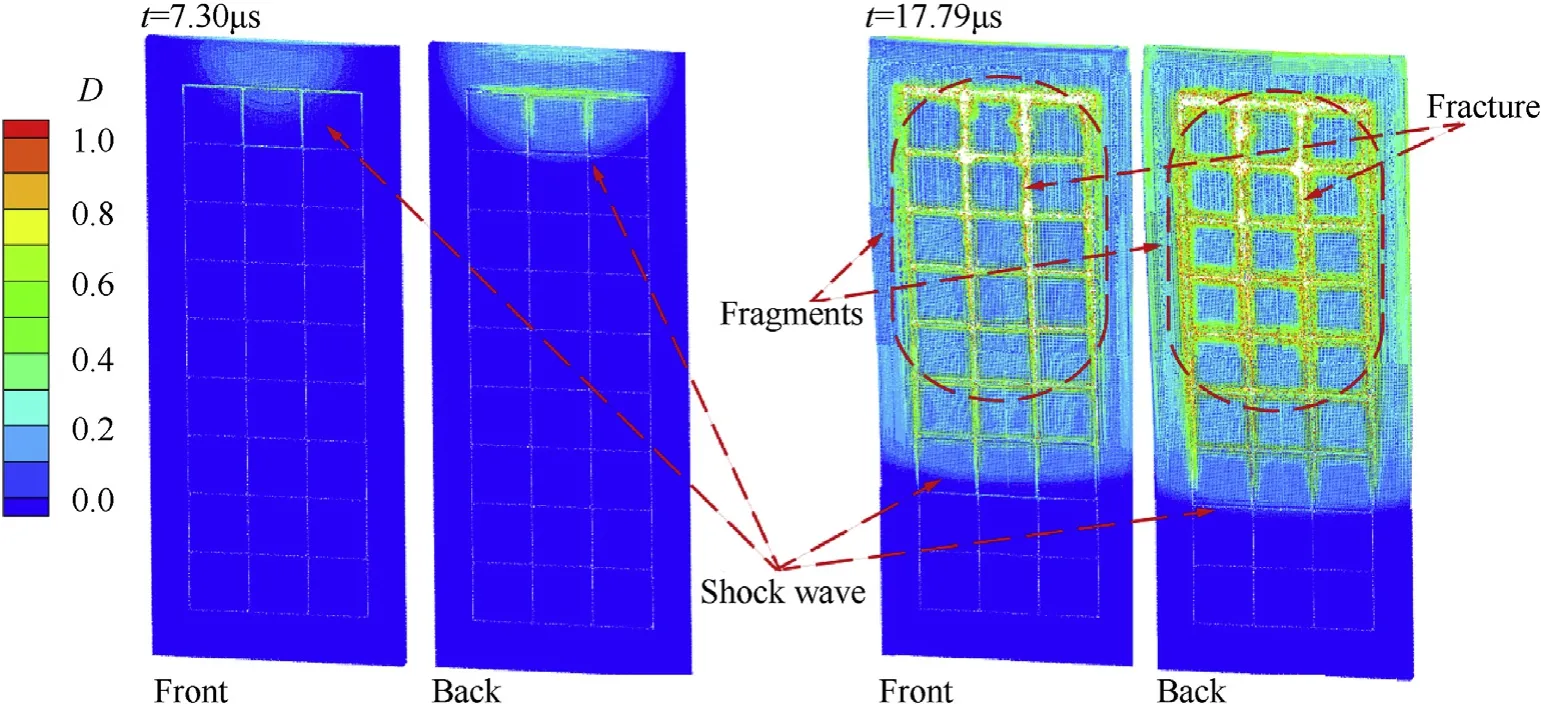
Fig. 6. Damage parameter nephogram of fragment formation process.
Simulations were also conducted for different values of d and h,and the fragment spatial distributions at a distance of 6 m from the complex geometry prismatic casing were obtained. The specifications are presented in Tables 7 and 8. The width of the fragment distribution increased with an increasing d, and the height of the fragment distribution increased with an increasing h.
4. Experiment
An experimental investigation was conducted on the fragment spatial distribution of the prismatic casing under internal explosive loading. The fragment spatial distribution was measured using a wooden target at a distance of 6 m from the prismatic casing.
4.1. Experimental setup
Experiments were conducted with fragment plates of types I,II,III, and IV. Fig. 8 presents a schematic view of the experimental setup. The prismatic casing was placed on a 1.2 m-high platform with an initiation point at the top,and a wooden target plate with a 2.0 m height and 2.4 m width was placed 6 m from the prismatic casing. The fragment spatial distribution perpendicular to the target direction 6 m from the prismatic casing could be obtained from the holes on the left of the target plate following fragment penetration.
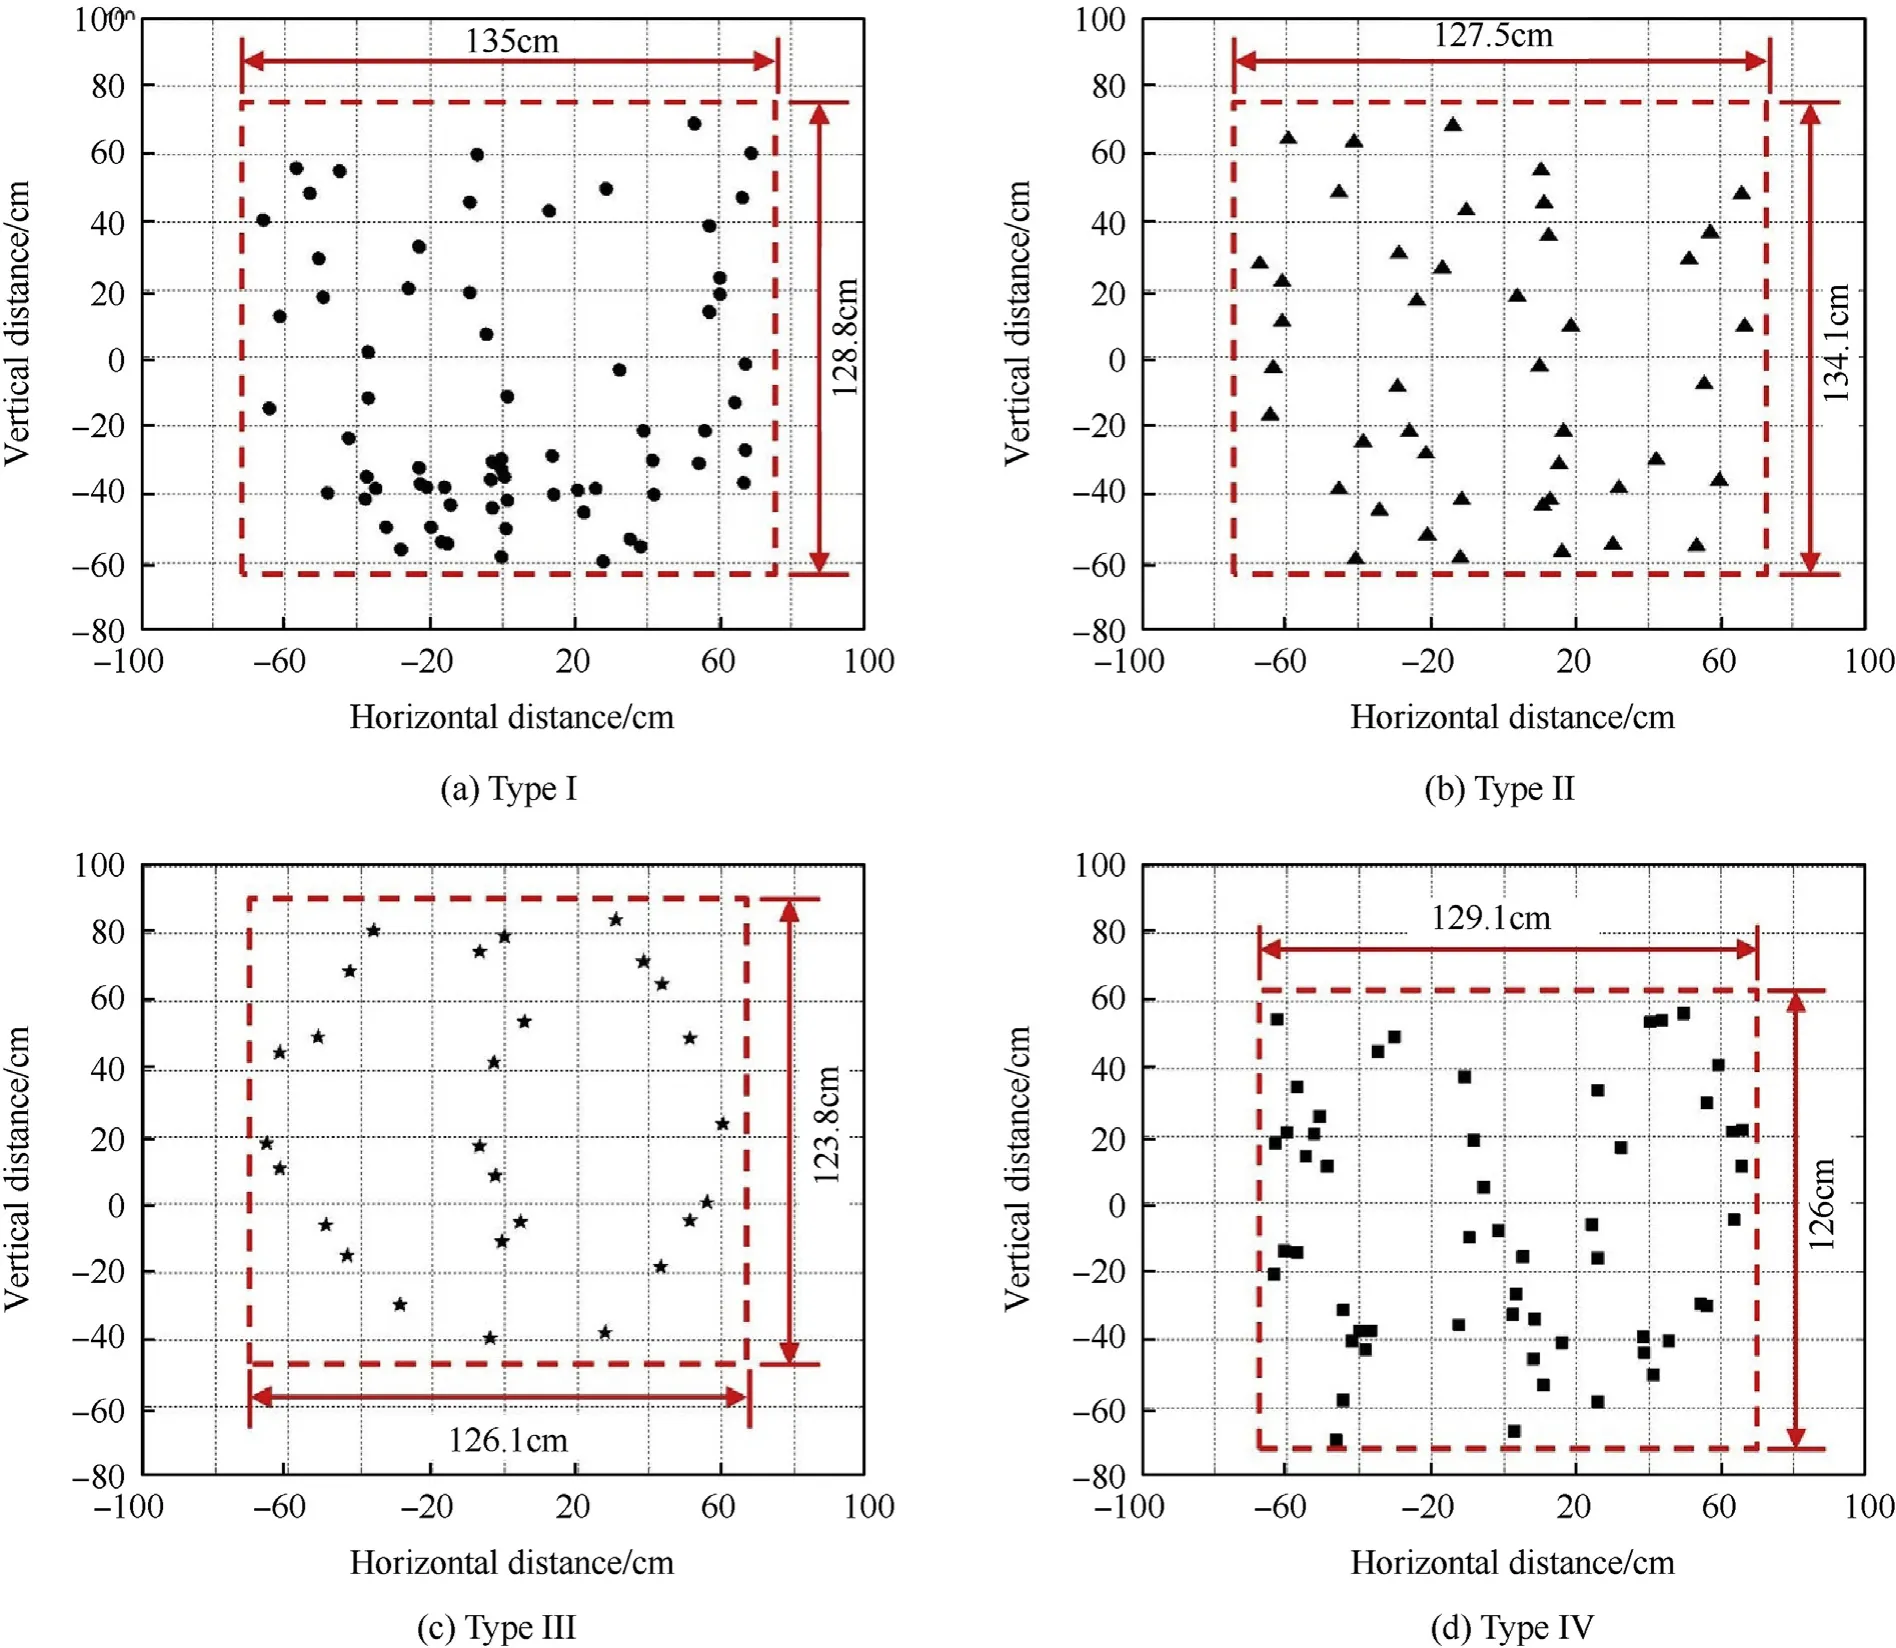
Fig. 7. Simulation results of fragment spatial distributions: (a), (b), (c), and (d) correspond to types I, II, III, and IV, respectively.

Table 7 Width of fragment spatial distribution with d.

Table 8 Height of fragment spatial distribution with h.
4.2. Experimental results
An area containing more than 90%of regular holes to reduce the influence of the casing fragments and scattered gravel was selected as the fragment distribution area. Fig. 9 illustrates the fragment distribution of type I.The experimental results are listed in Table 9.The fragments were distributed in a rectangular area with a side length of approximately 120 cm,which indicates that the size and shape of the fragments were not the main factors affecting the fragment spatial distributions. The fragments exhibited a longitudinal distribution of several columns on the target plate, the number of columns corresponded to the number of columns of fragments on the fragment plate, and the distances between the columns at the bottom of the area were smaller.
5. Discussion
5.1. Comparison of experimental data and numerical results
The experimental data and numerical results of the fragment spatial distributions are listed in Tables 10 and 11,respectively,and the relative deviations between the two are included. The errors were below 10%, indicating that the numerical method can effectively deal with the fragment spatial distribution. The maximum difference,which is defined as the ratio of the maximum change to the data,was used to describe the changes in the data.According to the experimental data and numerical results,the width and height of the fragment distribution slowly decreased with an increase in the fragment sizes, and the maximum difference was approximately 10%. The fragment distribution areas of the four types of fragment plates were quite similar, indicating that the fragment sizes and shapes were not the key factors affecting the spatial distribution. Hence, the fragment sizes and shapes could be neglected in this experimental scenario.
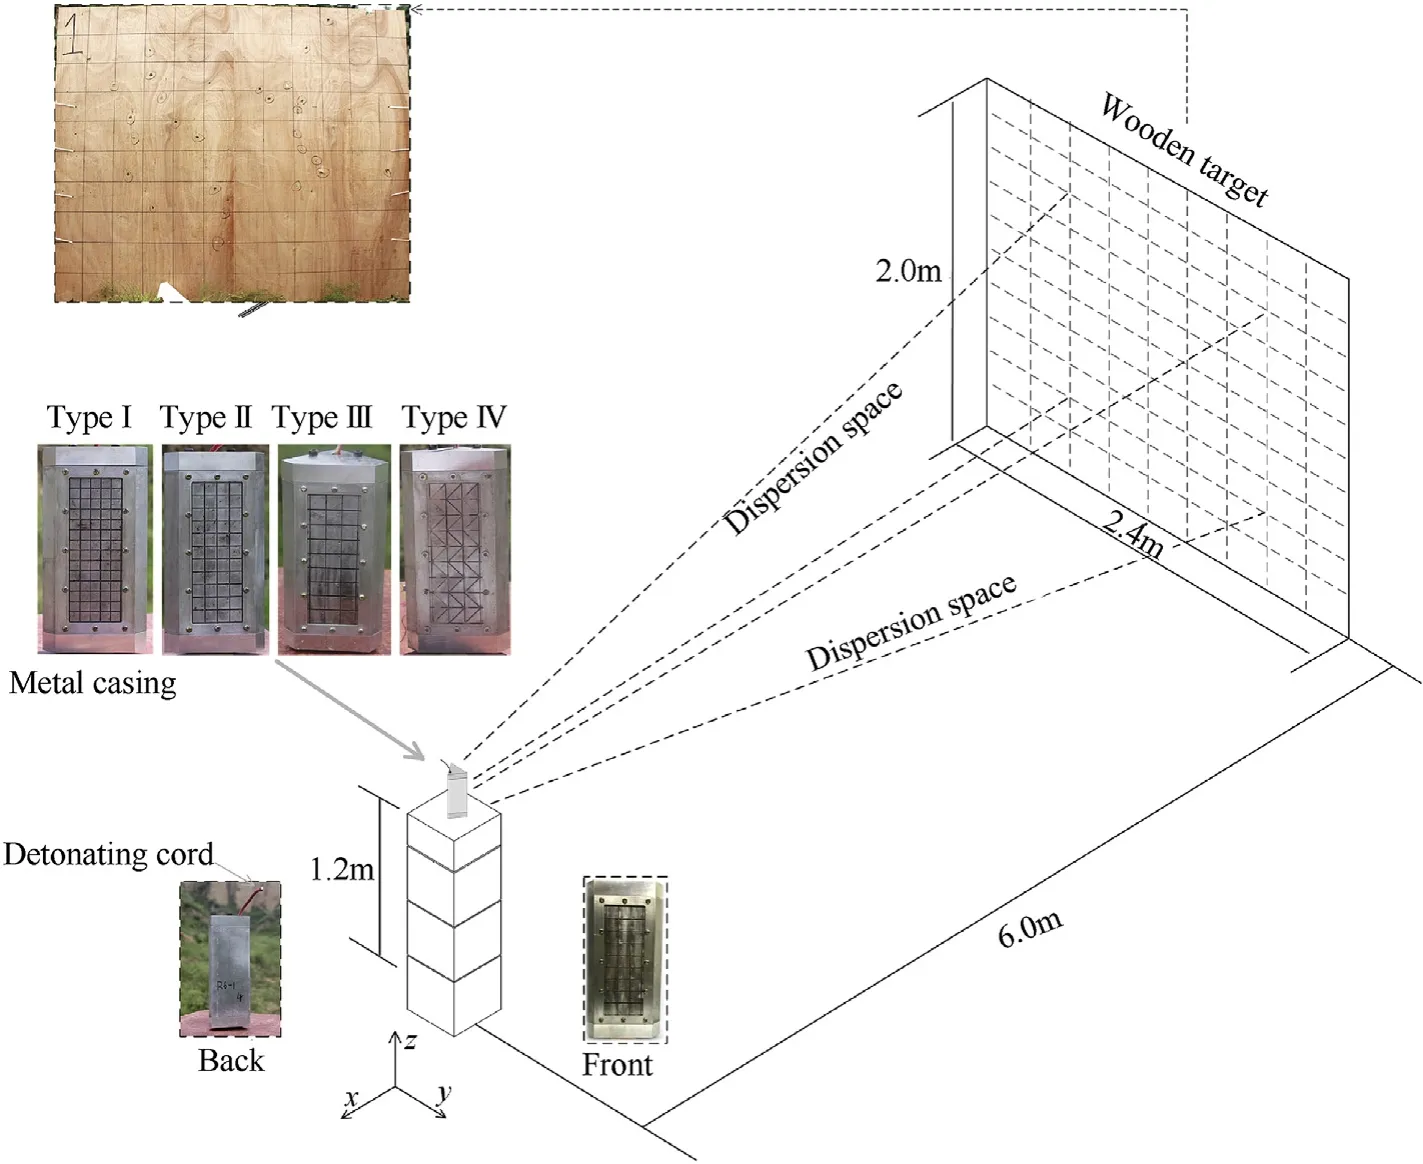
Fig. 8. Schematic view of experimental setup.
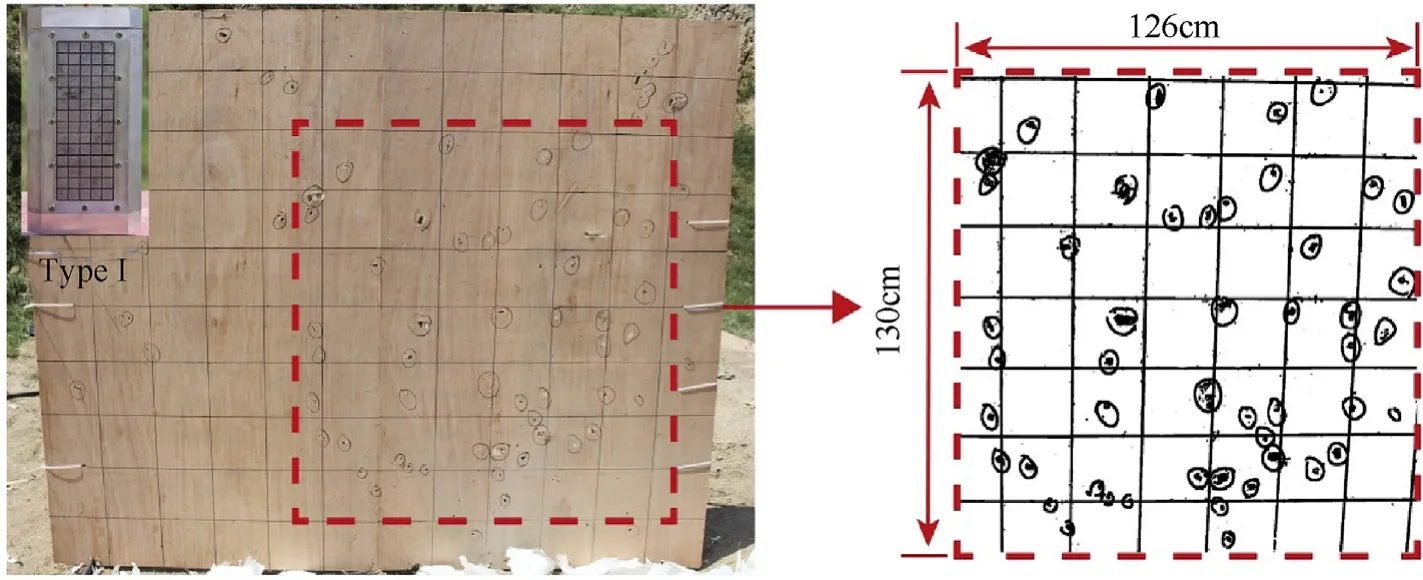
Fig. 9. Photographs of fragment spatial distributions of type I.
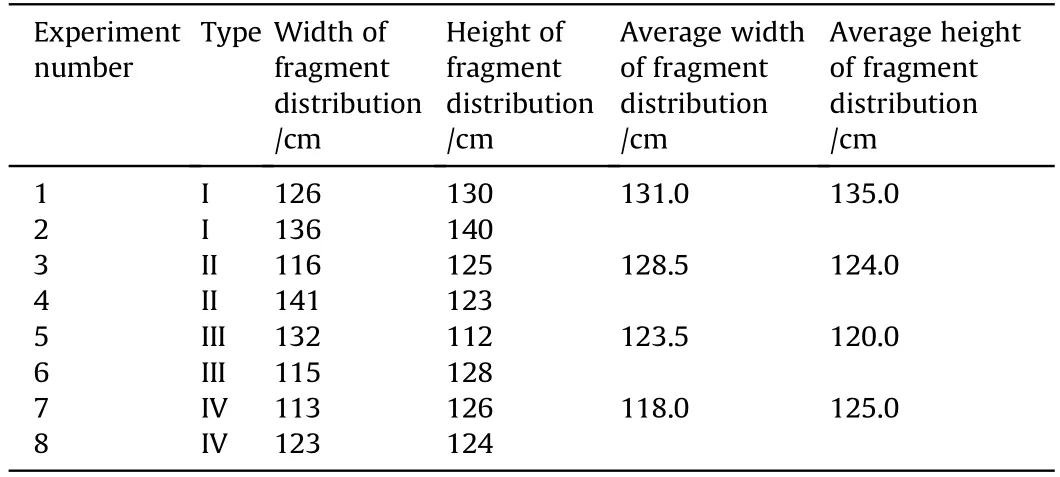
Table 9Experimental results of fragment distribution.
5.2. Analysis of fragment scattering angle
The experimental and numerical results indicated that the fragment sizes and shapes were not the key factors affecting the spatial distribution.The maximum scattering angle of the fragment was the important parameter in the spatial distribution. The definitions of the scattering angles in the vertical and horizontal directions are illustrated in Fig.10.
Therefore, considering type III as a typical fragment plate, its fragment scattering angles in the vertical and horizontal sections are illustrated in Figs.11 and 12,respectively.The fragments of type III could be divided into three ranks. In the vertical section, the changes in the scattering angles of the three ranks were basically the same. The absolute value of the fragment scattering angle increased along the vertical direction.The minimum and maximumvalues occurred at the detonation and non-detonation ends,respectively,indicating that the rarefaction wave had little effect on the scattering angle in the vertical section.In the horizontal section,the fragment scattering angle was symmetrically distributed, and the value of the scattering angle of the middle rank was approximately 0°. The scattering angle values of the fragments on both sides were similar. The minimum scattering angle values for the fragments occurred on both sides, while the maximum scattering angle value occurred in the middle rank. This indicates that the fragment scattering angle in the horizontal section was greatly affected by the rarefaction wave, which reduced the scattering angle value. The fragments in the middle rank were the least affected by the rarefaction wave, and the scattering angle value basically remained the same. For the fragments on both sides, the ends were most affected by the rarefaction wave, and correspondingly, the scattering angle value was also the smallest. Similarly,the maximum scattering angle value occurred in the middle of the fragment plate,and this was also the position that was the least affected by the rarefaction wave.

Table 10 Comparison of fragment distribution widths.

Table 11 Comparison of fragment distribution heights.
5.3. Numerical fitting formula
Both the numerical and experimental results demonstrated that the fragment size and shape had little influence on the fragment spatial distribution, and the maximum scattering angle of the fragment appeared on the edge of the fragment plate. Therefore,geometric parameters can be used to describe the fragment spatial distributions.The spatial distribution of the fragments at a distance of L from the metal casing can be expressed by the following
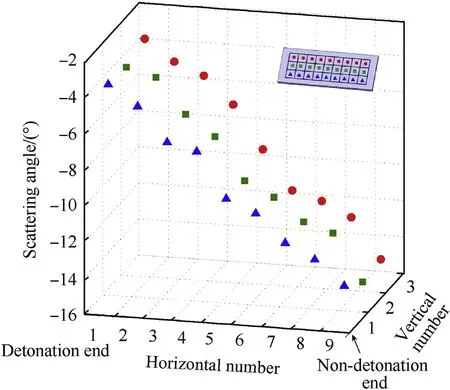
Fig.11. Numerical results of fragment scattering angle in vertical section.
function.

where X and Y are the width and height of the fragment spatial distribution, respectively, while d/l and h/l are the nondimensionalized parameters. The numerical results with L = 600 cm and l = 4.54 cm are presented in Fig.13.
Fig. 13 illustrates the relationship between the dimensionless parameters and fragment spatial distribution. The nondimensionalized width of the fragment spatial distribution (X/L)exhibits a distinct linear relationship with the geometric parameter d/l. Similarly, Y/L and h/l exhibit a linear relationship. Therefore,linear functions can be used to represent the relationship between the fragment spatial distribution and casing geometric parameters.Eqs. (28) and (29) can be expressed as follows:


Fig.10. Definitions of scattering angles in vertical and horizontal sections: (a) scattering angle in vertical section and (b) scattering angle in horizontal section.
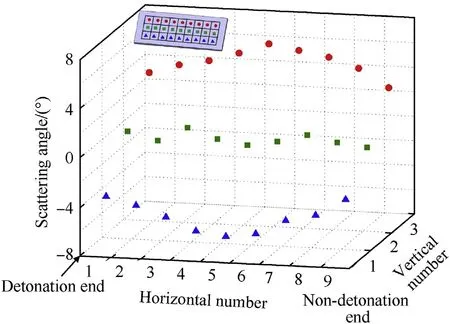
Fig.12. Numerical results of fragment scattering angle in horizontal section.

where a1,b1,a2,and b2are undetermined coefficients.The values of the undetermined coefficients were calculated by fitting the numerical simulation results. Eqs. (30) and (31) can be expressed as:

Eqs. (32) and (33) can be used to predict the fragment spatial distribution of the prismatic casing under internal explosive loading. To verify the accuracy of the formula for the fragment spatial distribution,the experimental data were compared with the formula results, as illustrated in Fig.14. The results obtained from the formula exhibited strong agreement with the experimental data, and the validity of the formula was therefore proven.
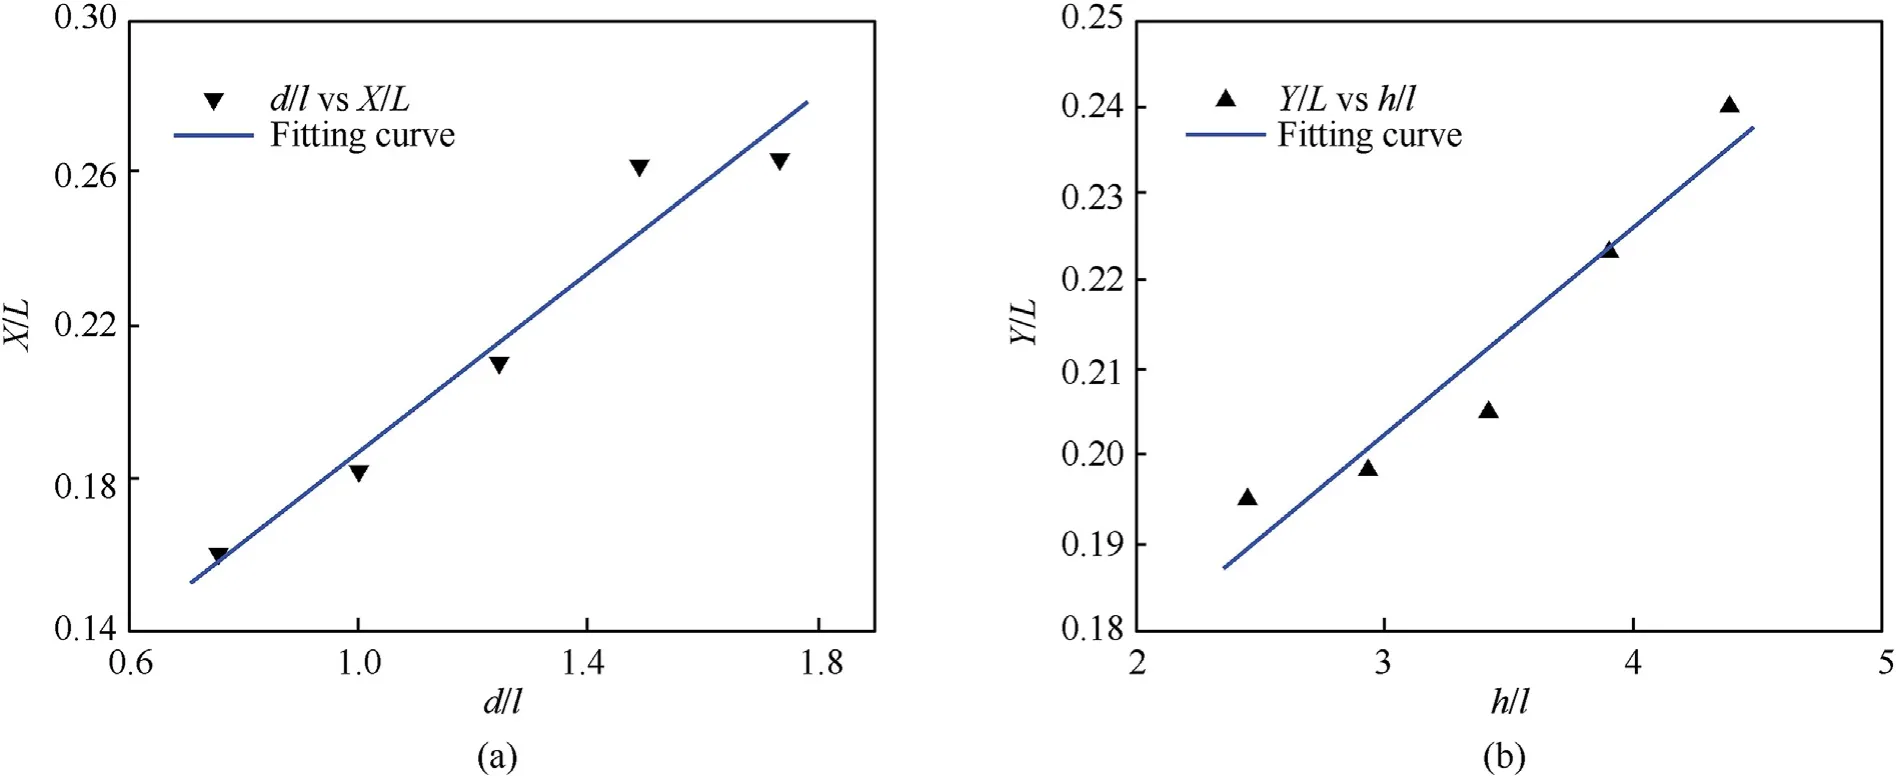
Fig.13. Fragment spatial distribution vs. casing geometric parameters and their fitting curves: (a) X/L vs. d/l and (b) Y/L vs. h/l.
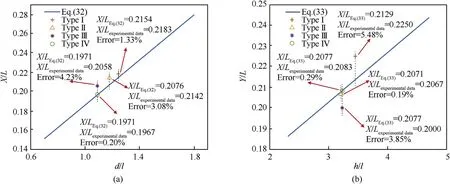
Fig.14. Comparison of numerical fitting formula and experimental data: (a) comparison of width of fragment spatial distribution with Eq. (32), and (b) comparison of height of fragment spatial distribution with Eq. (33).
6. Summary and conclusions
The fragment spatial distribution of the prismatic casing under internal explosive loading was investigated experimentally and numerically. The fragmentation process of the prismatic casing under internal explosive loading was analyzed by the proposed numerical method,following which the effects of the fragment size,fragment shape, and casing geometry on the fragment spatial distribution were determined.Moreover,fragment spatial distribution experiments were conducted on the prismatic casing with different fragment sizes and shapes.The experiments and numerical results demonstrated that the casing geometry is the main factor affecting the fragment spatial distribution. Furthermore, a formula considering the casing geometry parameters was proposed to predict the fragment spatial distribution of the prismatic casing under internal explosive loading, and the formula was validated by the experimental data. The following conclusions can be drawn:
1. A numerical method coupling Lagrangian marker points and a 3D fixed grid was proposed. The comparison between the experimental data and numerical results demonstrated that the new numerical method can effectively deal with the fragment spatial distributions under internal explosive loading.
2. The effects of the fragment size, fragment shape, and casing geometry on the fragment spatial distribution were determined by experiments and numerical simulation,which indicated that the casing geometry is the main factor affecting the fragment spatial distribution.
3. A formula including the casing geometry parameters was fitted,and the prediction results were consistent with the experimental data, indicating that the proposed formula can predict the fragment spatial distribution of prismatic casing under internal explosive loading.
Acknowledgement
This work was supported by the National Natural Science Foundation of China(Grant No.11822203and 11702026).
杂志排行
Defence Technology的其它文章
- Analysis of sliding electric contact characteristics in augmented railgun based on the combination of contact resistance and sliding friction coefficient
- Aerodynamics analysis of a hypersonic electromagnetic gun launched projectile
- Synergistic effect of hybrid Himalayan Nettle/Bauhinia-vahlii fibers on physico-mechanical and sliding wear properties of epoxy composites
- Study on dynamic response of multi-degree-of-freedom explosion vessel system under impact load
- An investigation on anti-impact and penetration performance of basalt fiber composites with different weave and lay-up modes
- Modeling and simulation of muzzle flow field of railgun with metal vapor and arc
