Experimental study on explosion dispersion process of a multi-layer composite charge under different initiation modes
2020-07-02XiowenHongWeiingLiWeninLiHeyngXuBolingWngWeiXio
Xio-wen Hong ,Wei-ing Li ,*,Wen-in Li ,He-yng Xu ,Bo-ling Wng ,Wei Xio
a ZNDY of Ministerial Key Laboratory, Nanjing University of Science and Technology, Nanjing, PR China
b School of Chemical Engineering, Nanjing University of Science and Technology, Nanjing, PR China
Keywords:Composite charge Initiation mode Blast wave Overpressure Dispersion radius
ABSTRACT The influence of initiation modes on the explosive dispersion process of the multi-layer composite charge(MCC) was studied. Overpressure sensors and high-speed photography system were used to investigate the energy release process of an MCC with a specific structure. The shock wave pressure and explosive dispersion characteristics of the MCC under different initiation modes were compared.The forming and expanding process of the shock wave of the composite charge under different initiation modes was determined. The separation position of the shock wave and fireball interface was determined. The calculation formulas of the shock radius and overpressure of the composite charge are presented. The radius of the shock wave of the composite charge was significantly affected by the initiation mode.Moreover, the development process of the composite explosive fireball under different initiation modes was analyzed, the variation rules of the composite charge dispersion radius and fireball dispersion velocity with time were obtained under the different initiation modes,the explosion energy release rate of composite charge under simultaneous initiation modes was the highest, and the peak overpressure under the simultaneous initiation mode was 1.61 times that of central single-point initiation.
1. Introduction
With the development of high-efficiency damage technology,the increasing political complexity under asymmetric warfare conditions requires that the damage effect of weapon systems can be accurately controlled. Its precise concept does not only lie in space, but also in the degree of damage energy release [1-3]. The matching of the inner and outer ring composite charge structures with different initiation modes is an approach toward achieving a controllable warhead energy output. In 2012, the British company QinetiQ proposed a multilayer annular composite charging structure [4]. The peak overpressure and quasi-static pressure were tested for two modes of the composite charging structure in a closed explosion chamber.The results revealed that there existed a difference in the energy output of the mode for different initiation stages. In 2016, the company investigated the fragmentation performance of two different grooved shells under the composite charge in two initiation modes.By recovering the fragments,it was found that the two-stage detonation power output of the composite charge with a shell had been preliminarily achieved [5].Vittoria [6] selected a combination of inner and outer dual-agents for different formulations, and a combination of formulations that met the low vulnerability requirements in accordance with MILSID-2105B. Held [7] conducted an in-depth investigation on the detonation performance of the dual inner and outer charges,analyzed the detonation characteristics of the dual charge,and thus provided the theoretical foundation for charge design. Kato et al.[8,9] investigated a composite charge comprising high-density explosives with tungsten powder and high-detonation-velocity explosives. They found that the detonation velocity of the composite charge was improved,and that the burst pressure more than doubled in comparison with the single-layer charge.
At present,most of the research on the explosion process of high explosives adopts the central single-point initiation. Zheng et al.[10]monitored the scattering process of the explosive product of a composite thermobaric charge using a high-velocity motion analysis system and investigated the temporal evolution of the dispersion radius of the explosive product. Hong et al. [11]investigated the explosive fireball temperature and dispersion process of explosive products with an MCC under central initiation using overpressure sensors, an infrared thermal imager, and highspeed photography, and compared the characteristics of the explosive fireball temperature, throwing motion, and postcombustion of the composite charge with different nondetonative materials. Additionally, they proposed to analyze the blast wave generated by the explosion of the MCC and scattering process of the explosive products to determine the dispersion radius, which has important theoretical and engineering application value with regard to realizing the controllable output energy of the warhead. However, the initiation mode also has a great influence on the energy output of the charge. Aline C. Anastacio et al.[12] carried out an experimental study on double ended initiation of the cylindrical charges. It was found that the double ended initiation gives a peak overpressure 1.6 times that for single ended initiation,but the impulse for double ended initiation was found to be the same as for single ended initiated charges. Hong et al. [13]investigated a numerical simulation method for the propagation of the blast wave of an MCC under different initiation modes and simulated the formation,propagation,and interaction of the shock wave for the composite charge, and the results were verified by a test. Therefore, many research results have been reported in relation to the shock wave pressure and dispersion characteristics of the single-layer charge or composite charge structure under the central single-point initiation mode.However,the difference of the shock wave formation process between the simultaneous initiation or external multi-point initiation of the composite charge, and its impact on the explosive dispersion characteristics,must be further studied to investigate the energy release process in the MCC explosion and dispersion. This will help reveal the explosion and damage mechanism of the MCC.
In this study,overpressure sensors and high-speed photography were used to study the energy release process of the MCC explosion. The shock wave pressure and explosive dispersion characteristics of the composite charge under the central single-point,external three points, and simultaneous initiation modes were analyzed and compared.Additionally,the variation rules of various characteristic parameters in the processes of shock wave formation,extended propagation,and dispersion were determined.Moreover,the energy output characteristics of the composite charge were preliminarily investigated.
2. Experimental design
2.1. Test sample and scheme
The charges used in this research was composed of three parts:the internal cylinder was composed of pellets of 8701, which included cyclo-1,3,5-trimethylene-2,4,6-trinitramine(RDX)95 wt%,(C7H6N2O4) DNT 3 wt%, polyvinyl acetate (CZ) 2 wt% with a diameter of 35 mm. The pellets had a density of 1.70 g/cm3and were glued together;the 8701 cores weighed 130 g.The non-detonative material [14] polyurethane with a thickness of 15 mm in the middle, which had a density of 1.05 g/cm3and the weight was 198 g.The external aluminized charge with a thickness of 15 mm that included a combination of RDX 76 wt%, aluminum powder(10.5 μm)20 wt%and wax 4 wt%,the weight of the outer layer was 518 g. The detonation of the inner core was initiated using a standard electrical detonator.The MCCs were 80 mm long and each had a total mass of about 846 g. Three types of initiation modes were used in the test; namely, single-point initiation, external three points initiation, and simultaneous initiation. The single-point initiation involved a standard electrical detonator; the other initiation methods were realized using a multi-point initiation network, which consists of three same length detonating cords with amplifying detonation (energy amplification devices,including two-stage detonation transmitting charge) and a detonator. Two tests were conducted in each group, the initiation modes and MCCs are shown in Fig.1.
2.2. Testing system and experimental setup
Fig.2 shows a schematic illustration of the experimental setup.The MCC was placed on a wooden platform with a height of 1 m.The end face of the pressure sensor was flush with the ground surface at a distance of 2 m and 3 m away from the grain.The blast wave overpressure data were recorded using four shock wave storage testers. The internal sensor was an 113B21 piezoelectric pressure sensor (PCB Piezotronics, Inc., USA), and the sampling frequency was 1 MSa/s.
A high-speed photographic system was used to record the process of shock wave formation, growth process of the explosive fireballs, and dispersion process of the explosive products with composite charges under different initiation modes. A FASTCAM Ultima APX high-velocity camera(Photron,Japan)was used with a shooting frame rate of 3000 fps,and a maximum frame resolution of 1280 (H) × 960 (V). The high-speed photographic-testing column was located 24 m away from the platform.
3. Blast wave overpressure characteristics of composite charge under different initiation modes
3.1. Measured overpressure value of shock wave with composite charge
The ideal air shock wave pressure time history can be described by a functional relationship:

where P is the overpressure at a fixed location, PSis the peak overpressure immediately behind the primary shock, t is the time after the arrival of the primary shock at that location and t+is the positive duration.
But when the peak overpressures above about one atmosphere,the Friedlander equation is no longer able to describe accurately the pressure time-histories, and it is necessary to introduce another coefficient,α, in a modified version of the Eq [15].

Fig.3 is a modified shock wave pressure curve obtained by least square method for the measured pressure time history curves under different initiation modes by Eq.(2),and the peak overpressure ΔPmof shock wave under different initiation modes is also obtained.
From Fig.3,it can be seen that the shock wave pressure curves of the same initiation mode at 2 m are relatively consistent, and the shock wave pressure time history curves of different initiation modes are obviously different.The peak pressure of the shock wave under the central single-point, the external three points and the simultaneous initiation mode are 219.93 kPa, 315.80 kPa and 354.96 kPa, respectively, which obtained by using the modified Friedlander equation.The simultaneous initiation is 1.61 times and 1.12 times of the central single-point and the external three points initiation respectively.
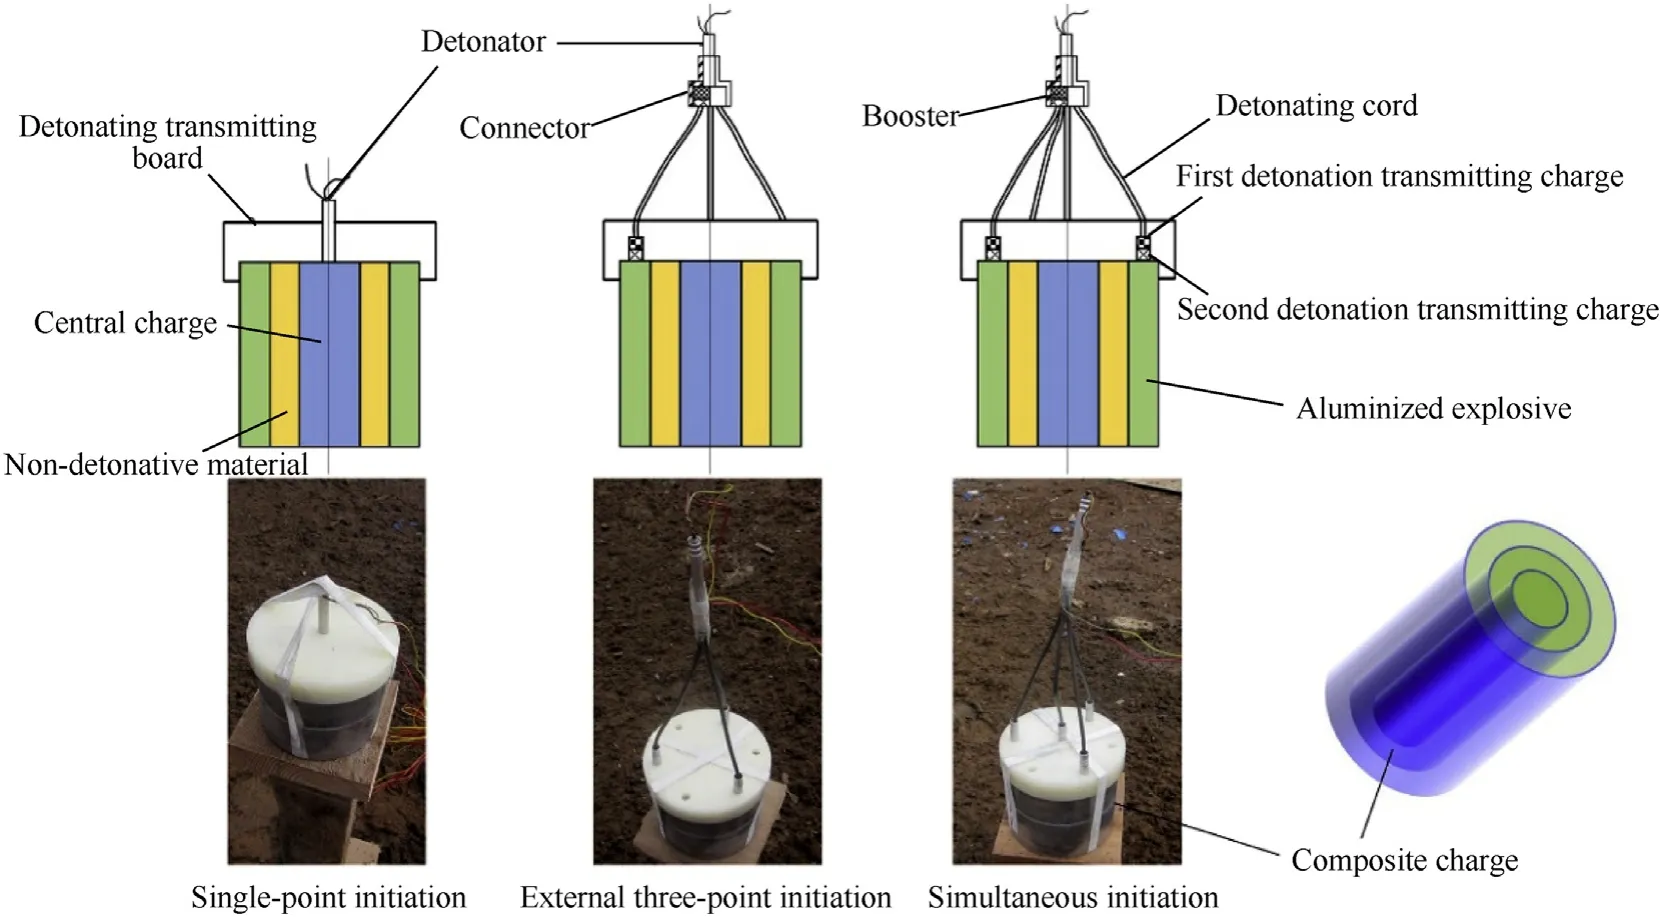
Fig.1. Initiation modes and the MCCs.
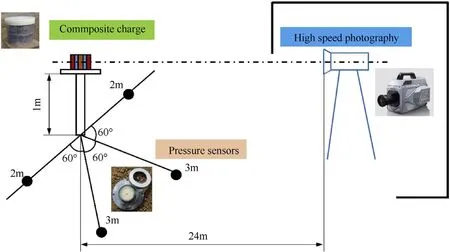
Fig. 2. Schematic illustration of experimental setup.
3.2. Comparison of shock wave formation and expansion process
The data measured by the overpressure sensor can quantitatively compare the energy output difference of the composite charge under different initiation modes. However, they cannot qualitatively describe the growth and development process of the shock wave of the composite charge under different initiation modes.The aluminum powders in the outer aluminum explosive of the composite charge will release a large amount of energy owing to the continuous reaction. This can supplement the energy of the formed frontier shock wave. The development state of the explosive fireball and the associated shock wave formed by the different initiation modes will also be different. Therefore, the processes of generation, development, and propagation of the shock wave can be clearly observed by processing the photographic images captured at high-speed. Thus, the formation and expansion processes of the shock waves of the composite explosive under different initiation modes can be further investigated.
The increase in density, which was caused by the blast wave,increased the refractive index of the air. This change of the refractive index at the shock wave edge visually distorted the background image.Therefore,the extended traces of the explosive fireballs and shock waves could be recorded using a high-speed photography system. To capture the boundary between the explosion fireball and the shock wave more accurately,a red and white sign post was set at a distance of 1.2 m from the explosion center before the test;the distance between the red and white sign posts was 20 cm, as shown in Fig. 4.

Fig.3. Measured pressure time history at 2 m and curve fitted with modified Friedland equation.
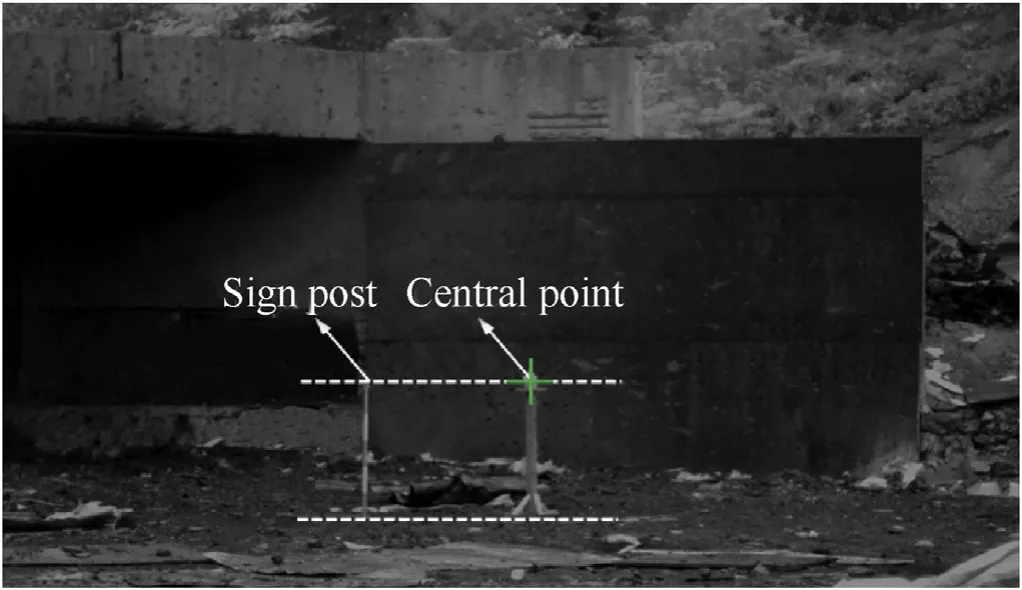
Fig. 4. Schematic diagram of high-speed photography calibration.
To visually describe the expansion process of the explosion shock wave of the composite charge,the high-speed camera images were processed using an image processing software (Adobe Photoshop CS6)to obtain the shock wave expansion trace,Fig.5 shows an image of 6.33 ms after the explosion of the composite charge.In order to clearly show the shock wave expansion trace,the image is pre-processed, it was found that the shock front is nearly hemispherical, with an ellipticity of ε = 0.95. The location of the shock wave front,Rs,is tracked along an angle of about 30°relative to the ground.This line of observation was chosen as it provided the best contrasted images for the greatest number of image frames. The fireball cloud has now expanded to a radius of 2.64 m, and the maximum radius of the fireball, Rf, is defined from the initiation point of origin to the maximum extent of the fireball edge.
Fig.6(a)shows the original image and Fig.6(b)was generated by subtracting the previous video frame. Hence, only the moving features, such as the blast wave and interface of the combustion products, were clearly visible in the image. Additionally, Fig. 6(c)shows a partially enlarged view of the shock wave trace.
The fireball diameter and edge trace of the shock wave obtained using high-speed photography were interpreted using the Autodesk Computer Aided Design software(AutoCAD 2014).The fireball boundary trace and shock wave expansion trace of the composite charge under different initiation modes are shown in Fig. 7. From the continuous high-speed photograph of the fireball and Fig.7,the growth of the fireballs had distinguishing characteristics. At first,the growth was rapid,but subsequently retracted.Moreover,this is simply an image of air particles. Next, the real radius of the explosive fireballs reached 60%-70% of the maximum radius of fireball within a short period of time. In this stage, the accompanying blast wave and fireball developed simultaneously. Owing to the cover of the explosive fire, the edge trace of the shock wave cannot be seen in the high-speed photographs.When the explosive fireball and shock wave extend to a certain radius simultaneously,the explosive shock wave separated from the fireball boundary surface and continued to move outward at a speed greater than the growth speed of the fireball,until it decayed to the speed of sound.The difference in the energy release of the composite charge under different initiation modes was analyzed according to the characteristic radius of the fireball growth,separation of the shock wave,growth rate of the fireball, and velocity of the shock wave.
From the analysis of the fireball boundary and the expansion trajectory of the shock wave shown in Fig.7,it can be seen that the separation positions of the blast wave and fireball interface were 2.6 m, 2.25 m, and 2.5 m, respectively, under the central singlepoint and external three points initiation modes, and the simultaneous initiation mode. This demonstrates that the central charge was attenuated by the non-detonative material after detonation under the central single-point initiation mode, while the fireball expanded slowly and the separation time of the associated shock wave followed. The charge reacted faster under the external three points initiation and the simultaneous initiation mode. Therefore,the fireball expanded faster and the separation from the associated shock wave occurred earlier. In Fig. 7, the expansion of the shock wave under external initiation occurred earlier than that of the simultaneous initiation mode.However,owing to the release rate of explosive energy,the expansion speed of the shock wave was lower than that of the simultaneous initiation mode. Additionally, the difference between the previous overpressure data at 2 m and 3 m can be explained by the separation position between the fireball boundary and the extended boundary of the shock wave. At 2 m,because the sensor was still inside the explosive fireball, the composite charge,which was initiated by the external three points and the simultaneous initiation,formed an overdriven detonation, and the strong compression wave accumulated rapidly inside the fireball.At this time,the intensity of the shock wave was greater than that of the central single-point initiation, and the pressure increased in the negative pressure zone. Owing to the farthest separation between the boundary of the explosive fireball and the shock wave when the composite charge detonated at the center,and the longer time when the fireball and shock wave moved together, the post-combustion reaction of the aluminum powder contributed substantially to the energy of the frontal shock wave,the pressure increase in the negative pressure zone was higher at 3 m,and the duration of the positive pressure was longer than that of the other initiation modes.

Fig. 5. Shock wave radius and fireball radius of the composite charge.

Fig. 6. Shock wave trace and local magnification under different initiation modes.
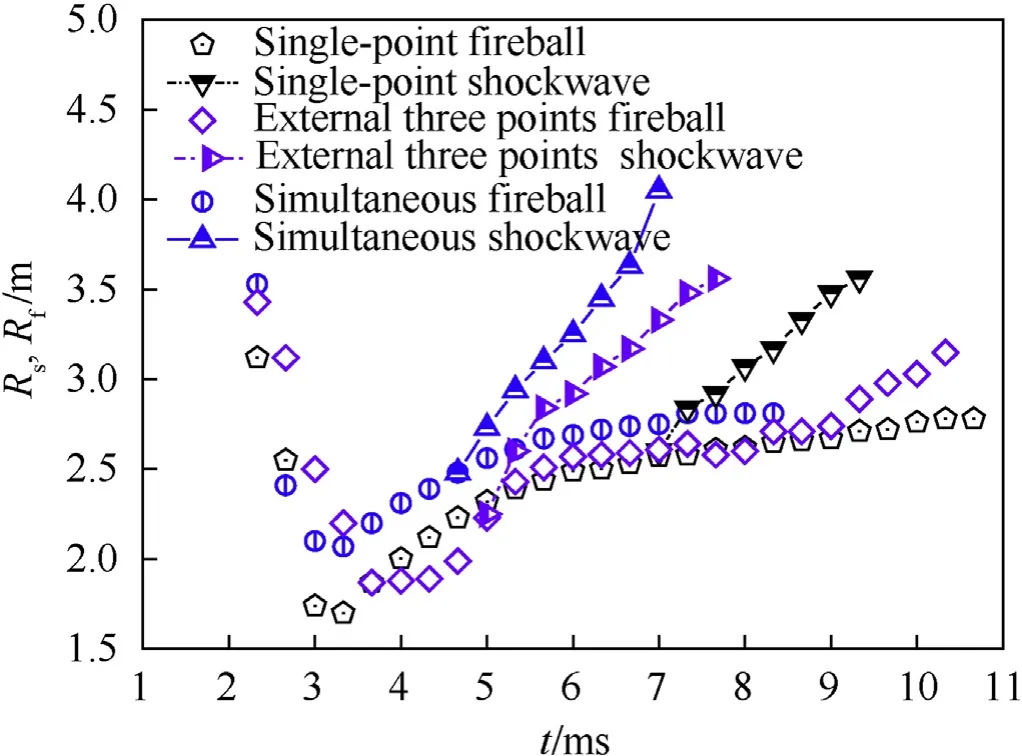
Fig. 7. Fireball boundary trace and expansion trace of shock wave.
3.3. Calculation of shock wave propagation distance and free field overpressure
According to the calibration results shown in Fig.4,the locations of the explosion centers at other times were determined. Additionally, the arrival locations of the shock waves at different times are marked on the high-speed photographs.Here,the orientation is 30°counter-clockwise along the horizontal direction of the charge centers.The specific processing results of the single-point initiation are shown in Fig. 8. The arrival location information of the shock wave at different times can be obtained by measuring the length of each line segment shown in Fig. 8.
The arrival location information of the shock wave with different initiation modes can also be obtained by the same method.Table 1 lists the arrival time data of the shock waves based on high-speed photographic image processing.
From Table 1, it can be understood that the arrival time of the shock wave is longer than that of the external three points,and the simultaneous initiation, when the composite charge occurs under the central single-point initiation caused by the different explosive energy release rates of the composite charges with different initiation modes. For the arrival position Rs(i.e., shock radius) of the shock wave,this is typically expressed as follows [16]:

where Rsis the shock radius,t is the time-of-arrival of the shock at Rs,a0is the speed of sound in the ambient air,and A,B,C,and D are the least-squares-fitted coefficients.
By calculating the time derivative of Eq. (3), the shock wave velocity u can be obtained as follows [16]:
Moreover, the Mach number M of the shock wave can be obtained as follows:

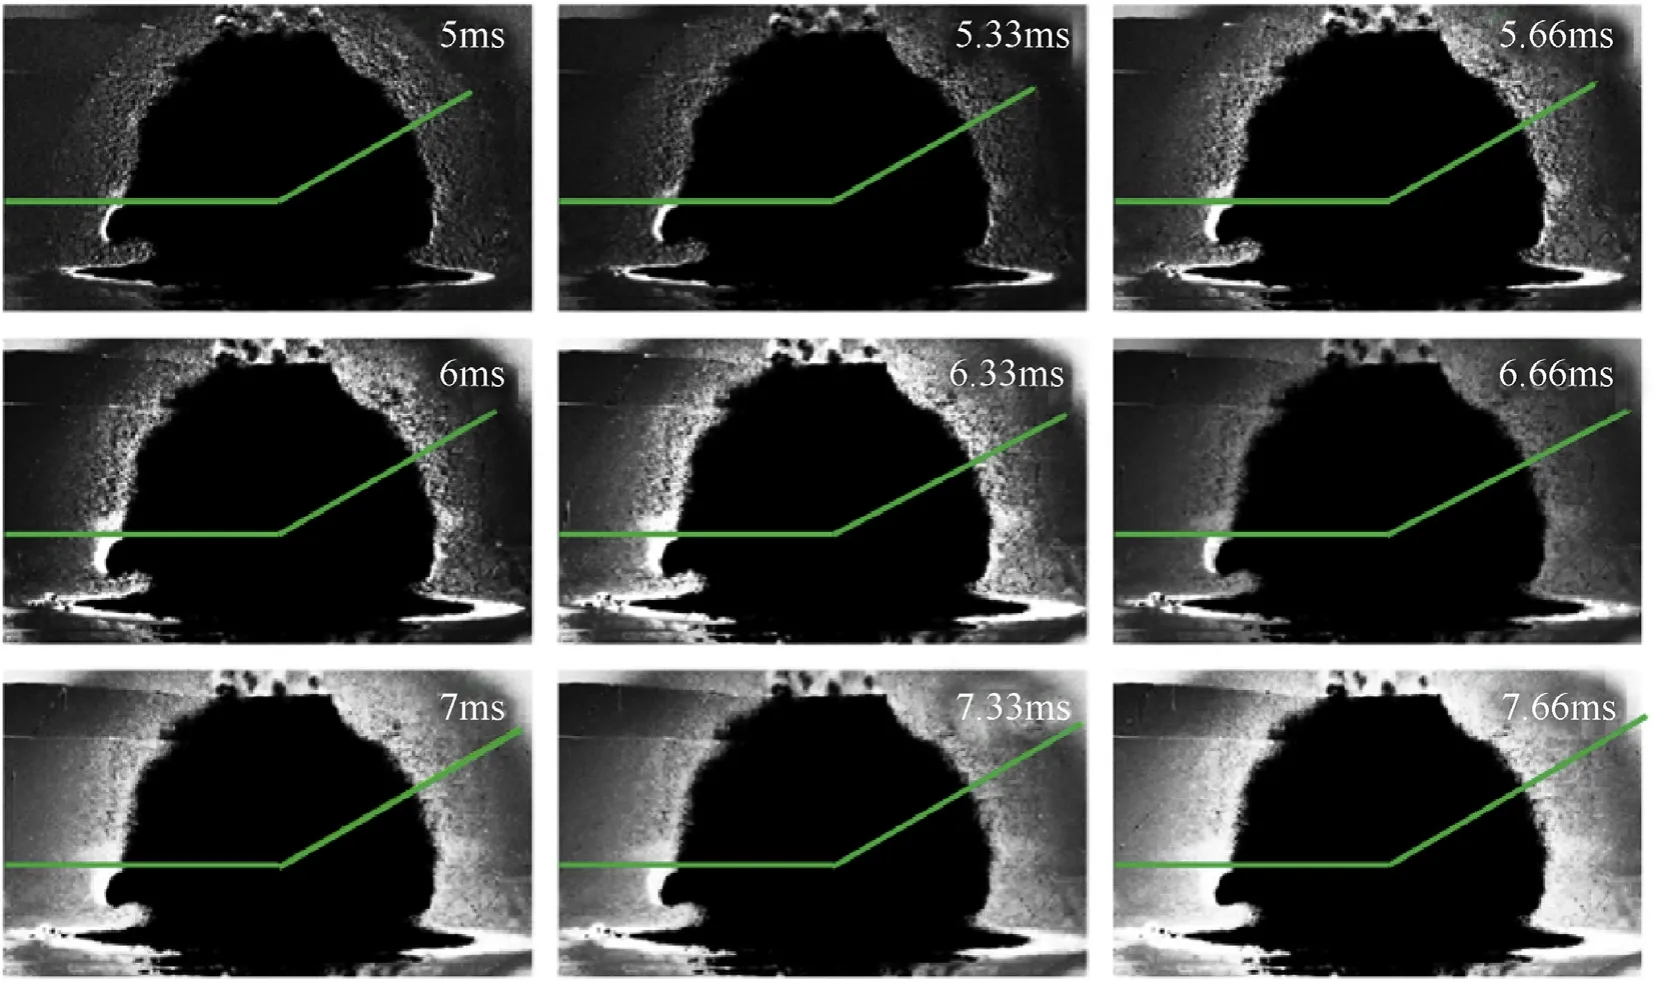
Fig. 8. Shock wave arrival position at different times for central single-point initiation.

Table 1 Arrival position and time of shock wave under different initiation modes.
The least squares method was used to process the data listed in Table 2.By fitting the measured time-of-arrival data to Eq.(4), the coefficient B was held constant at one. This ensured that, as the primary shock and the corresponding time t in Eq.(4)increased to infinity, the shock speed asymptotically approached the ambient speed of sound. Finally, the relationship between the shock radius and the arrival time of the shock wave was obtained as shown in Fig. 9. The fitting coefficient and fitting accuracy under different initiation modes are presented in Table 2.
From Fig. 9, it can be seen that there are obvious differences in the radius of the shock wave of the composite charge under the three initiation mode types. When the same radius of the shock wave was reached, the simultaneous initiation mode required the shortest time,and the time of the central single-point initiation was the longest. However, for the same amount of time, the simultaneous initiation mode was the largest, the central single-point initiation was the smallest, and the external three points initiation mode was between them.
From the fitting coefficients listed in Table 2,it can be seen that for different initiation modes, with the exception of the fitting coefficients B, the fitting coefficients essentially exhibited a trend of monotonous increase or monotonous decrease,which is consistent with the overall change of the three initiation modes shown in Fig. 8. Additionally, the fitting accuracy of the different initiation modes was over 96.5%. Thus, it was reasonable to use Eq. (3)to fit the shock radius data because this satisfied the requirements of the engineering calculation.
Because the overpressure measured in this study was the ground reflection overpressure,it was difficult to calculate the free field overpressure using the existing formula for the composite charge structure with a non-detonative layer. According to the relationship between the propagation distance of the shock wave,the velocity of the shock wave, and the Mach number obtained from the test, the free field overpressure was calculated indirectly to obtain the overpressure of the composite charge in the air of the free field.

Table 2 Fitting coefficients and accuracy of shock radius under different initiation modes.
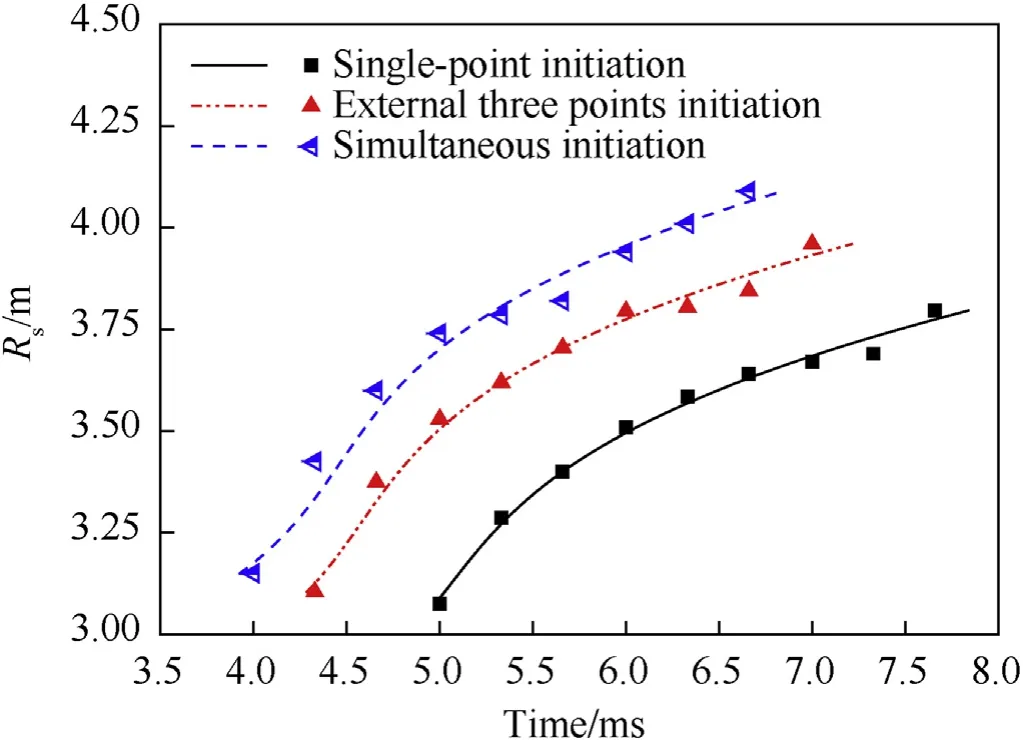
Fig. 9. Shock radius versus arrival time under different initiation modes.
According to the Rankine-Hugoniot equations for a blast wave shock, the following relationship holds.

where P is the shock wave pressure,P0is the ambient atmospheric pressure,γ is the adiabatic index,and the relationship between the peak overpressure of the shock wave and P can be expressed as follows:

For air, the adiabatic index γ is equal to 1.4 over a wide temperature range,and can be substituted into Eq. (7), as follows:

According to the relationship between the distance of the shock wave propagation and Eqs.(6)-(8)obtained by fitting,it is easy to obtain the variation curve of the shock wave overpressure of the composite charge with time and the propagation distance under different initiation modes. The shock wave overpressure curves versus time,and the propagation distance of the composite charge after the calculation are shown in Figs.10 and 11.
As can be seen in Figs.10 and 11,the shock wave overpressure of the composite charge under different detonation modes changed monotonously with time and distance,which is consistent with the pressure decay characteristics of the air shock wave. Owing to the cover of the explosion fireball,the shock wave position in the highspeed photograph cannot be easily observed. Thus, the overpressure is incomplete. Therefore, the peak overpressure of the simultaneous initiation mode shown in Fig.10 was lower than that of the central single-point initiation mode.As can be seen from the curves of overpressure with distance,the overpressure was still the largest in the attenuation process of the simultaneous initiation.
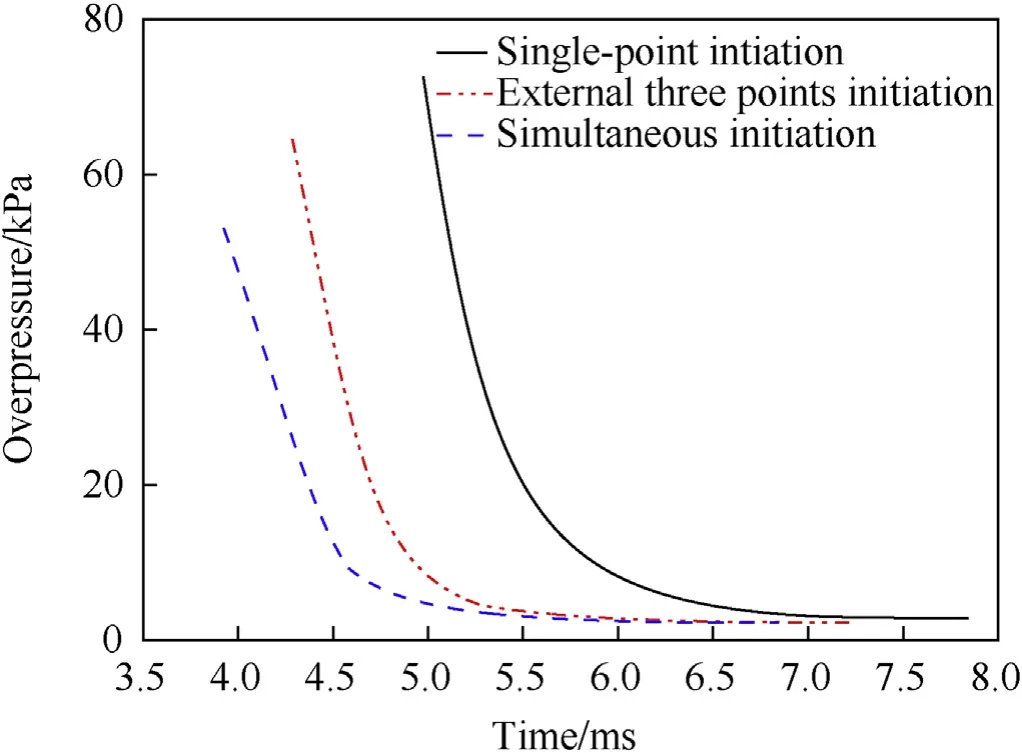
Fig.10. Overpressure curves with time.

Fig.11. Overpressure curves with distance.
4. Development process and dispersion characteristics of composite charge fireball
The aluminum-containing explosive in the outer layer of the composite charge is similar to the high-energy component of the thermobaric explosive. The high-calorific value metal powder can not only provide the shock wave energy in the explosion stage but can also improve the thermal effect after the explosion of the composite charge. Under the transient action of the high temperature and high pressure in the explosion shock, the aluminum powder will vaporize and liquefy, and will even result in highspeed burst combustion [17]. Moreover, the high-speed movement of the aluminum powder in the air will make the energy release more efficient. The different initiation modes will lead to the change of the reaction state and energy release of the aluminum powder during the explosion process. Therefore, it is necessary to analyze the dispersion characteristics of the detonation products resulting from the composite charges under the different initiation modes so as determine the variation law of the dispersion velocity and dispersion radius.
4.1. Development process of composite charge’s explosion fireball under different initiation modes
To investigate the development process and dispersion characteristics of the MCC’s explosion fireball, the development process of the explosion fireball of the MCC with different initiation modes was recorded using a high-speed photography system.Table 3 presents the development process of the dispersion explosive products and the fireball of the MCC at a typical time.
From the analysis presented in Table 3,it can be understood that the fireball growth and release reaction process of the composite charge under the different initiation modes can be approximately divided into three processes: (1) the initial oxygen-free explosion reaction of mainly the middle 8701 explosive molecular compound.This reaction did not require the participation of oxygen in the air,and the duration was as short as less than 1 μs. (2) The anaerobic combustion reaction of CO2,CO,and H2O in the first stage explosion products had a high temperature. At this stage, the reaction was also free of external air,and the duration was less than 1000 μs.(3)The explosion after the aerobic combustion reaction, which was mainly the rapid combustion reaction of the aluminum powder in the blunt black aluminum explosive:C,H,and CO in the explosion products and oxygen in the air. The duration was a few tens of milliseconds.The table only shows the stage of free diffusion for the fireball, but essentially contains the three stages of the fireball’s growth and release process.After 30 ms,with the post-combustion stage of aluminum, the energy released by the burning fireball gradually spread to the surroundings, the temperature gradually decreased, the brightness became dim, and white smoke formed and dispersed.
In different initiation modes, the first two processes ended at approximately 1666 μs. Under the central single-point initiation mode,the reaction time of the external charge was delayed owing to the attenuation of the non-detonative material after the detonation of the central charge.The fireball grew and stabilized for an extensive period of time,as was determined by comparing the size and brightness of the explosion fireball (Table 3) at 16.65 ms and 29.97 ms.
4.2. Effect of different initiation modes on dispersion characteristics of composite charge
The AutoCAD software was used to process the high-velocity photographic data of the explosive cloud expansion process, read the two-dimensional plane image of the explosive fireball, and record the expansion radius of the explosive fireball. An exponential function was used to fit the data of the radius R and time t, and the following relation was deduced between the expansion radius and the time for the explosion product of the post-combustion stage,as follows [10]:

where K,B,and C are constants;t is the explosive product dispersal time(ms);R is the corresponding dispersal radius(m).According to the property of exponential functions, as t→∞, the final dispersal radius is K.Table 4 presents the fitting coefficients of the expansion radius of the composite charge’s explosive products under different initiation modes and gives the fitting precision.The accuracy of the first fitting was determined using an exponential relation algorithm based on the test data,while the precision of the second fitting was determined by the exponential fitting method with fixed B and C after K, B, and C were averaged.
The second-order fitting of the data listed in Table 4 was used to characterize the effect of the different initiation modes on the change of the expansive radius of the cloud of the explosive products. The final value of C was 0.031. The value of K and B differed depending on the nature of the initiation modes.
The relationship between the dispersion velocity and the time of the explosion clouds was determined using the differential equation of the expansion radius, as follows:

The relationships between the expansion radius, dispersion velocity, and time for the explosive products under different initiation modes were determined using the fitting coefficients for the second fitting, as follows:

Fig.12 shows the fitting curve and the relationship between the expansion radius of the fireball, the dispersion velocity, and the time t of the composite charge explosive product under different initiation modes based on the experimental data.As can be seen in Fig.12, the trend of the dispersion radius described by the fitting function is consistent with time, and the fitting accuracy error is within 7%.
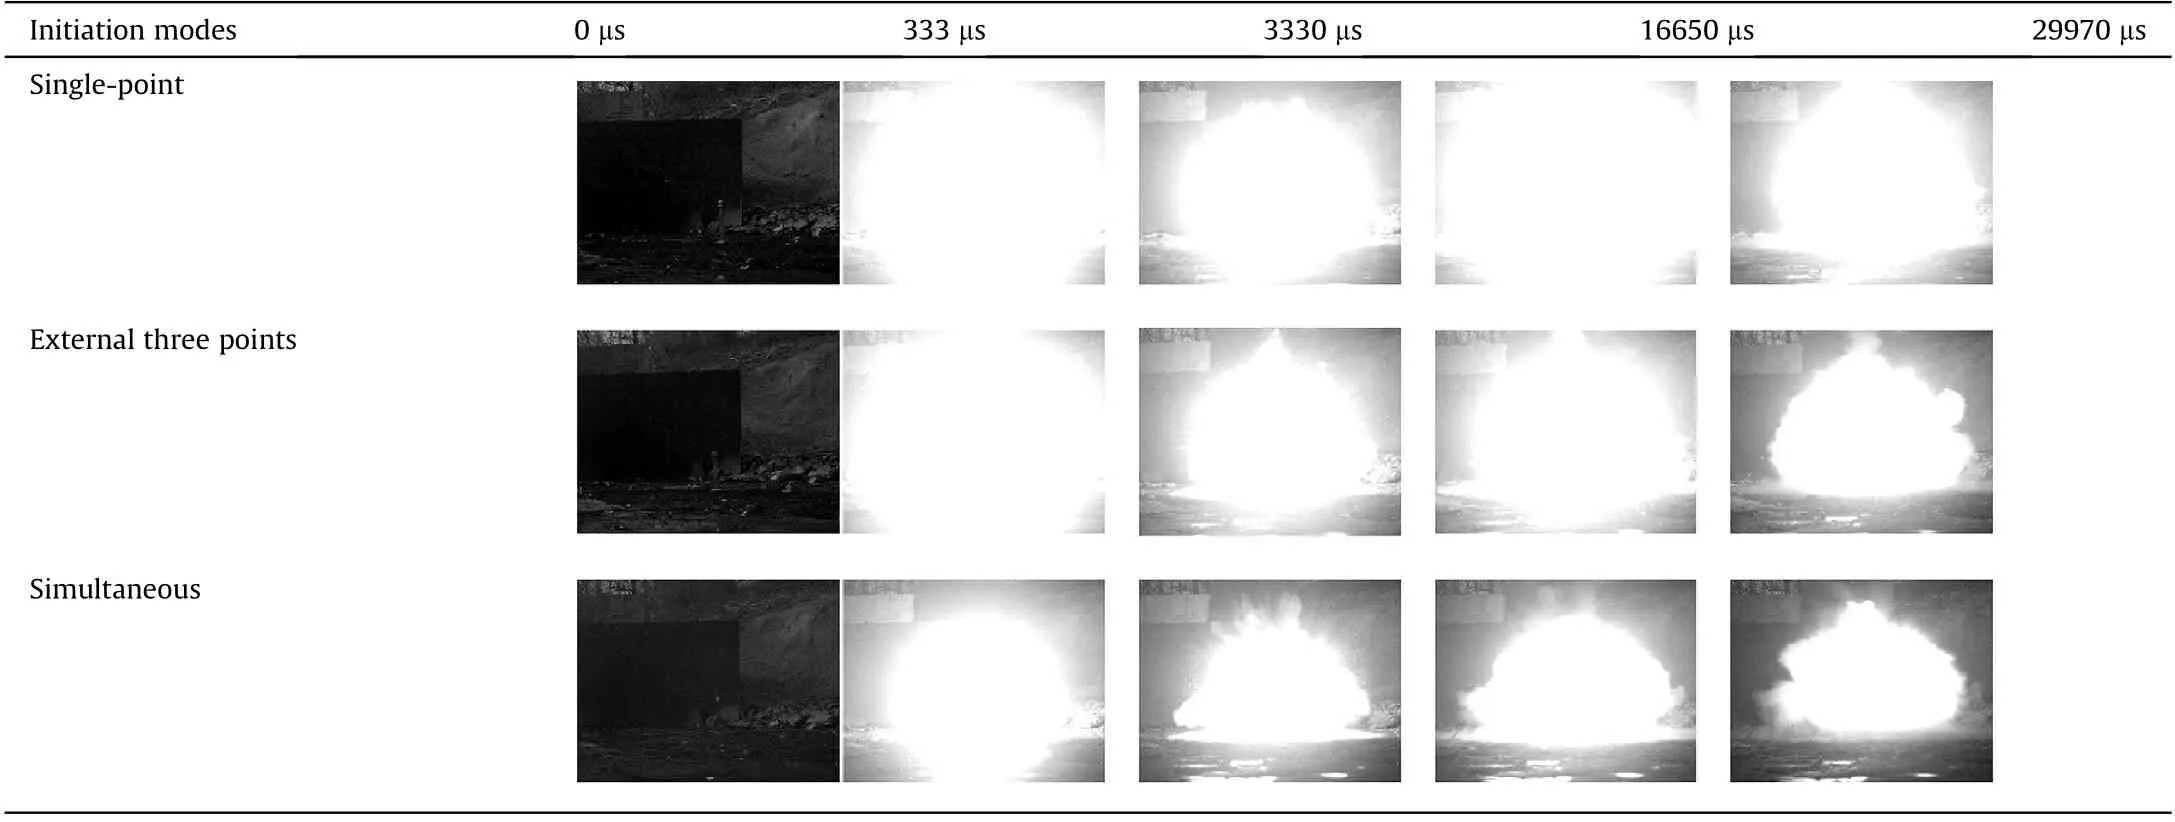
Table 3 Development and dispersion process of composite charge’s explosion fireballs under different initiation modes.

Table 4 Fitting coefficients of expansion radius of MCC’s explosive products under different initiation modes.
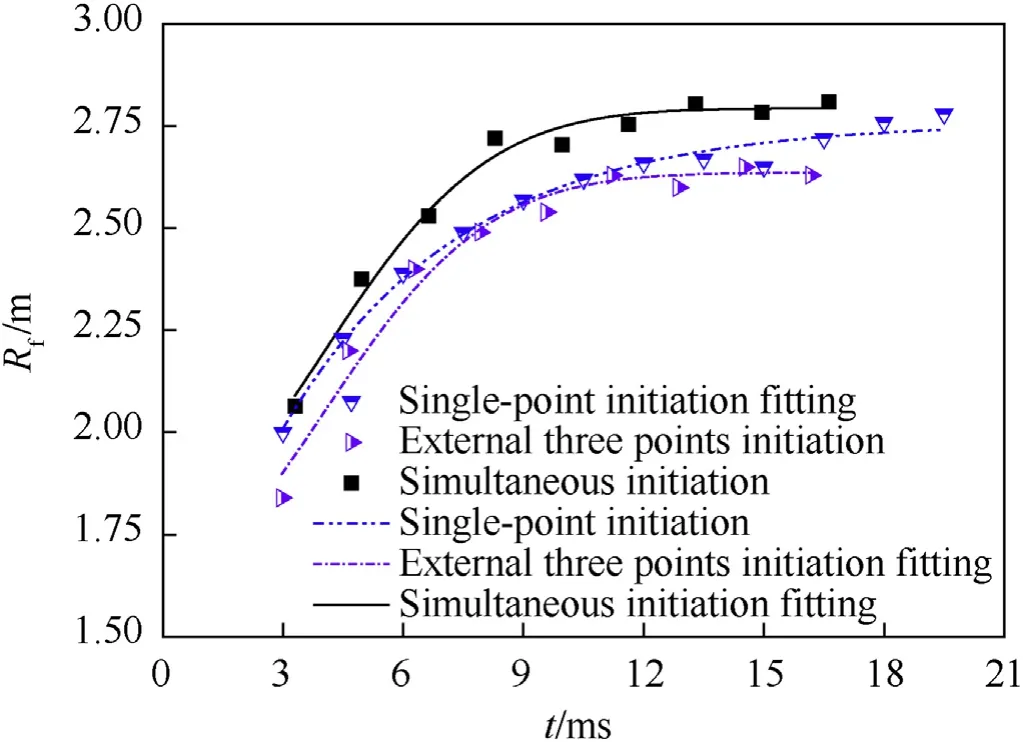
Fig.12. Test values and fitting curves of dispersion radius of explosive products with time.
Fig.13 presents the relationship between the fireball expansion radius Rf, dispersion velocity v, and time t in the post-combustion phase, wherein the expansion radius of the explosive fireball increased more rapidly,then slowly changed,and finally tended to stabilize within 3-9 ms. The dispersion velocity of the fireball began to stabilize and then exhibited a decreasing trend.
The reason for this behavior is that the non-detonative material with the composite charge structure hindered the expansion of the fireball. When the internal and external initiation occurred simultaneously,the growth radius of the explosion fireball was similar at 1-3 ms,but the dispersion velocity of the fireball decreased and the rate of change was large. The dispersion velocity of the fireball tended to zero within 1.5 ms.
The law of dispersion velocity of the composite charge under different initiation modes is consistent with that of the previous fireball expansion radius and time, as shown in Fig.14. The figure shows that the exterior initiation mode had the lowest dispersion velocity,whereas the internal and external simultaneous initiation mode had the highest dispersion velocity.
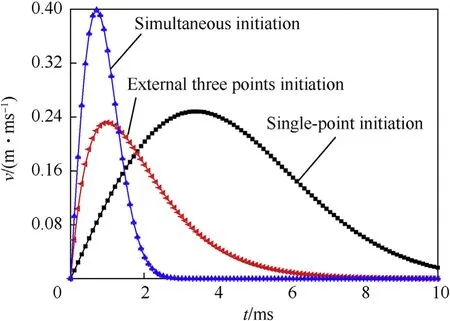
Fig.14. Variation curves of fireball dispersion velocity as function of time.
5. Conclusion
The following conclusions were drawn from this study:
The Friedlander equation was used to fit the measured pressure time history at 2 m,the peak overpressure under different initiation modes was obtained. The simultaneous initiation was 1.61 times and 1.12 times of that of central single-point and external three points initiation, respectively.
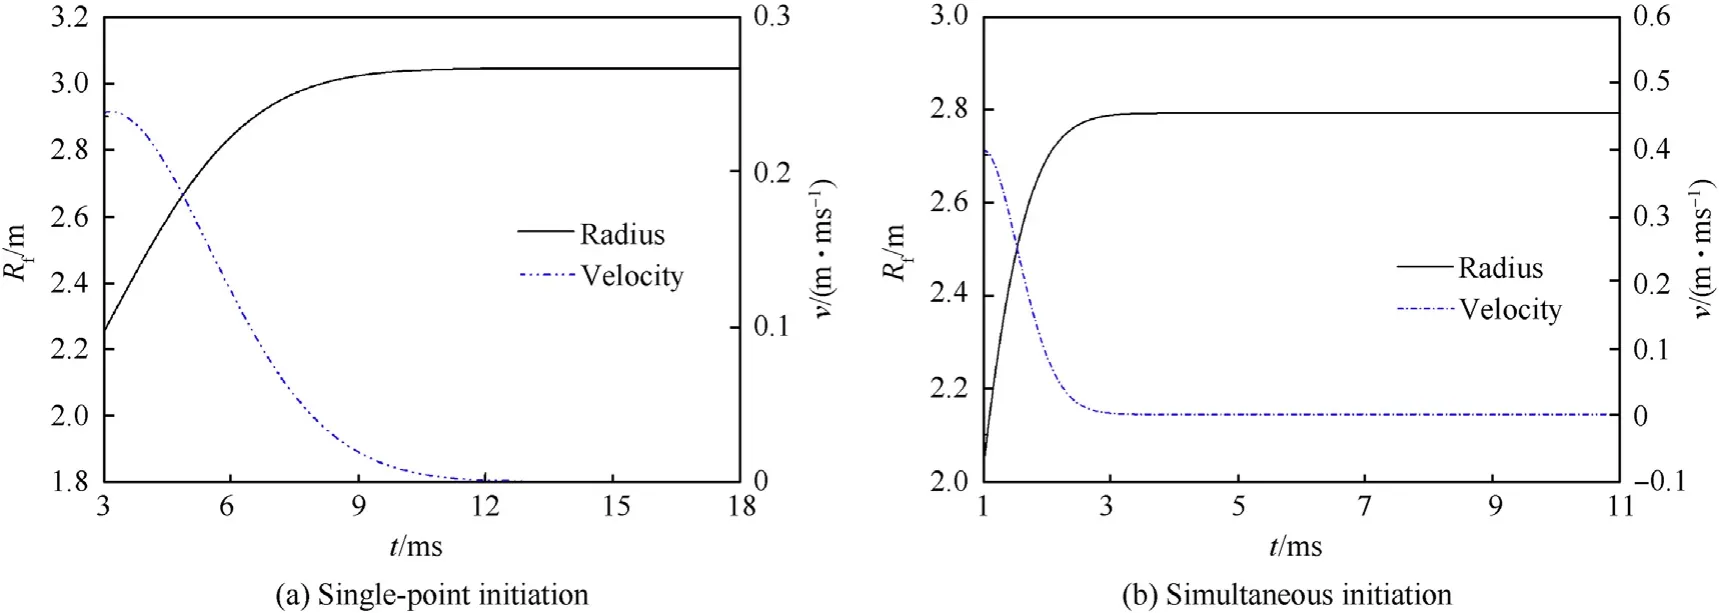
Fig.13. Relationship between fireball expansion radius Rf, dispersion velocity v, and time t in post-combustion phase under different initiation modes.
The forming and expanding processes of the composite charge’s shock wave under different initiation modes were obtained.Among them,the expanding speed of the fireball was faster in the external three points initiation,and the internal and external simultaneous initiation modes. The separation positions of the shock wave and fireball interface are 2.6 m,2.25 m and 2.5 m respectively under the central single-point, the external three points initiation, and the internal and external simultaneous initiation modes.The explosive energy release rate of the composite charge under the simultaneous initiation modes is the highest, and the single-point initiation mode is the lowest.
The formulas for calculating the shock radius and overpressure of the composite charge under different initiation modes were obtained by the least squares fit.Obvious differences were observed in the radius of the shock wave. Under the same shock radius, the shortest time required for the internal and external initiation mode is about 4 ms,while the longest time for the single-point initiation is about 5 ms.Additionally,the calculated variation law of the shock wave overpressure is consistent with the law of the shock wave overpressure attenuation in the air of the free field.
The development process of the explosive fireball of the composite charge under different initiation modes was analyzed, and the dispersion law of the composite charge was determined. The dispersion radius curve of the composite charge and the dispersion velocity of the fireball with time under different initiation modes was obtained by fitting.The initial process of the dispersal velocity of the central single-point initiation fireball was stable and then gradually decreased. The dispersion velocity of the explosive fireball with simultaneous initiation exhibited a decreasing trend and the changing time is less than 1.5 ms. Moreover, the dispersion radius was the largest.
Declaration of competing interest
We declare that we have no financial and personal relationships with other people or organizations that can inappropriately influence our work,there is no professional or other personal interest of any nature or kind in any product, service and/or company that could be construed as influencing the position presented in,or the review of, the manuscript entitled.
杂志排行
Defence Technology的其它文章
- Analysis of sliding electric contact characteristics in augmented railgun based on the combination of contact resistance and sliding friction coefficient
- Aerodynamics analysis of a hypersonic electromagnetic gun launched projectile
- Synergistic effect of hybrid Himalayan Nettle/Bauhinia-vahlii fibers on physico-mechanical and sliding wear properties of epoxy composites
- Study on dynamic response of multi-degree-of-freedom explosion vessel system under impact load
- An investigation on anti-impact and penetration performance of basalt fiber composites with different weave and lay-up modes
- Modeling and simulation of muzzle flow field of railgun with metal vapor and arc
