Experimental investigation on dynamic response and damage models of circular RC columns subjected to underwater explosions
2020-07-02TieshunZhungMingyngWngJunWuChengyuYngToZhngChoGo
Tie-shun Zhung , Ming-yng Wng , Jun Wu , Cheng-yu Yng , To Zhng ,Cho Go
a State Key Laboratory of Disaster Prevention and Mitigation of Explosion and Impact, Army Engineering University of PLA, Nanjing, 210007, China
b Research Institute for National Defense Engineering of Academy of Military Science, PLA, Luoyang, 471023, China
Keywords:Underwater explosion Reinforced concrete (RC) columns Load distribution characteristics Dynamic response Damage models
ABSTRACTReinforced concrete (RC) columns are widely used as supporting structures for high-piled wharfs. The study of damage model of a RC column due to underwater explosion is a critical issue to assess the wharf’s antiknock security.In this study,the dynamic response and damage model of circular RC columns subjected to underwater explosions were investigated by means of scaled-down experiment models.Experiments were carried out in a 10.0 m diameter tank with the water depth of 2.25 m,under different explosive quantities(0.025 kg-1.6 kg),stand-off distances(0.0 m-7.0 m),and detonation depths(0.25 m-2.0 m). The shock wave load and dynamic response of experiment models were measured by configuring sensors of pressure, acceleration, strain, and displacement. Then, the load distribution characteristics, time history of test data, and damage models related to present conditions were obtained and discussed. Three damage models, including bending failure, bending-shear failure and punching failure,were identified.In addition,the experience model of shock wave loads on the surface of a RC column was proposed for engineering application.
1. Introduction
High-piled wharf is an important form of port terminal due to its ease of construction, good applicability and low cost. Under the current international political situation, infrastructures may become attractive strike target in wars or terrorist activities due to their accessibility and potential impact on economic activity [1].Hence, predicting the likelihood and extend of infrastructure damage due to various loads has drawn considerable attention in recent years[2,3].The underwater explosion is a form of attack that may be encountered by high-pile wharfs. However, previous studies about high-piled wharfs mainly focused on the structural response caused by normal loads [4-9], such as the lateral static load[4],corrosion in marine environment[7],ship impact load[8],and influence of earthquake duration [9]. A typical high-piled wharf consists of reinforced concrete (RC) columns, working platforms and upper equipments [4]. RC columns are used to support working platforms (see Fig. 1), where the top of the column is connected to the upper working platform, and the bottom penetrates into the seabed. RC columns are vitally important components to the overall high-piled wharf structures.Hence,this study is intended to investigate the damage model of reinforced concrete(RC) columns of the high-piled wharf subjected to underwater explosions.
The geometry and structure of RC columns for wharfs are similar to the supporting columns for bridges. To prevent bridges from destruction, many researchers have already studies the damage models of supporting columns for bridges. Williamson et al. [10]conducted experimental test on the response and failure models of RC columns under blast loading in air and found that the primary response model for columns is base shear under the condition that the explosive is close to the ground. Yi et al. [11] established a numerical model for simulation of blast loading on bridge components. Both the reflection and diffraction of blast loading were simulated. Six main types of failure models were identified:eroding of column bottom concrete,shearing of a column from the footing, rebar severance, breakage of the column, spalling of the concrete surface and plastic hinge formation[11,12].Because of the multi-physics nature of the underwater explosion, damage modes of RC columns caused by underwater explosions is more complex than that caused by blast loads in air.
Experiment and numerical simulation are two commonly used methods for study of underwater explosions. Many simulation works on various underwater explosion processes were performed.Wang and his colleagues [13-15] focused on the concrete gravity dams subjected to underwater explosions. A coupled Lagrangian-Eulerian model was established to simulate the dynamic response of concrete gravity dams and a comparison was conducted between the underwater explosion and the air explosion. Results showed that the underwater explosion causes significantly more damage to the dam than the same quantity of explosive in air. Subsequently,the coupled model was used to derive the analytical diagram which allows for a quick calculation of the concrete gravity dam performance subjected to shallow water explosions. Zhang et al. [16]attempted to examine nonlinear responses of an arch dam due to underwater explosions. Both the water-structure interaction and the contraction-joint non-linearity were considered. Two major failure modes of the arch dam were identified,including a break-off failure close to the explosive source,and tensile cracking of the dam base.Gong et al.[17]proposed a computational approach for safety assessment of submerged pipelines subjected to the underwater explosion.The interaction between the water and the pipeline was modeled by using the coupled finite-element and boundaryelement method. Above numerical studies mainly focused on the damage of the structure by the explosion shock wave.
In addition to the explosion shock wave,the pulsating pressure generated by bubble pulsation is also an important factor affecting the structural response characteristics.The shock wave pressure is high but the duration is very short, while the pressure caused by the bubble pulsation is low but the duration is long. Barras et al.[18] used ALE method to study the bubble dynamics produced by an underwater explosion. Efforts were made to reduce the computing time to handle the problem of large mesh domain and long time scale. Zhang et al. [19,20] proposed a smoothed particle hydrodynamics(SPH)model to simulate the interaction process of an underwater shaped charge with a metallic target,and the entire process (from detonation to metal jet, until penetration into the plate) was successfully reproduced by the model. Numerical simulation can effectively reproduce the process of explosion shock waves and explosion bubbles in the underwater explosion, which helps to deeply understand the phenomenon and the explosioninduced damage process. However, the numerical model should be properly validated by the experiment before it is used for practical engineering problems.
Using a water tank to conduct experiment is an economical and effective way to investigate phenomena of underwater explosion.Rajendran and Narasimhan [21] carried out underwater explosion experiments on air-backed 4 mm steel circular plates(290 mm)and rectangular plates (300 × 250 mm) with various stand-off distances. The linear response of plates was measured by the strain gauges.Lu et al.[22]designed a 1:200 scale experimental model to study the effect of the underwater shock wave on a concrete dam.A device was designed to measure the impact force at the upstream face of the dams. Damage models of the experimental dams were identified. Hung et al. [23] experimentally investigated dynamic responses of cylindrical shell structures subjected to underwater explosions in a 4.0 m × 4.0 m × 4.0 m water tank.Both the linear and nonlinear response (i.e., pressure, strain, acceleration) of the structures were measured by varying the stand-off distance from 210 to 35 cm. Li et al. [24] conducted both numerical and experimental study on the propagation of the shock wave and the bubble pulsation of an underwater explosion and the dynamic response of a cylindrical shell in a water tank. The predicted results were compared with the experimental data in terms of the peak pressure of the shock wave, the period of the bubble pulsation and the displacement of the cylinder.Cui et al.[25]performed small-charge(4.0 g PETN composite) underwater explosion experiments to investigate bubbles subjected to various boundary conditions. By using high speed camera and pressure sensors, the behaviour of explosion bubbles and features of associated pressure pulsation were studied.Yang et al.[27]presents a study on the behaviour of RC slabs subjected to air and underwater contact detonation (6 g TNT).It was also found that the damage of the RC slabs induced by underwater contact explosion is significantly larger than that caused by air contact blast. For circular RC columns, experiments were carried out in air for bridge structures[28-30].Regarding the damage of the circular RC column in the high-piled wharf due to underwater explosion,there is no relevant work report at present.
In this study, the damage modes of circular RC columns subjected to underwater explosions were studied. This paper is organized as follows: In Sec. 2, the scaled-down experiment models,including the RC column model and the steel pipe model, were introduced. The two models adopt the same geometry and experimental conditions, but take on different tasks. Experiments were carried out in a 10.0 m diameter water tank with the water depth of 2.25 m. Different experimental conditions were examined by pressure sensors, strain sensors, displacement sensors, and acceleration sensors. In Sec. 3, measured results obtained in present experiments were discussed. By analyzing measured data of pressure sensors at the measuring points, the load distribution characteristics due to explosive shock waves were analyzed. Three damage models of circular RC columns were identified.
2. Experiment
2.1. Experiment models
We first introduce the schematic of the experiment model of a single RC column subjected to the underwater explosion, as illustrated in Fig.2.Accordingly,two types of experiment models were proposed,which are the circular RC column(model-1,Fig.3(a))and the steel pile(model-2,Fig.3(b)).The circular RC column(model-1)was expected to undergo plastic deformation under the explosive loading, while the steel pile (model-2) did not deform. Herein,model-2 was used to test the explosive load acting on the structure by installing pressure sensors in the surface of the pile.
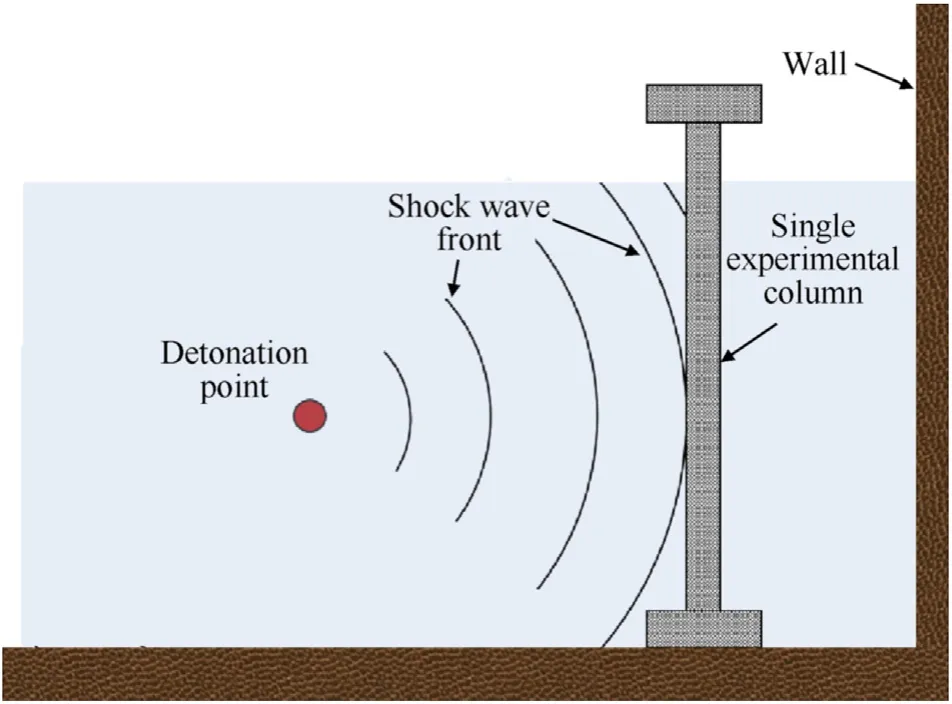
Fig. 2. The scaled-down experiment model using single RC column for the present experiment.
The experiment models were established according to the actual geometry of RC columns of a typical high-piled wharf, with the similarity ratio of 1:8.The actual size of the structure is too large to be tested in the available experiment tank (diameter 10.0 m).Hence, the experiment models were scaled proportionally according to the actual size of the structure. The underwater explosion test can be carried out in the existing water tank to reduce the influence of the wall boundary on the experimental analysis.
(1) Model-1: the circular RC column
The RC column was manufactured by integral casting. The height of the column body is 2.70 m and the cross-section diameter of the column is 0.1 m.Two ends of the column have the thickness of 0.1 m and the diameter of 0.3 m.As shown in Fig.3(c),8 HRB335 ribbed bars with diameter of 6.0 mm were used for longitudinal reinforcement. These bars are evenly arranged along the circumference.The concrete material was made with fine aggregate ratio,where the stone particle size is less than 5.0 mm, and the sand particle size is less than 0.50 mm. The strength of the RC concrete was tested after 28 days, and its compressive strength was about 52.0 MPa.
(2) Model-2: the circular steel pile
In order to test the load distribution on the surface of the column, steel piles with the same structure as the RC column were manufactured, as shown in Fig. 3(b). The external diameter of the steel pipe is 0.1 m and the wall thickness of the pipe is 5.0 mm.The height of the steel pipe is 2.5 m, which is slightly shorter than the RC column. Pressure sensors were installed in the surface of the pipe, as shown in Fig. 4(b).
We placed ten pressure sensors on each model of steel pipe,where five sensors(P1-P5)are arranged on the windward side and the other five sensors (P6-P10) are on the leeward side. The pressure sensors were arranged in the interior of the steel pipe with the surface being flush with the external surface of the steel pipe. To show the installation of the pressure sensor more clearly,we give a detailed image of the position of the pressure sensor, as shown in Fig. 4(c). In this study, attentions mainly focused on the damage effect of explosion on the RC column structure. The purpose of arranging pressure sensors is to test the shock wave load acting directly on the surface of the structure.
Based on these pressure sensors, the shock wave pressure(including reflection and diffraction) can be tested. The test signal was transmitted to the external acquisition device through the cable in the steel pipe.
2.2. Experiment setup
The experiment was carried out in a cylindrical water tank with the diameter of 10.0 m and the water depth is 2.25 m.The bottom of the tank is covered with a buffer sand cushion having a thickness of 0.5 m.Experimental specimens were installed vertically(Fig.3)by fixing both two ends of the column.
For RC columns (model-1), as shown in Fig. 4(a), displacement and acceleration sensors are installed on the outer surface of the column, and strain gauges are arranged attached to the reinforcement inside the column.For steel pipes(model-2),pressure sensors are arranged on the upstream surface and the downstream surface(see Fig.4(b)).The loading characteristics of underwater explosions under different experimental conditions can be measured. The dynamic response and deformation behaviors of the RC column can be measured by these sensors.
Once the configuration was complete, as shown in Fig. 5(b),water was injected into the tank, and the test specimen is submerged with the water depth of 2.25 m.The explosive was charged with the TNT group, and was placed in a certain depth below the water by a suspension device. After the explosion, the water was drained to check the deformation and damage of the column.
2.3. Experiment conditions
In order to study the influence of different factors,including the explosive quantity (W), stand-off distance (R), detonation depth(H), different experimental conditions were tested. The experimental conditions are listed in Table 1.The surface pressure,strain,displacement, acceleration were measured under explosion load for each of the conditions. Each test was repeated three times for reproducibility of data.
The proportional stand-off distance (is defined as:

where R is the stand-off distance,m;W is the quantity of explosive charges, kg.
3. Results and discussion
3.1. Shock wave pressure and spatial distribution
3.1.1. Time history of the shock wave pressure
Fig.6 shows the time history of the pressure at measuring point 3 (P3) with the explosive quantity (W) varying from 0.05 kg to 0.80 kg, at the stand-off distance 1.0 m and the detonation depth 1.0 m. For W ≤0.20 kg, as shown in Fig. 6(a)~(c), there are two peaks in the curve, where the primary peak corresponds to reflection shock wave, and the secondary peak corresponds to bubble pulsation.For other conditions(i.e.,W >0.20),as shown in Fig. 6(d)~(e), there is only one peak in the curve. The secondary bubble pulsation lags behind the shock wave propagation.It can be seen from Fig. 6 that the time difference between two peaks increases with the increase of the explosive quantity.
Fig. 6(f) presents the time history of the pressure at P8(W=0.4 kg). The measuring point P8 was located on the back surface of the steel pipe, such that the diffraction shock wave pressure was measured. It can be seen from the time instant at which the primary peak pressure is located,that the position of the reflection shock wave and the position of the diffraction shock wave substantially coincide. Hence, it can be considered that the reflection shock wave and the diffraction shock wave act on the surface of the steel pipe at the same time.
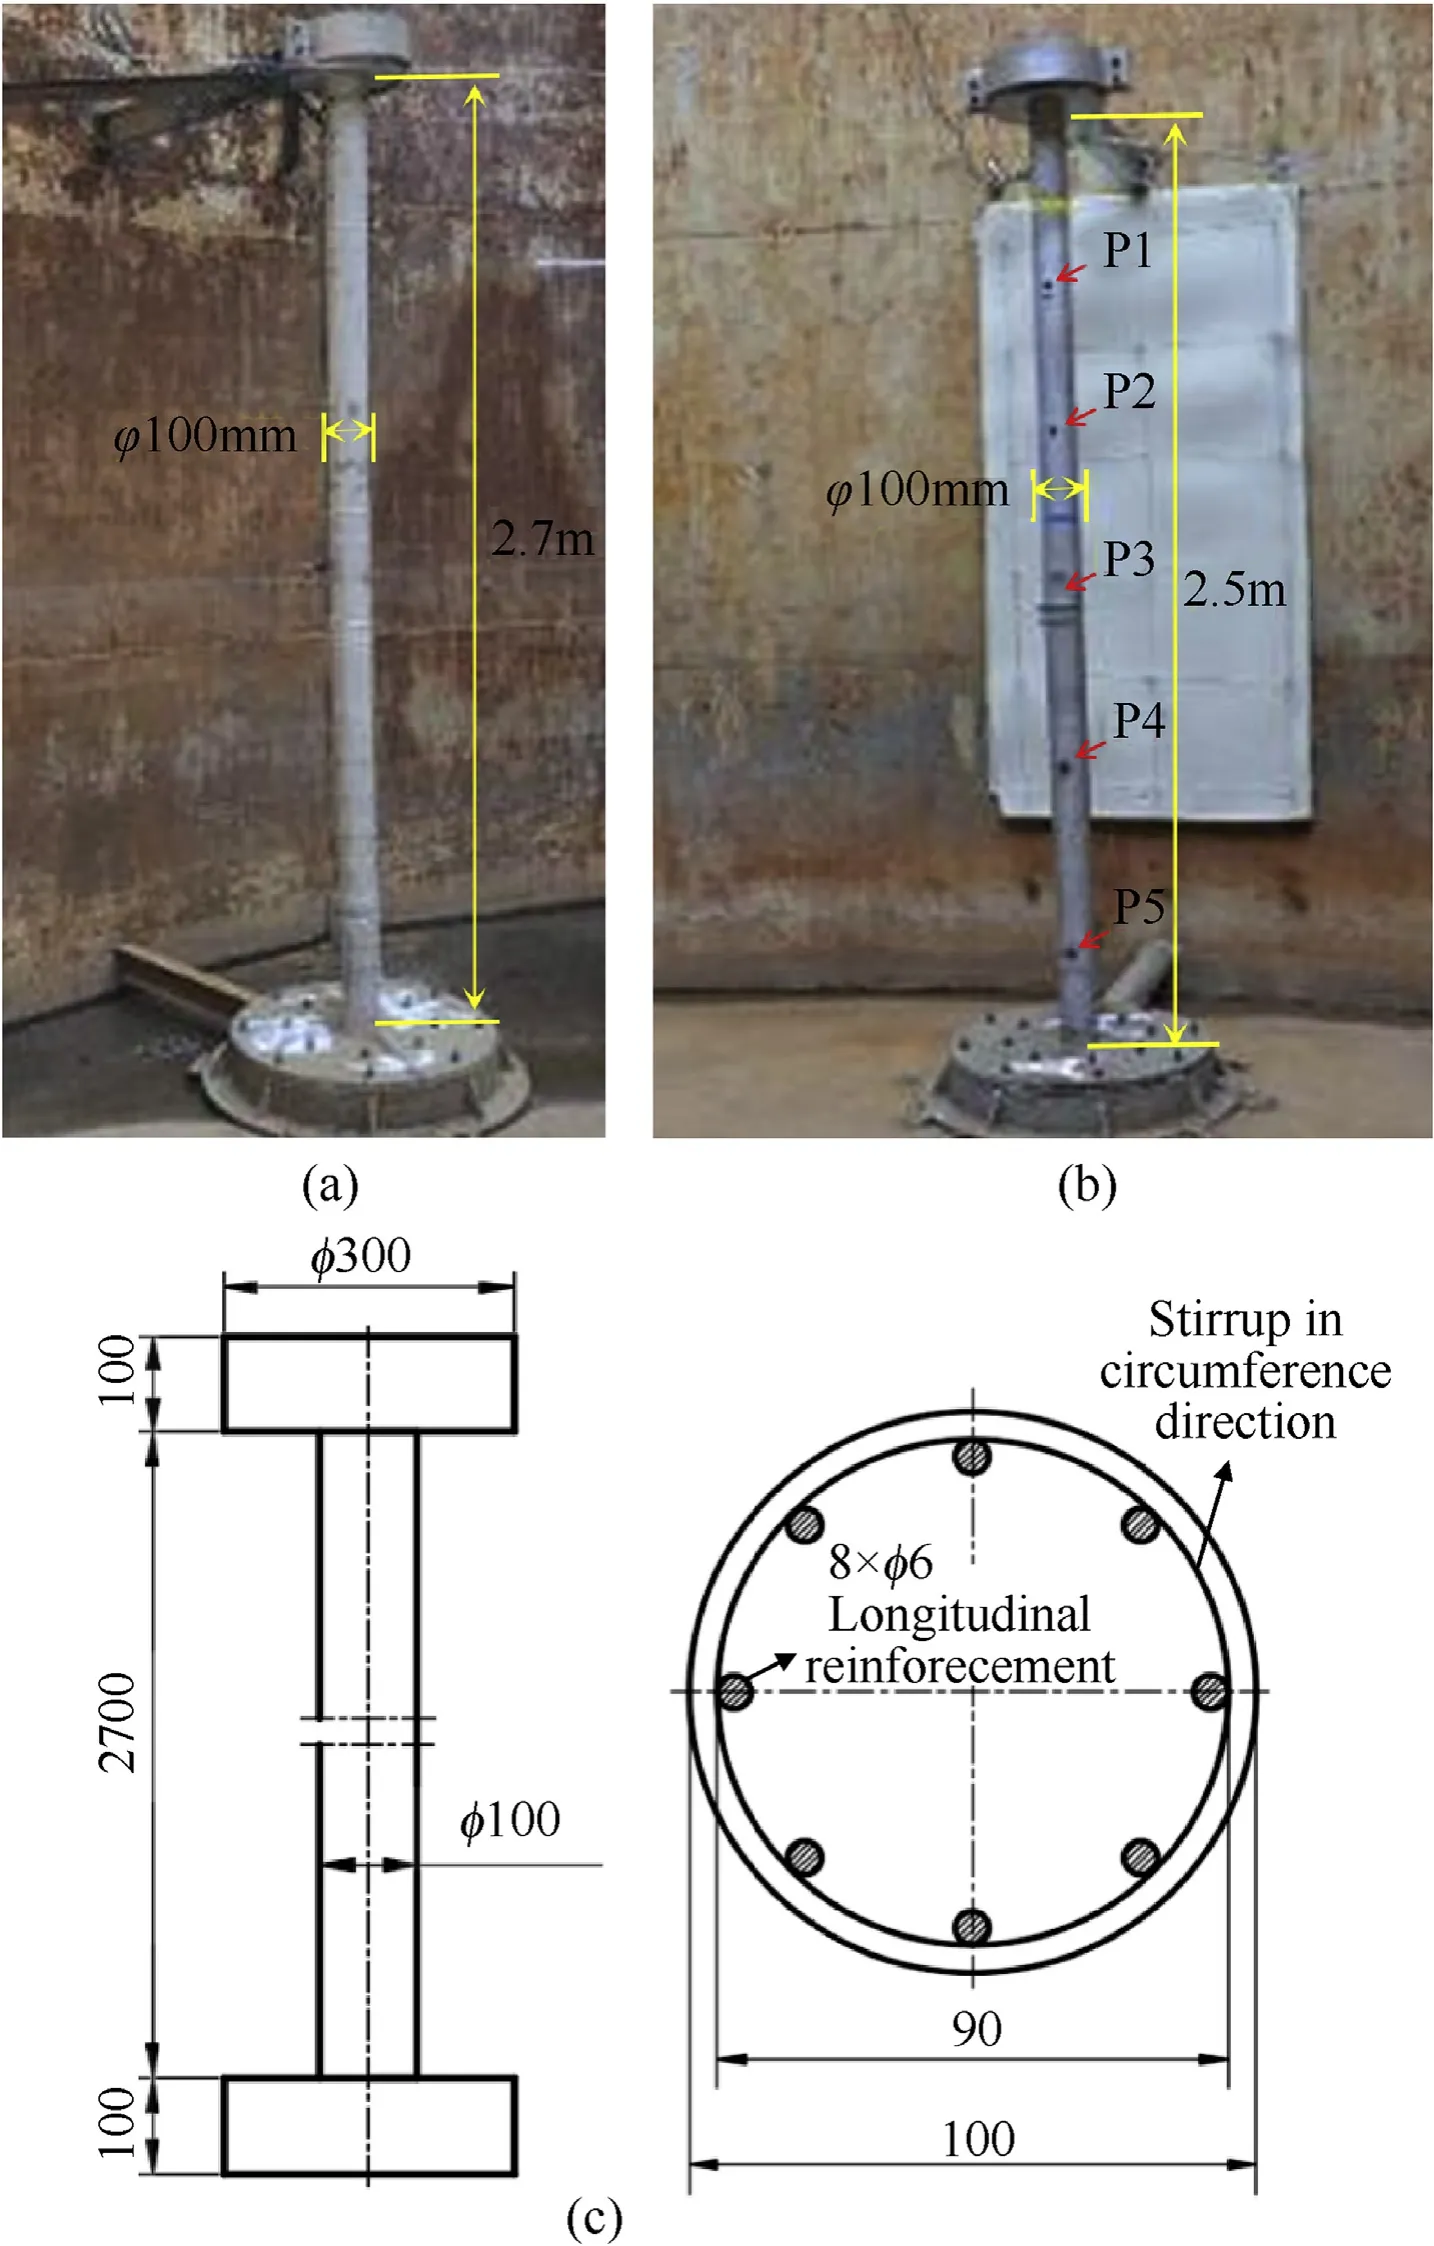
Fig. 3. (a) Circular RC column; (b) circular steel pile; (c) dimensions (unit: mm).
According to Cole’s model, the peak value of the shock wave in the free field can be calculated as:

where P0is the peak pressure of the shock wave in the underwater explosion in the free field.
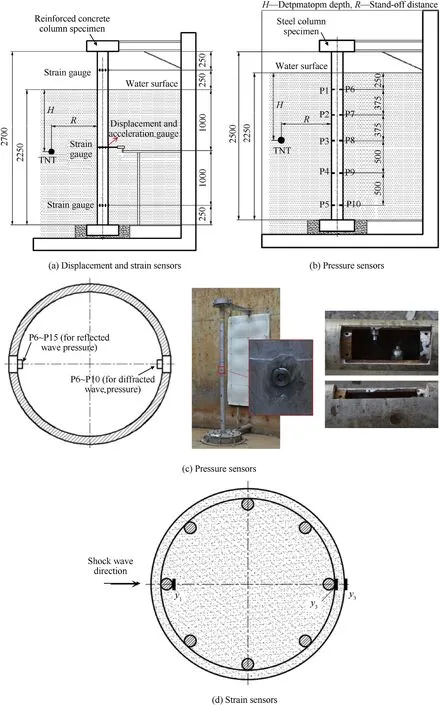
Fig. 4. Configuration of sensors.
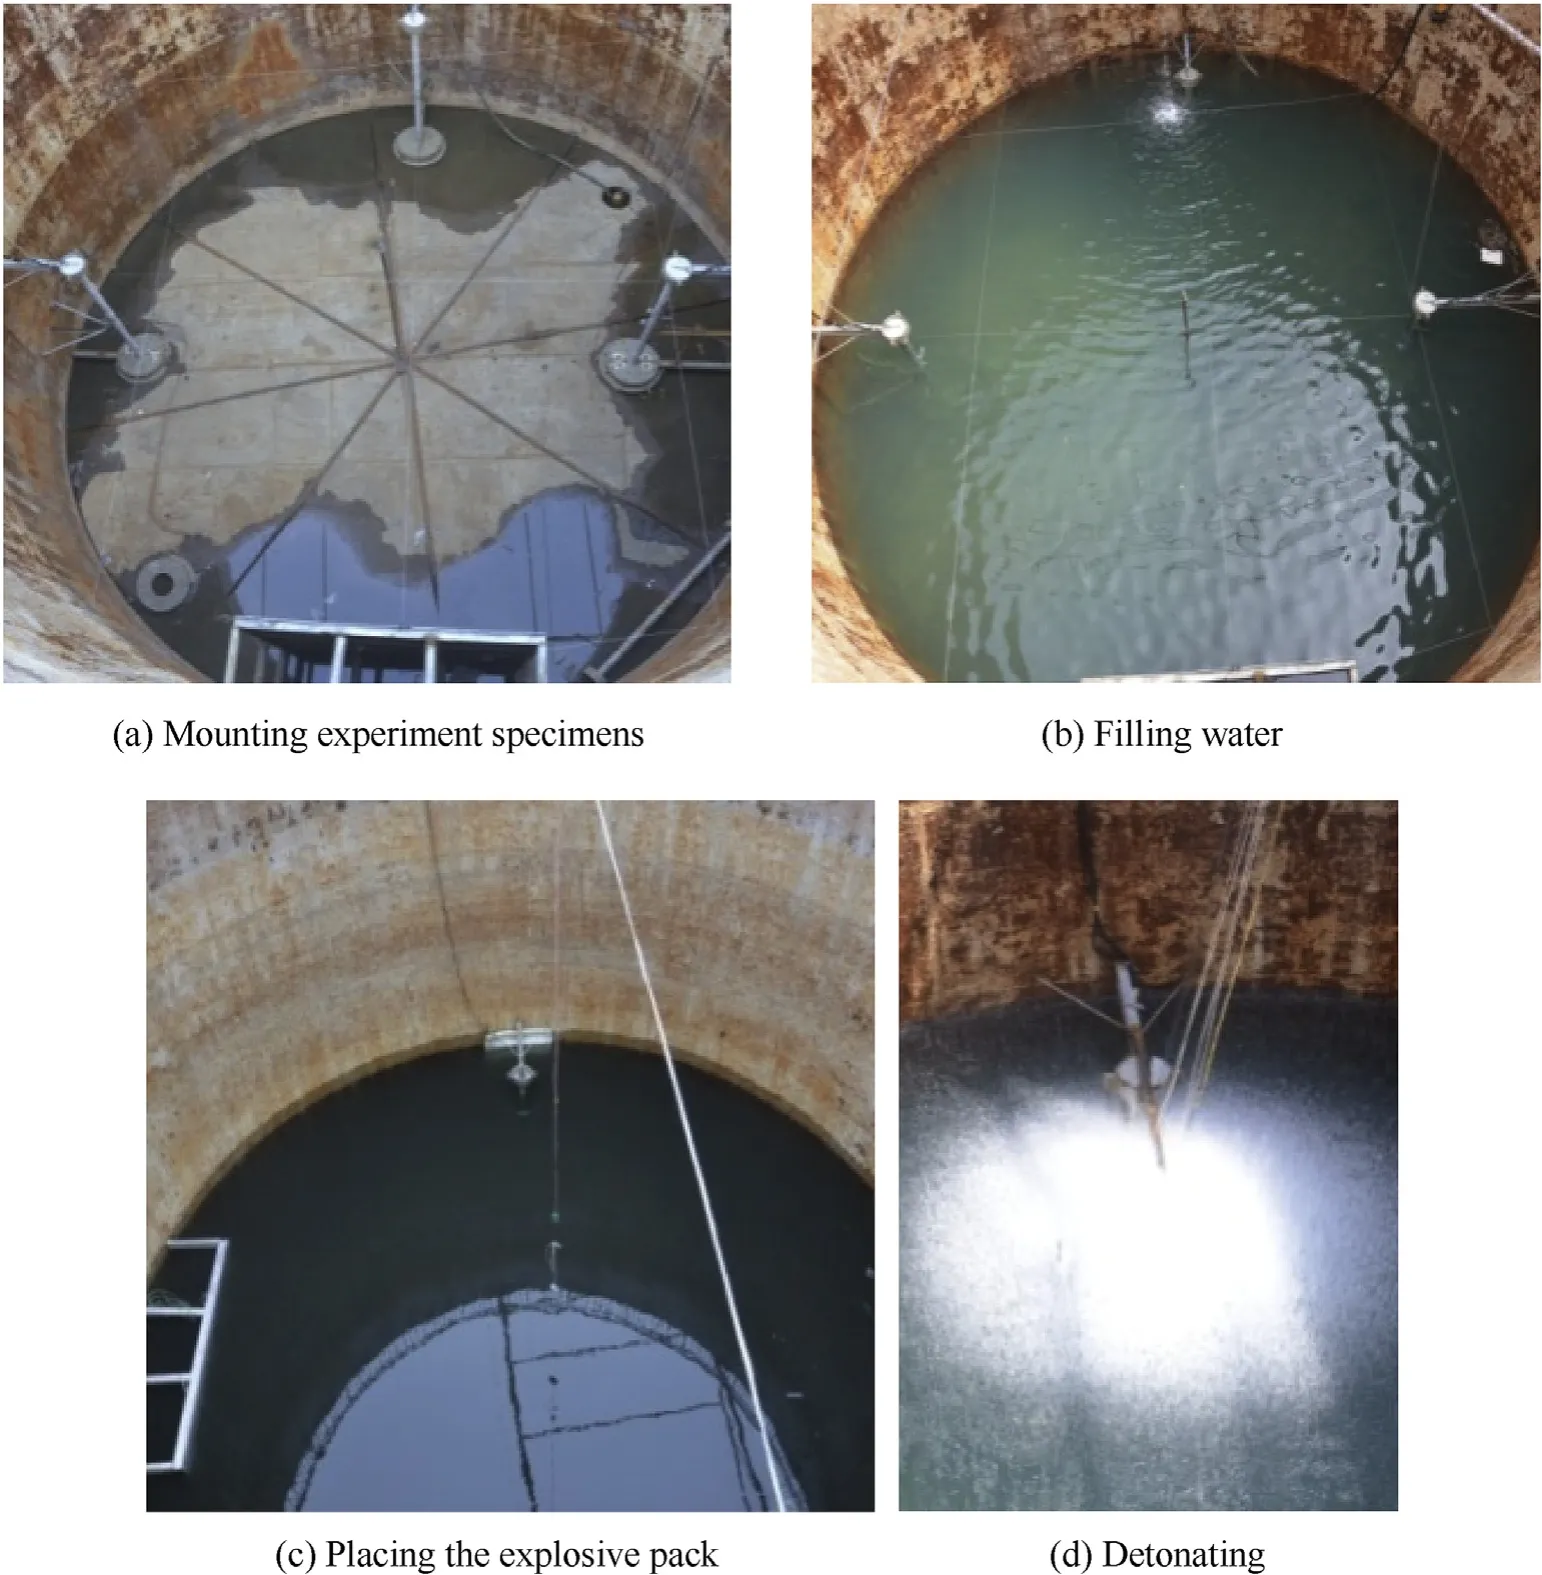
Fig. 5. Experiment procedure.
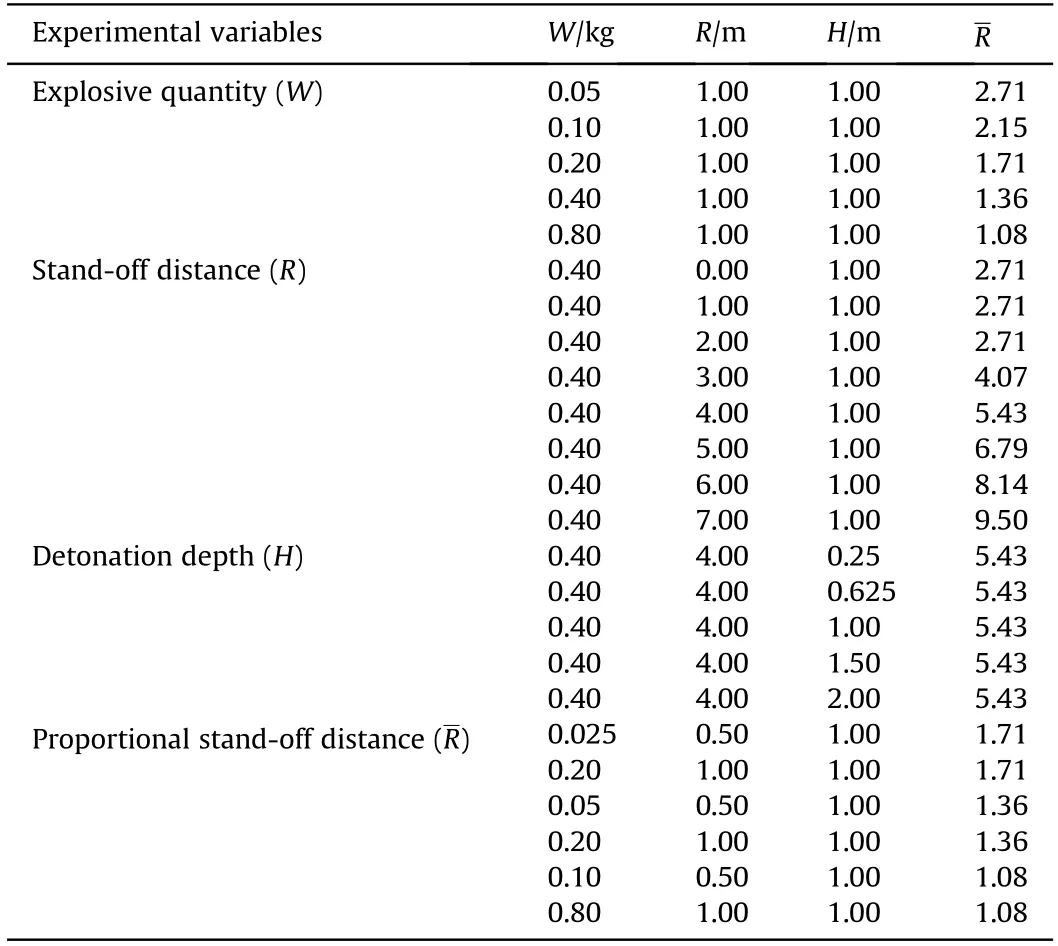
Table 1 Experimental conditions.
Table 2 lists the results of reflection, diffraction and free field pressure under different explosive quantities. As shown in Fig. 7,comparisons show that the peak pressure of the reflection and diffraction shock waves increase with the increase of the explosive quantity. Under the same condition, the peak pressure of the reflection shock wave is larger than that of the free field,while the peak pressure of diffraction shock wave is smaller than that of the free field.
The interaction between the shock wave and the circular column is illustrated in Fig.8.It shows that the shock wave propagates to the column surface forming a reflection shock wave.The residual shock wave propagates along the wall of the column forming a diffraction shock wave.Due to the influence of the column,the peak value of the diffraction shock wave is lower than the free field shock wave. Because the cross-section dimension of the column is small compared to the shock wave length, such that the time difference between the reflection shock wave and the diffraction shock wave can be neglected. Table 4 shows the peak pressure of the shock wave at the explosive quantity(W)0.4 kg,at the detonation depth 1.0 m, and at the stand-off distance (R) varying from 2.0 to 7.0 m,showing the non-linear relationship between the shock wave load and the stand-off distance. For the stand-off distance 7.0 m, the peak pressure is 7.98 MPa, while for R=1.0 m, and the peak pressure of the shock wave is 77.29 MPa.
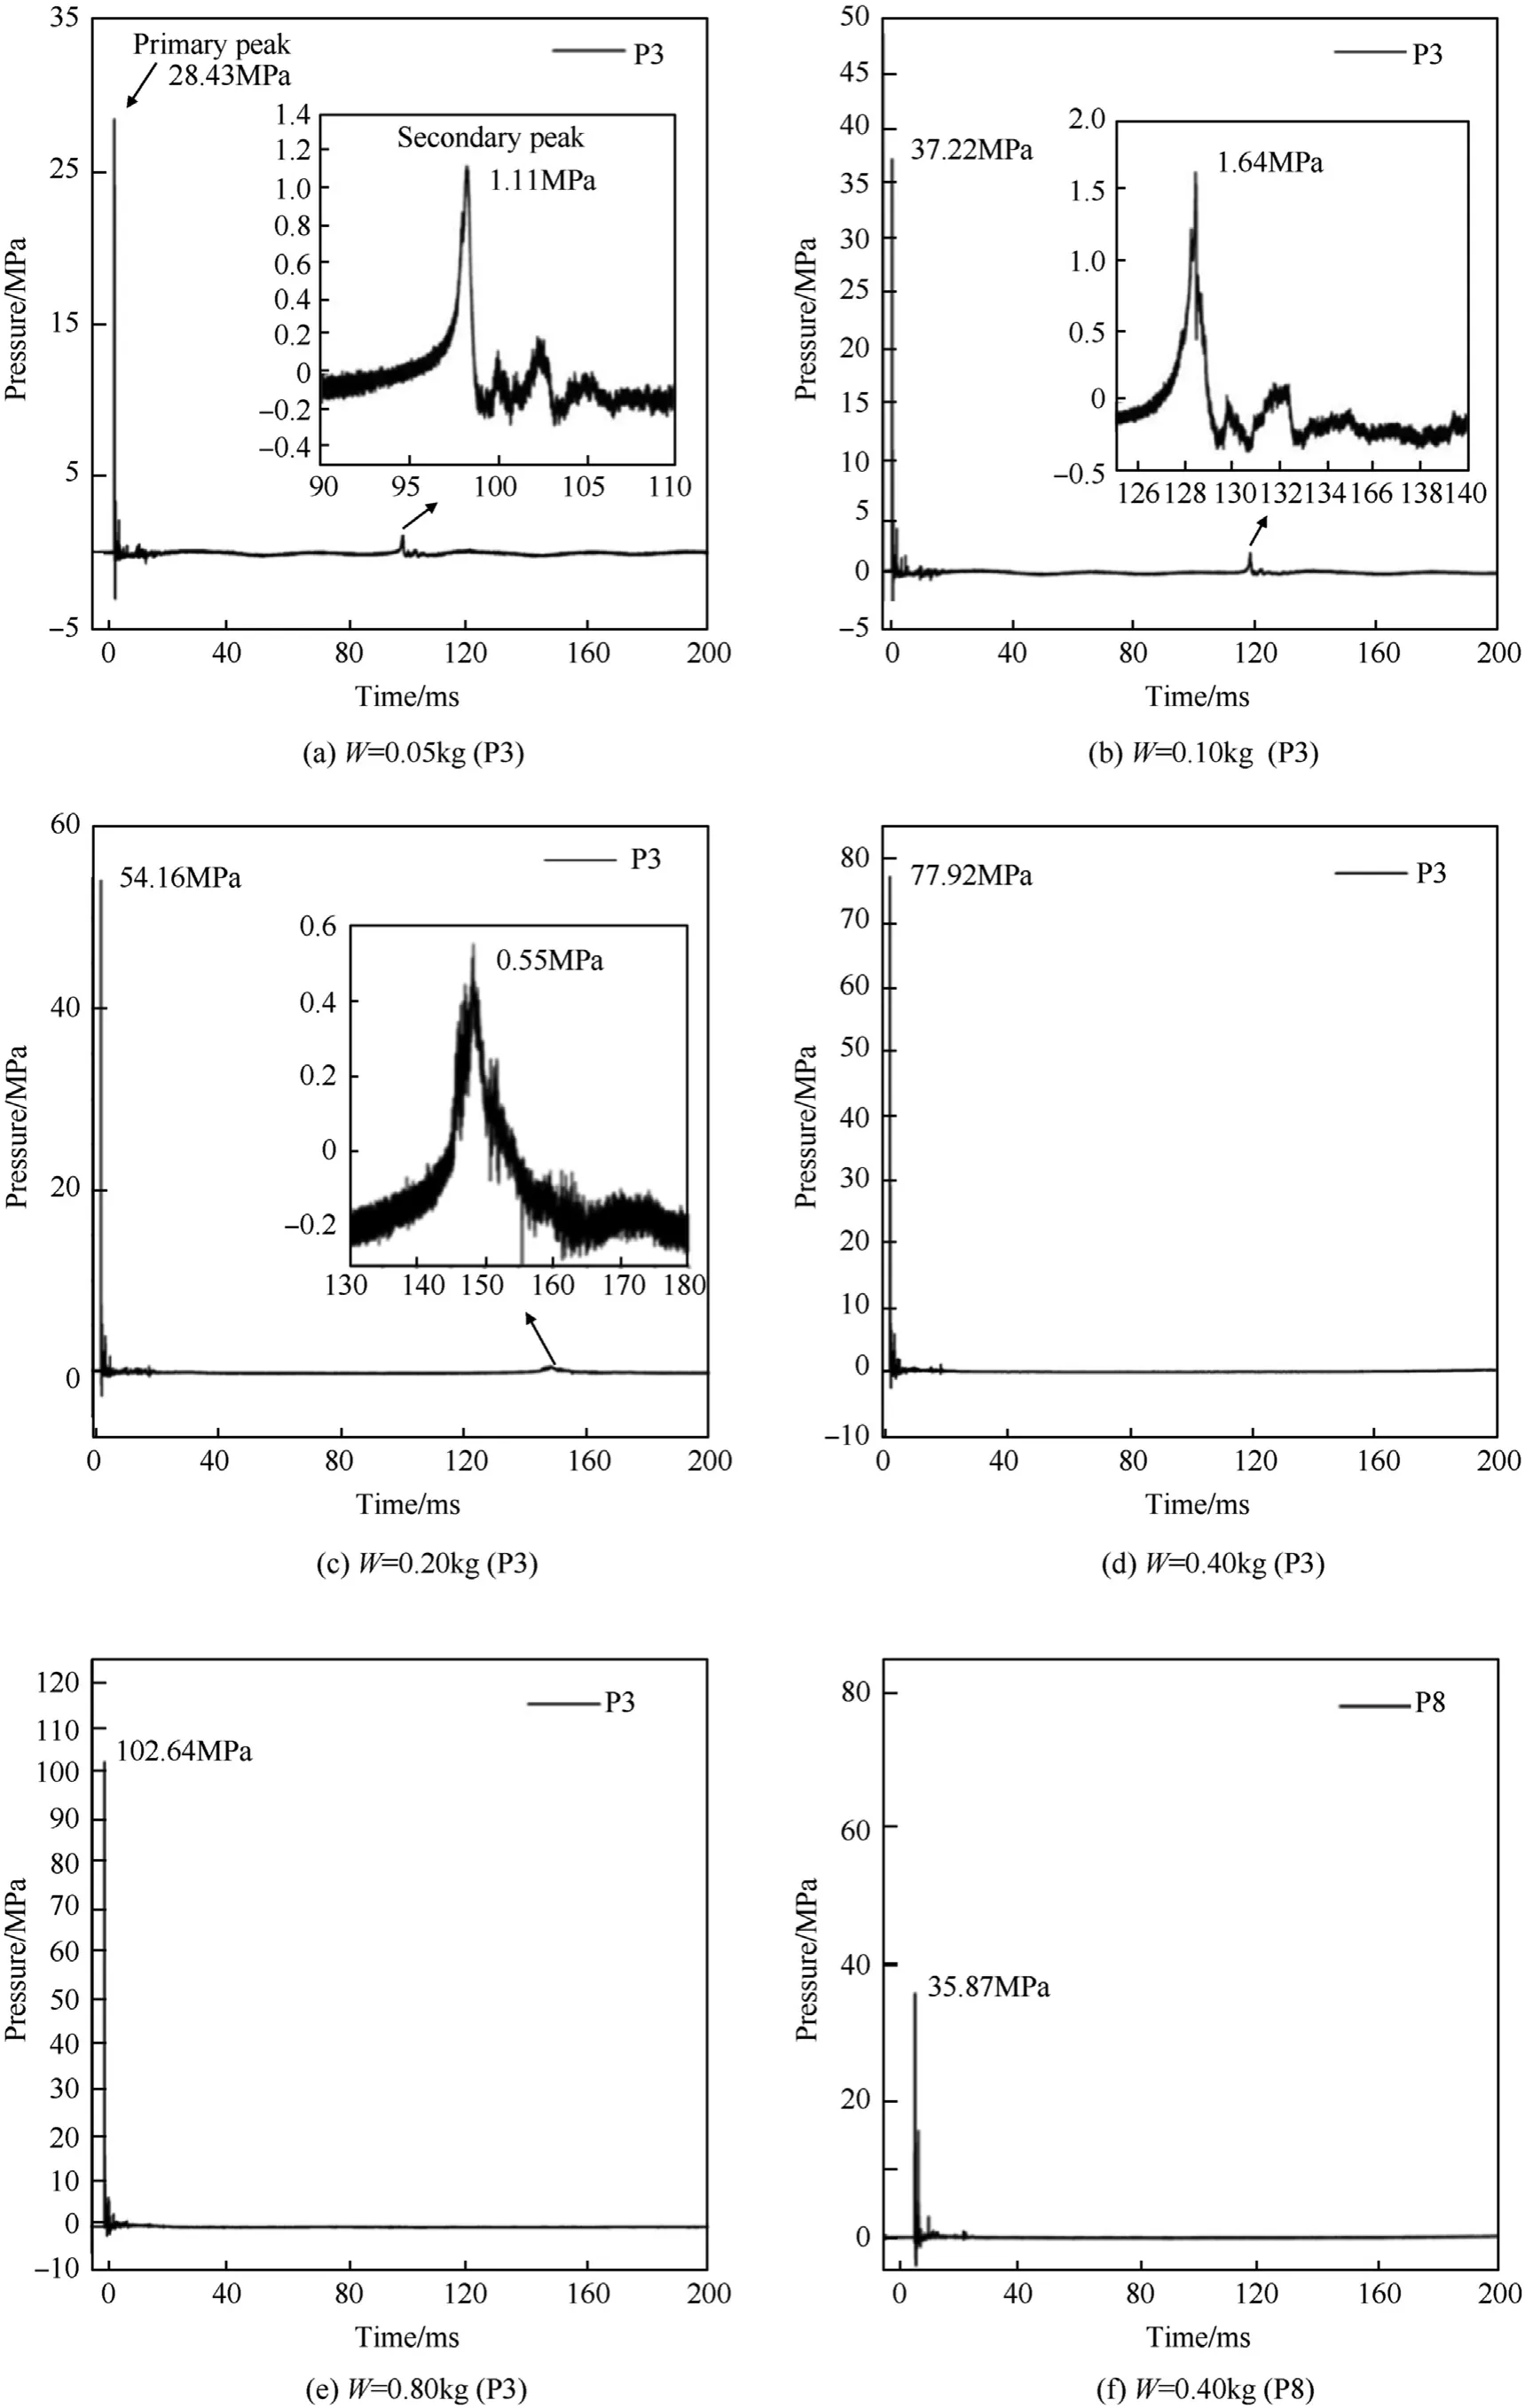
Fig. 6. Time history of surface pressure for different explosive quantities (L=1.0 m, H=1.0 m).

Table 2 Peak pressures of shock wave and bubble pulsation(P3 measuring point and P8 measuring point test reflection shock wave and diffraction shock wave pressure respectively.Analytical results of peak pressure of shock wave are also given for comparison).
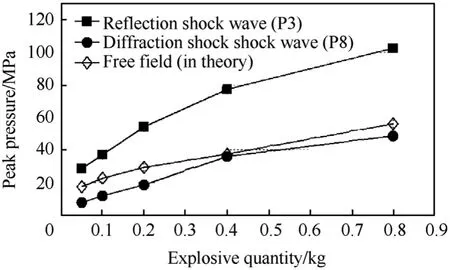
Fig. 7. Relationship between peak pressure of shock wave and explosive quantity.Showing the difference between reflection shock wave and diffraction shock wave.
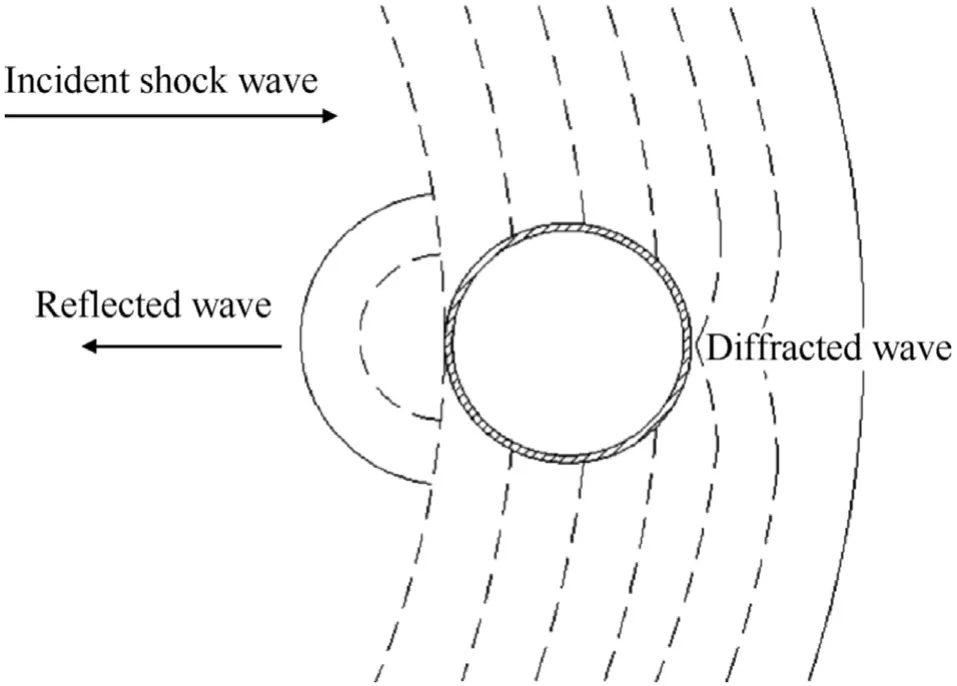
Fig. 8. Illustration of reflection and diffraction shock wave.
3.1.2. Spatial distribution of the shock wave load
Fig. 9 shows the distribution of peak pressure of shock waves along the vertical direction under different explosive quantities. It can be seen that the peak pressure is non-uniformly distributed on the surface of the column. The diffraction peak pressure is smaller than the reflection peak at the same water depth. It also indicates that the larger the explosive quantity, the more uneven the load distribution.That is because the arrival shock wave pressure of the reflection and diffraction shock waves depends on the stand-off distance and the reflection angle. The proportional stand-off distance decreases as the explosive quantity increases. If the measuring point is at same depth of the detonation point and the reflection angle is zero, the pressure load achieves the highest value. As the stand-off distance increases, the influence of the reflection angle on the load distribution gradually becomes small,then even distribution can be obtained.
The effect of the detonation depth (H) on the load distribution was investigated by varying H from 0.25 m to 2.0 m.The explosive quantity is set as 0.40 kg, and the stand-off distance is fixed at 4.0 m. Fig. 10 shows the load distributions on the surface of the column at different detonation depths.It can be seen that the load distribution does not change significantly with the detonation depth. The maximum load (which is observed at the midpoint of the column) are 13.28, 12.87, 12.48, 12.76 and 12.28 MPa, respectively. It indicates, under the present experimental conditions (i.e.W=0.40 kg, H is in the range of 0.25 m-2.00 m), the influence of free surface on the shock wave load can be neglected.
We selected the same proportional stand-off distance () but different explosive quantity and stand-off distance, and tried to
illustrate the influence ofon the applied load.As shown in Fig.11,under the same,the peak pressure of the reflection shock wave is approximately the same.However,for smaller explosive quantity or closer stand-off distance,the peak pressure of the diffraction shock wave is relatively smaller also.Fig.12 is the load distribution on the surface of the steel pipe at the proportional stand-off distance of 1.08(the corresponding experimental data is listed in Table 3,cases 5 and 6). It can be seen that, with the smaller explosive quantity(0.1 kg) and the closer stand-off distance, and the unevenness of load distribution becomes more obvious.
3.1.3. Secondary pulsation pressure caused by explosive bubble
For the underwater explosion process involved in this paper,attentions mainly focused on the damage effect of explosion on the RC column.The purpose of arranging the pressure sensor is to test the shock wave load acting directly on the surface of the structure.After the shock wave,the bubble formed by the detonation product expands and contracts to form a secondary pulsating pressure.This secondary pressure was observed by the pressure sensors in some particular conditions, as shown in Fig. 6(a)-(c).
The secondary pressure peak is much smaller than the primary pressure peak. As we have known, under the free field condition,the bubble pressure and the pulsation period increase with the increase of the explosive quantity. While for shallow water explosion like the present experiment, the bubble pressure may be significantly influenced by water surface as the increase of the explosive quantity. The bubble energy dissipates across the water surface during the expansion process, which highly decreases the secondary pulsation pressure. If the explosive quantity is small enough, the bubble was insignificantly influenced by the water surface because the energy of the explosive bubble is low.As shown in Fig.6(b)and(c),the secondary peak pressure is 1.64 MPa for W =0.1 kg, while a smaller value 0.55 MPa was observed for W =0.2 kg. The secondary peak pressure decreases as the explosive quantity increases.
The non-dimensional detonation depth () is defined as:
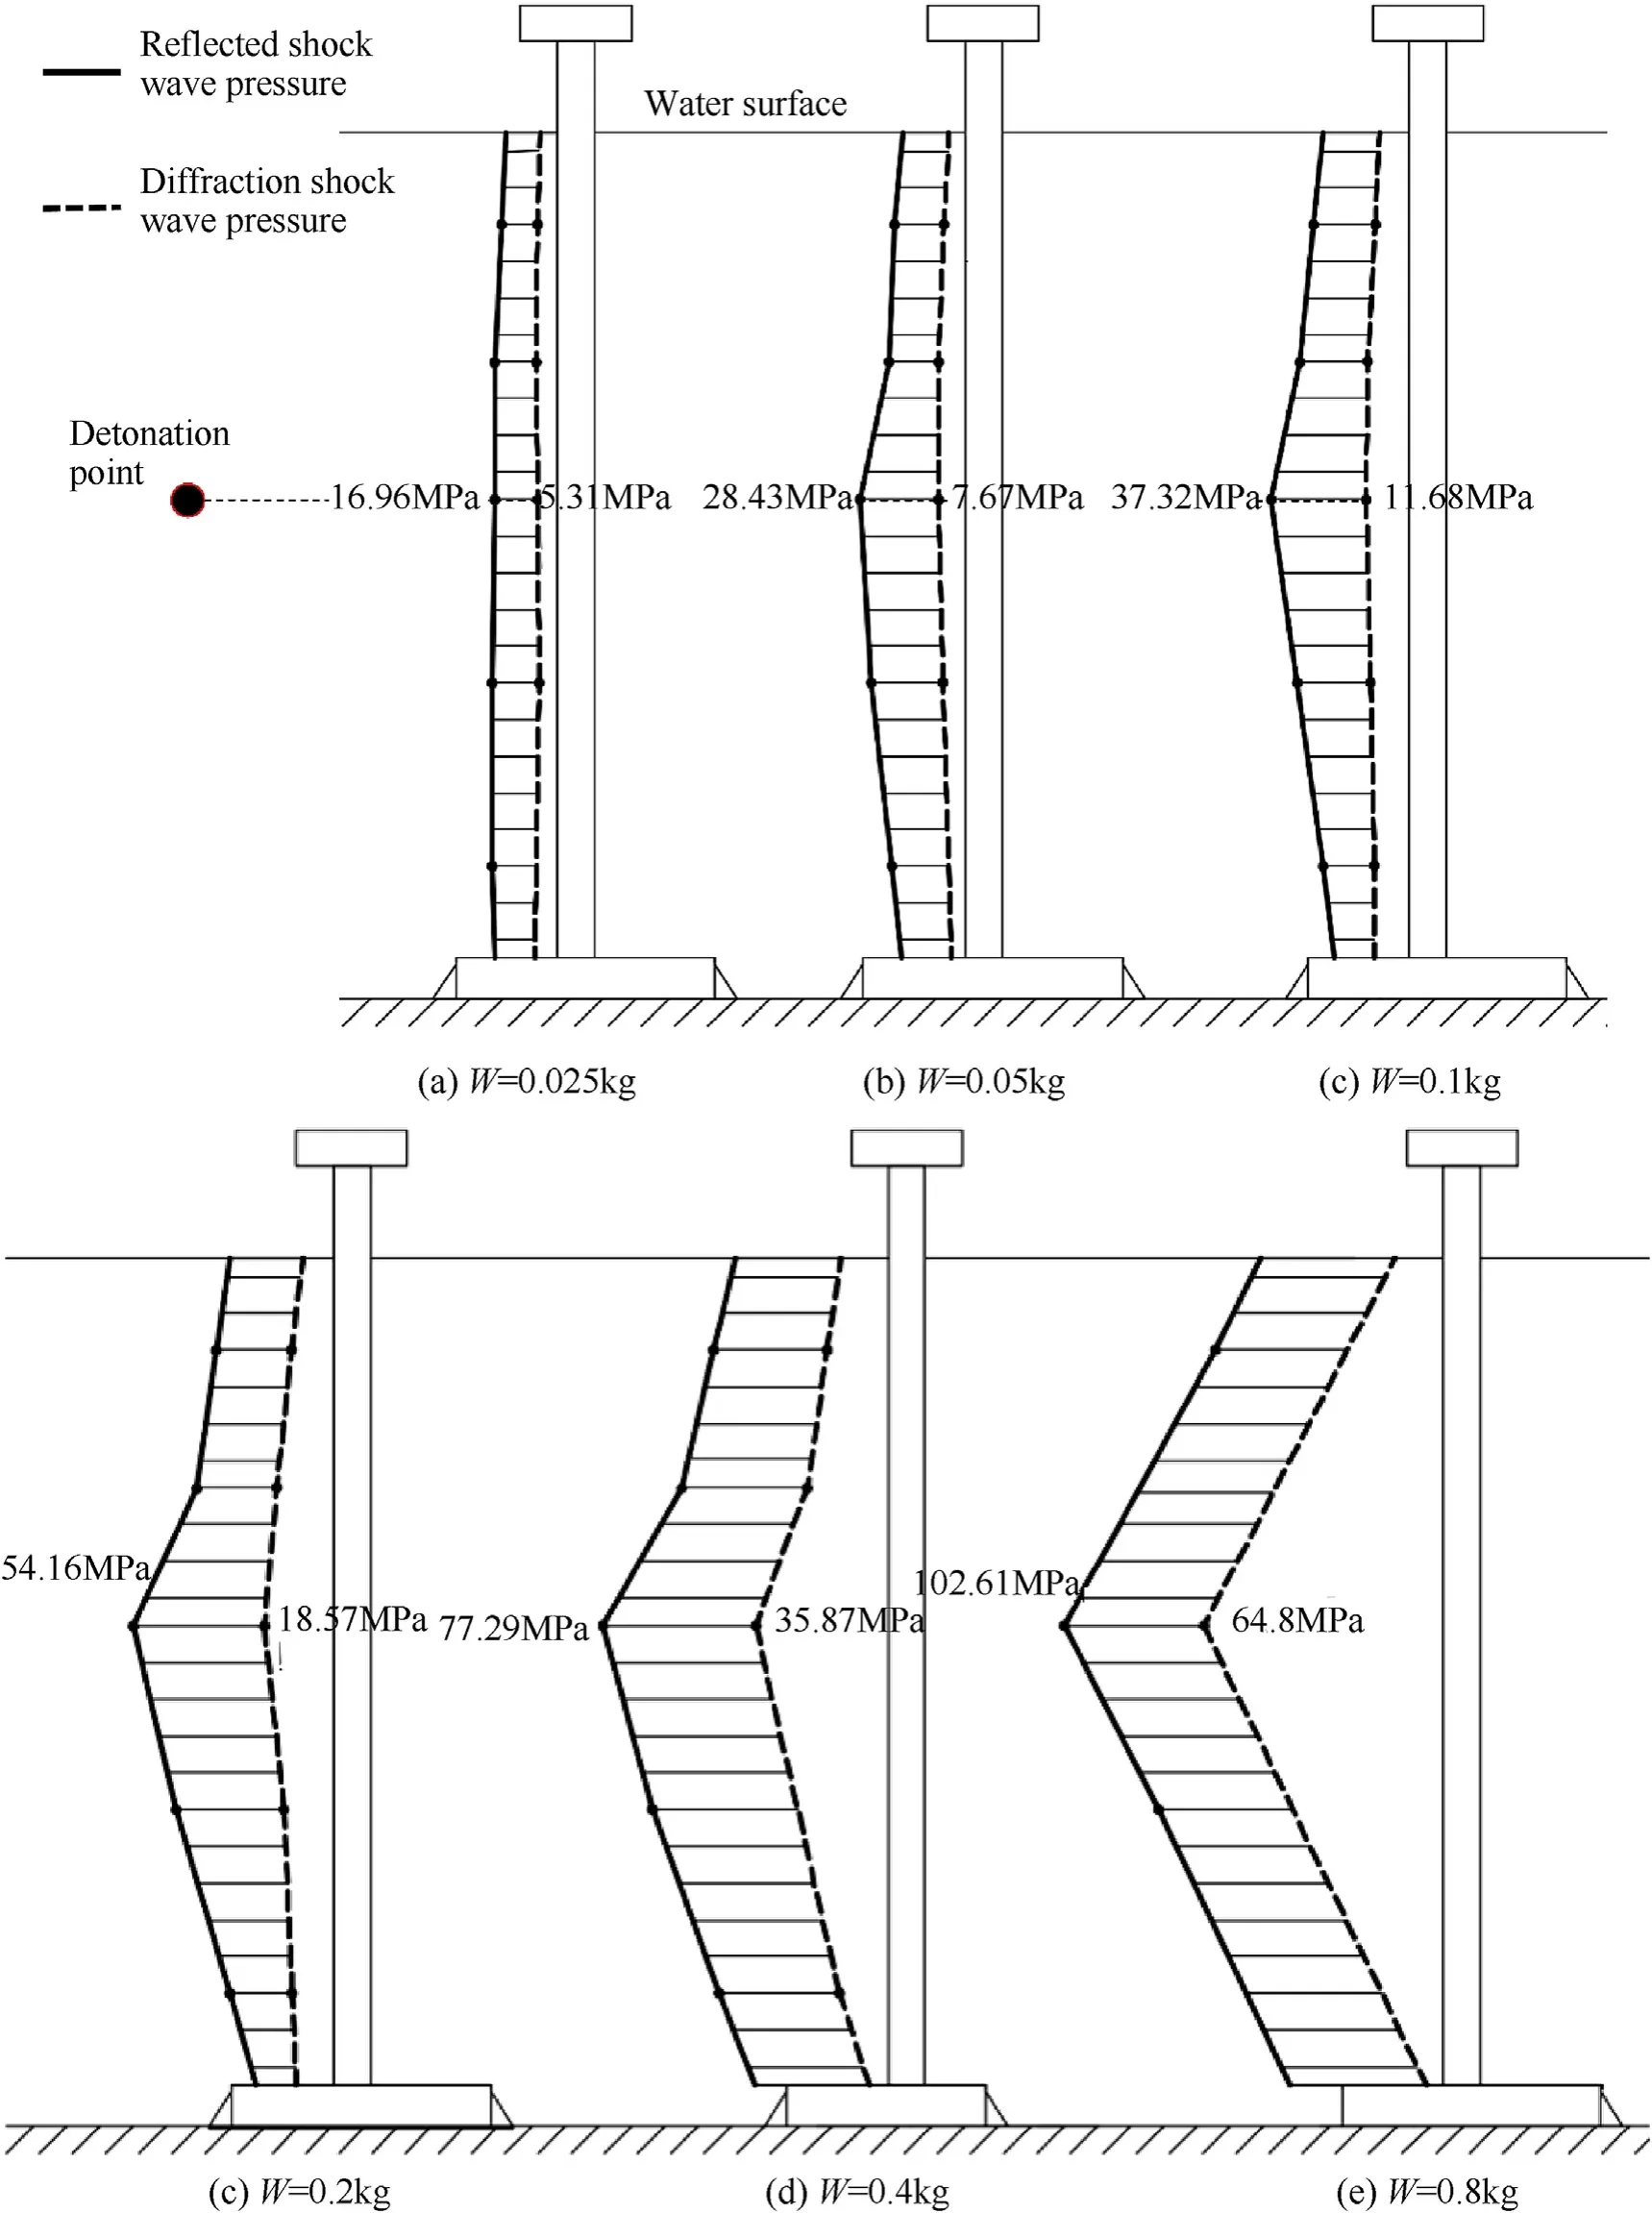
Fig. 9. Load distribution along the vertical direction. Effect of explosive quantity.

where H is the detonation depth,m;W is the quantity of explosive charges, kg. Small explosive quantity corresponds to low bubble energy, short pulsation period, low secondary pressure peak and short time interval between shock wave and bubble.The increase of the explosive quantity makes the non-dimensional detonation depth become smaller,and the explosion process will be influenced more by the water surface,which means that part of bubble energy dissipates by acrossing the water surface during the pulsating process,causing the decrease of the secondary peak pressure.In the case of the explosive quantity greater than a critical value, the bubble was directly sprayed out of the water surface during the expansion process, and the secondary peak pressure was not generated (see Fig. 6(d)-(f)).
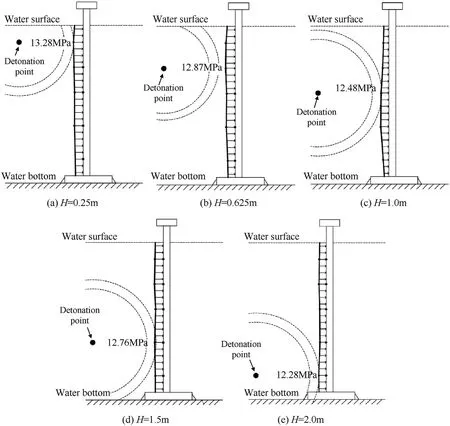
Fig.10. Load distribution along the vertical direction. Effect of detonation depth.
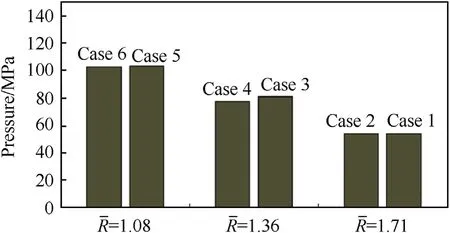
Fig.11. Effect ofon peak pressure of reflection shock wave (H=1.0 m, P3).
3.1.4. Experience model for predicting shock wave load
(1) Reflection shock wave
According to above experimental results, if the explosive quantity is less than 0.80 kg and the detonation depth is greater than 1.00 m, the effect of free surface can be neglected. When the proportional stand-off distances of two conditions are the same,the peak values of the reflection shock wave is also the same.Fig.13 shows the relationship between the reflection shock wave load and the proportional stand-off distance. In Fig. 13, the test data was fitted by the least square method. The following equation was obtained:

where Pris the peak value of the reflection shock wave pressure.The reflection coefficient Cris defined as:

where P0is the peak value of the shock wave pressure in the free field, and it can be calculated by Eq. (2). Then, Eq. (5) can be rewritten as:


Table 3 Effect of proportional stand-off distance on shock wave pressure.

Table 4 Effect of proportional stand-off distance on pressure characteristics.
It indicates that the reflection coefficient decreases with the increase of the proportional stand-off distance. When the proportional stand-off distance is greater than 1,the reflection coefficient is less than 2.13.
(2) Diffraction shock wave
Fig.14 shows the relationship between the peak pressure of the diffraction shock wave and the proportional stand-off distance.The test data is fitted by the least square method.It can be seen that the curve fits very well when the proportional stand-off distance is greater than 4.0. The deviation for≤4 is due to the influence of the cross-section size of the circular column.It indicates that if the stand-off distance is far enough,the influence of the pipe radius can be neglected. The following equation is obtained:
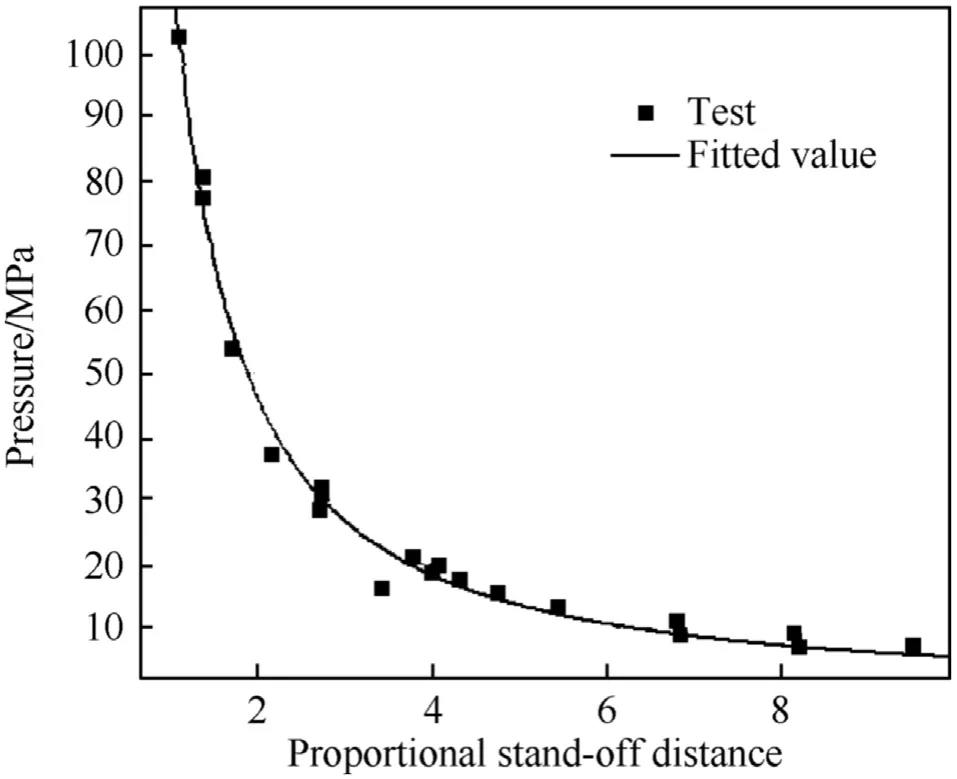
Fig.13. The relationship between reflection shock wave pressure and
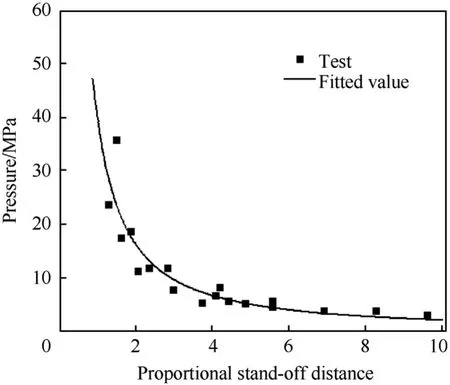
Fig.14. The relationship between diffraction shock wave load and

where Pdis the peak pressure of the diffraction shock wave pressure; L=R+2r, where r is the radius of the cross-section of the circular column.
Similarly, the diffraction coefficient Cdis defined as:

It indicates that the diffraction coefficient decreases with the increase of the proportional stand-off distance. When the proportional stand-off distance is greater than 1,the reflection coefficient is less than 0.76.
(3) Experience model
The shock wave load, including reflection shock wave and diffraction shock wave,acts on the surface of the column in a very short time, which can be considered as a simultaneous action.Hence, the actual peak load should be calculated as the difference between the reflection and the diffraction shock wave load. According to the above Eqs. (4) and (7), the net peak pressure of the shock wave is calculated by the following equation:

If the stand-off distance is much larger than the radius of the circular column(i.e.,L≈R),the net peak pressure of the shock wave is:

The shock wave load coefficient Ciis defined and calculated as:

Eq.(10)was validated by comparing with the experimental data,as shown in Table 4.If the proportional stand-off distance is greater than 1.71 and R ≥10r, the maximum relative error is 5.4%.
3.2. Damage models of circular RC columns
3.2.1. Effect of explosive quantity (W)
As the explosive quantity increases, the response of the RC column changed from linear to nonlinear,from elastic deformation to plastic deformation, until damage was caused.
In the experiment, the time history of the displacement, strain and acceleration of the midpoint of the component was measured.The non-dimensional displacement is defined as the ratio of the measured displacement to the diameter of the column:

where δ is the measured displacement, and D is the cross-section diameter of the column (D=100 mm).
Fig.15 shows the test results of the midpoint displacement of RC columns. The explosive quantity was varied from 0.025 kg to 0.80 kg, with a constant stand-off distance 1.0 m, and a constant detonation depth 1.0 m. For the explosive quantity 0.025 kg, the maximum displacement is 4.50 mm (=4.5%), and the final displacement returns to zero, indicating that the deformation is elastic. For the explosive quantity 0.80 kg, the maximum displacement is up to 52.92 mm (=52.92%). For W ≤0.05 kg (see Fig. 15(a) and (b)), the final displacement curve tends to zero,indicating that the column is only elastically deformed. While for other cases (i.e., W ≥0.1 kg), the residual displacement was observed, indicating that the column was plastically deformed.Fig.16 shows the relationship between displacement and explosive quantity. It can be seen from the figure that the relationship between displacement and explosive quantity is basically the same as that of the shock wave load shown in Fig. 6.
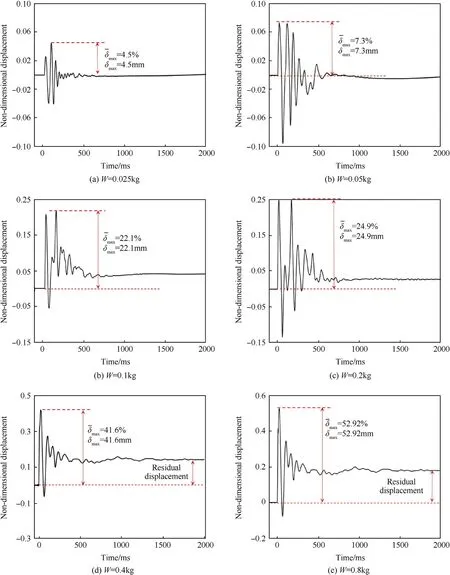
Fig.15. Time history of displacement for different explosive quantities.
Fig.17 shows the test results of the midpoint acceleration of the column for the explosive quantities of 0.05 kg (Fig. 17(a)) and 0.40 kg (Fig. 17(b)). For W=0.05 kg, there are two peaks in the curve,where the former is caused by the shock wave and the latter is caused by the bubble pulsation. For W=0.4 kg, only one peak was observed in the curve, which means that the effect of bubble pulsation was not measured.Compared with the pressure curve in Fig. 6(b), it indicates that the dynamic response of columns is related to the applied shock wave pressure.
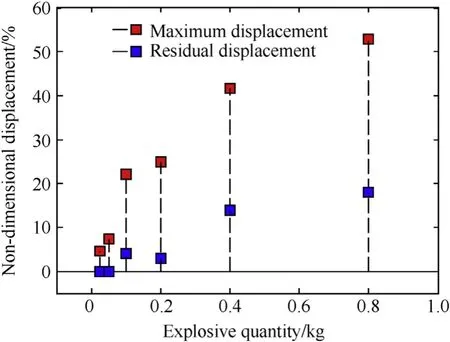
Fig.16. Relationship between displacement and explosive quantity.
As discussed in Sec. 3.1.1, for W ≤0.20 kg, the response of the column is determined by both the shock wave and the bubble pulsation. The shock wave has a higher pressure, a shorter action time, and a higher propagation speed, so that it first acts on the surface of the column to cause the column to vibrate and deform,and then the shock wave moves toward the back side of the column forming the diffraction shock wave. The bubble pulsation lags behind the shock wave,and acts on the surface of the column later.The peak pressure of bubble pulsation, which is defined as the secondary peak pressure,is low,but the action time lasts long.After the peak pressure of the bubble pulsation, the amplitude of the column gradually decreases and tends to the equilibrium state due to the damping effect of the column and the water.
For W=0.40 kg,there is only one peak in the pressure curve of Fig. 6(e), but there are two higher amplitudes in the displacement curve of Fig.15(e). The reason is that the explosive energy transferred into the water medium increases with the increase of explosive quantity.The high-speed impact of the water flow causes the column to undergo a secondary deformation.For the explosive quantity of 0.80 kg,the column plastically deforms under the action of strong shock wave. In this case, the shock wave becomes the main factor causing the deformation and damage,and the effect of the water flow impact can be neglected.
Fig. 18 shows the test results of the strain with the explosive quantity varying in the range of 0.025 kg-0.80 kg, at a constant stand-off distance 1.0 m and at a detonation depth 1.0 m.Measuring points y1 and y2 are for the steel strain and the point y3 is for the concrete strain. Comparing the test results of displacement in Fig.15,the time history of the strain and displacement curves under the same condition is basically coincident.The sign of y1 is opposite to the sign of displacement,and the signs of y2 and y3 are the same as the displacement, indicating that bending deformation occurs during the underwater explosion.
For W=0.05 kg, the maximum strain at y3 is 545με, and no residual strain is observed, indicating that the column is in elastic deformation.For W=0.10 kg,the maximum strain at y3 is 1800με,and the residual strain was observed by sensors of y2 and y3; the maximum strain at y1 is 485με, and no residual strain was observed,meaning that local plastic deformation occurs inside the column body.For W=0.80 kg,the maximum strain at y2 is 6700με,and the residual strain is 4000με, indicating that the column was severely damaged. The above results show that under the experiment conditions of stand-off distance of 1.00 m and detonation depth of 1.00 m,the explosive quantity of 0.10 kg is the critical value for plastic deformation of the experimental column.
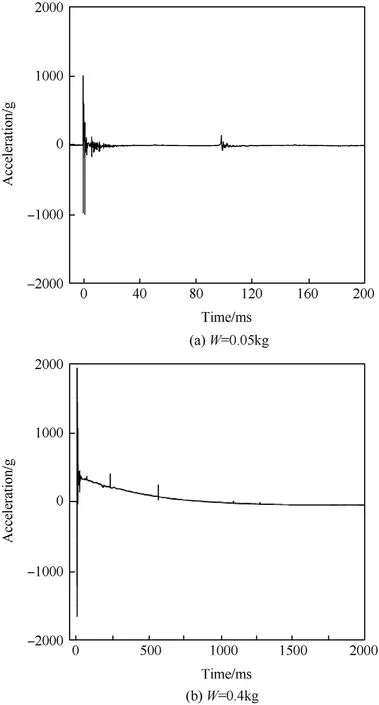
Fig.17. Time history of acceleration for different explosive quantities.
Fig. 19 shows the overall deformation of the RC column for different explosive quantities. For W=0.20 kg, the column is slightly deformed. In this case, the maximum residual displacement is 2.0 mm, and no obvious damage was observed. For W=0.40 kg, the bending deformation is enhanced, and the maximum residual displacement is 13.56 m. Transverse tensile failure cracks were observed on the back surface,but the crack did not propagate into the upwind surface.For W=1.60 kg,the column body was obviously bent and deformed,and the maximum residual displacement at the midpoint is 37.72 mm. In this case, there are multiple circumferential cracks near the midpoint of the column,and shear failure cracks were observed close to the column foot.
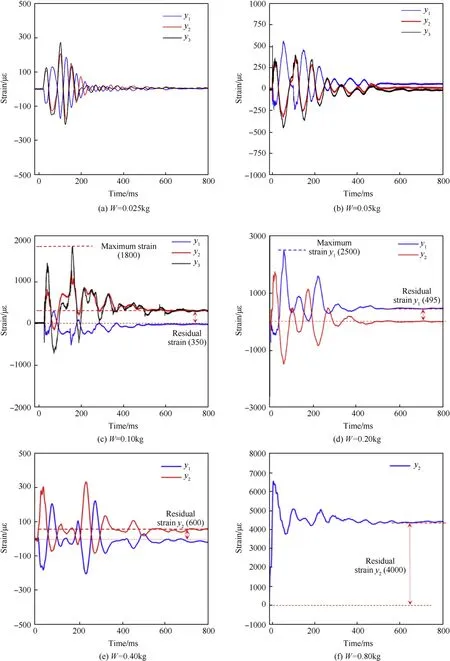
Fig.18. Time history of strain for different explosive quantities. (R=1.0 m, H=1.0 m).
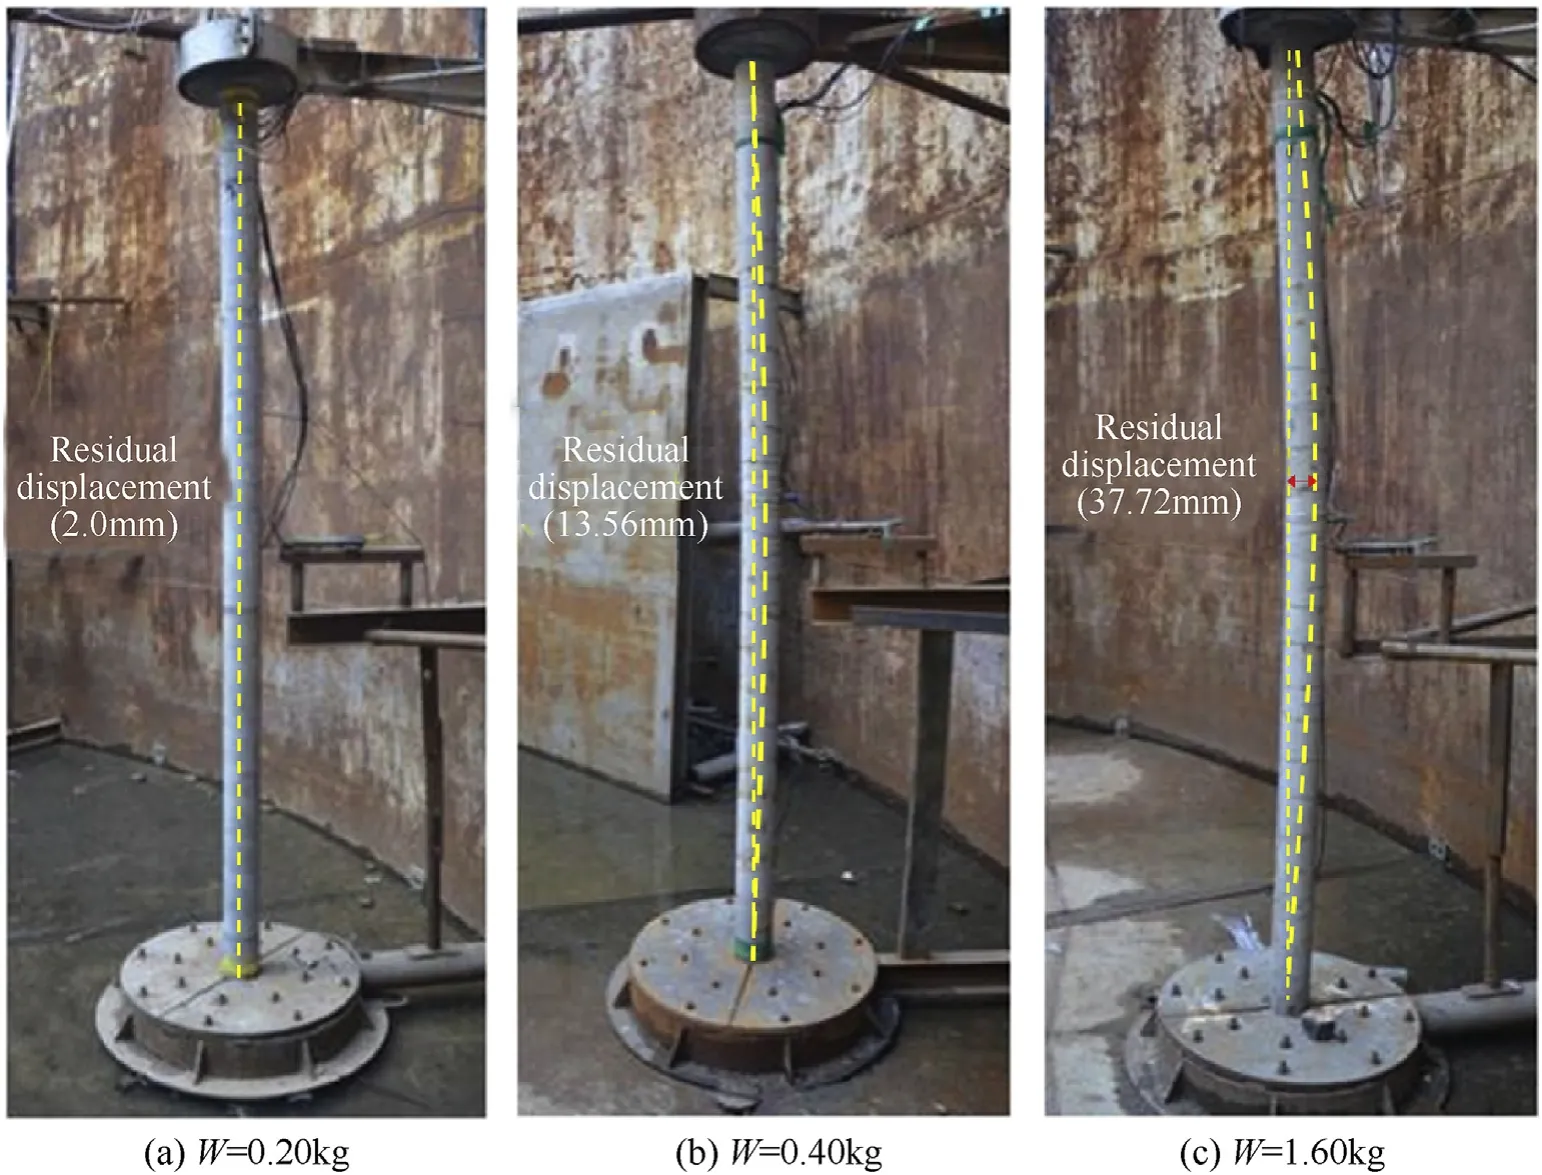
Fig.19. Deformation of experiment models (RC columns) under different explosive quantities (R=1.0 m, H=1.0 m).
In summary, under the condition of W ≤1.60 kg, R=1.0 m(≥0.855), and H=1.0 m (≥0.855), RC columns are mainly subjected to overall bending failure and bending-shear failure,and no local damage was directly caused by the shock wave. In particular, for the explosive quantity greater than 0.80 kg, the peak pressure of the shock wave is much larger than the compressive strength of the concrete, but no compression damage occurs. The reason is that the shock wave propagates fast in water, and the cross-section size of the column is relatively small, thus the time difference between effective reflected shock wave and diffracted shock wave can be neglected.In other words,both of them almost act on the surface of the column at the same time,and the column is in a multi-directional confining pressure state,which improves the material damage threshold.
3.2.2. Effect of stand-off distance (R)
Fig.20 shows the test results of the strain of RC columns at the stand-off distance varying from 0.5 m to 3.0 m, and at a constant explosive quantity 0.40 kg,and a constant detonation depth 1.0 m.For R=3.0 m,the maximum strain of y3 was 270 με and no residual strain was observed. For R=2.0 m, the maximum strain at y3 was 1340με, and there was no residual strain. It indicates that the column is elastically deformed for R≥2.0m (≥2.71). For R=0.5 m,the maximum strain at y2 was 3200 με,and the residual strain was 500 με, which indicates plastic deformation inside the column.
Fig.21 shows the overall and local deformation of RC columns at the stand-off distance varying from 0.75 m(non-contact explosion)to 0.0 m (contact explosion), at a constant explosive quantity 0.40 kg, and a constant detonation depth 1.0 m. For the stand-off distance 0.75 m, the column is slightly bent and deformed, and the maximum residual displacement was 8.56 mm. Several circumferential tensile cracks were observed at the back side of the column. For the stand-off distance 0.50 m, the maximum residual displacement of the column is 18.43 mm. Multiple circumferential tensile cracks were observed at the body surface, and the sheardamage-induced crack occurs at the joint near the column foot.For the stand-off distance 0.25 m, the maximum displacement of the column body was 71.80 mm, and the column body was obviously bent(see Fig.21(c)).In this case,the concrete material on the upwind surface close to the midpoint was crushed due to the action of shock wave. For the stand-off distance 0.125 m, as shown in Fig.21(c),the column body was severely damaged at the midpoint,and the 20.00 cm protective layer was completely detached. The longitudinal ribs inside the column were exposed and bent,and the concrete inside the longitudinal ribs was completely damaged.The column body far from the midpoint was not influenced, while the joint at the column foot was damaged in the form of bending.Let us focusing the contact explosion (i.e., the stand-off distance is 0.00 m).In this case,the column body with the length of 80.00 cm was completely damaged, and the bending damage at the column foot was induced.
It can be concluded from the above results that the damage degree of the column increases as the stand-off distance decreases and the failure mode is also changed. For R ≥2.0 m (≥2.71 ),elastic bending deformation was identified. For R ≥0.75 m(≥1.02)and R ≤1.0 m(≤1.36),the damage model was plastic bending deformation. For R ≥0.25 m (≥0.34) and R≤0.5 m(≤0.68),coupled shear failure and bending failure are observed,and the shear failure is more likely to occur at the column foot rather than the upper end. For the stand-off distance less than 0.125 m (≤0.17), the column body was severely damaged, and the punching failure is the main failure form.
3.2.3. Effect of detonation depth (H)
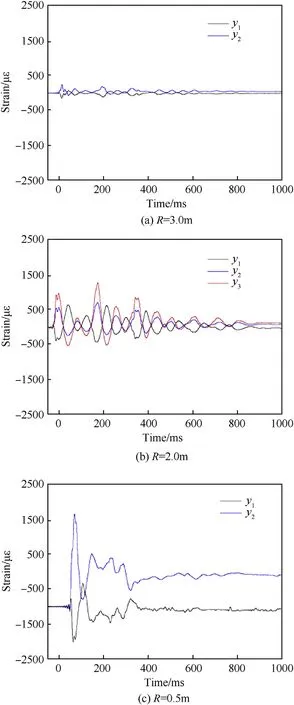
Fig. 20. Time history of strain for different stand-off distances.
The effect of the detonation depth (H) was investigated by varying H from 0.25 m to 2.0 m. The explosive quantity was set as 0.40 kg,and the stand-off distance was fixed at 0.5 m.Fig.22 shows the test results of the displacement of the RC column. For the detonation depth 1.00 m,the maximum displacement was 51 mm.For the detonation depth 0.25 m, the maximum displacement was 26.3 mm. For the detonation depth 2.0 m, the maximum displacement was 21.4 mm.It indicates that the closer the detonation point is to the midpoint of the column in the vertical direction,the larger the maximum displacement. For the detonation depth 0.25 m, the vibration of the column stops after three periods.As the detonation depth increases, the vibration degree also increases. For the detonation depth 2.00 m,the vibration lasted for 900 ms.The reason is that the vibration of the component is greatly affected by the water surface.The greater the detonation depth,the higher the explosive energy transferred into the water medium,then the wave motion of the water flow is enhanced. The deformation of the column is repeatedly created under the action of the surge, resulting in multiple vibration peaks.
Fig. 23 shows the residual displacement curves at different detonation depths. It can be seen that, the most severe bending deformation is observed for the detonation depth of 1.00 m,where the maximum residual displacement is 18.43 mm.
Fig. 24 shows the damage characteristic of the column at the detonation depth of 0.25 m and 2.00 m.For the detonation depth of 0.25 m, slight cracks are observed in the half of the column body close to the upper end. For the detonation depth of 2.00 m, shear failure cracks are observed at the midpoint and upwind surface of the column.
It can be concluded that the damage characteristics of the column is also significantly influenced by the detonation depth. The closer the detonation depth is to the midpoint of the column, the greater the degree of bending damage, while the closer the detonation depth is to the end of the column,the greater the degree of shear damage. The closer the detonation depth to the ends of the column, and the greater the degree of shear damage. This damage mechanism reason is related to the load distribution of the surface of the column. With the constant distance, the closer the detonation position to the midpoint of the column,the larger the bending moment resulted by the explosion,while the shearing force at both ends is relatively small, resulting in severe bending deformation.The farther the detonation position is from the midpoint of the column,the smaller the bending moment of the column is,but the shearing force at both ends of the column body increases,especially the detonation position is close to the bottom of the water and is affected by the bottom reflection, which makes the connection between the column body and the column foot more likely to encounter shear damage.
4. Summary
The dynamic response of circular RC columns subjected to underwater explosions was investigated. Both the load distribution characteristics and the damage models were studied by using two scaled-down experiment models (RC columns and steel pipe). The surface pressure, strain, displacement, and acceleration were measured. Some conclusions were reached:
Explosive shock wave: The shock wave pressure acts on the surface of the circular column leading to reflection and diffraction.The peak pressure of the reflection shock wave is higher than that of the diffraction shock wave. The actual load is calculated by considering these two shock waves.
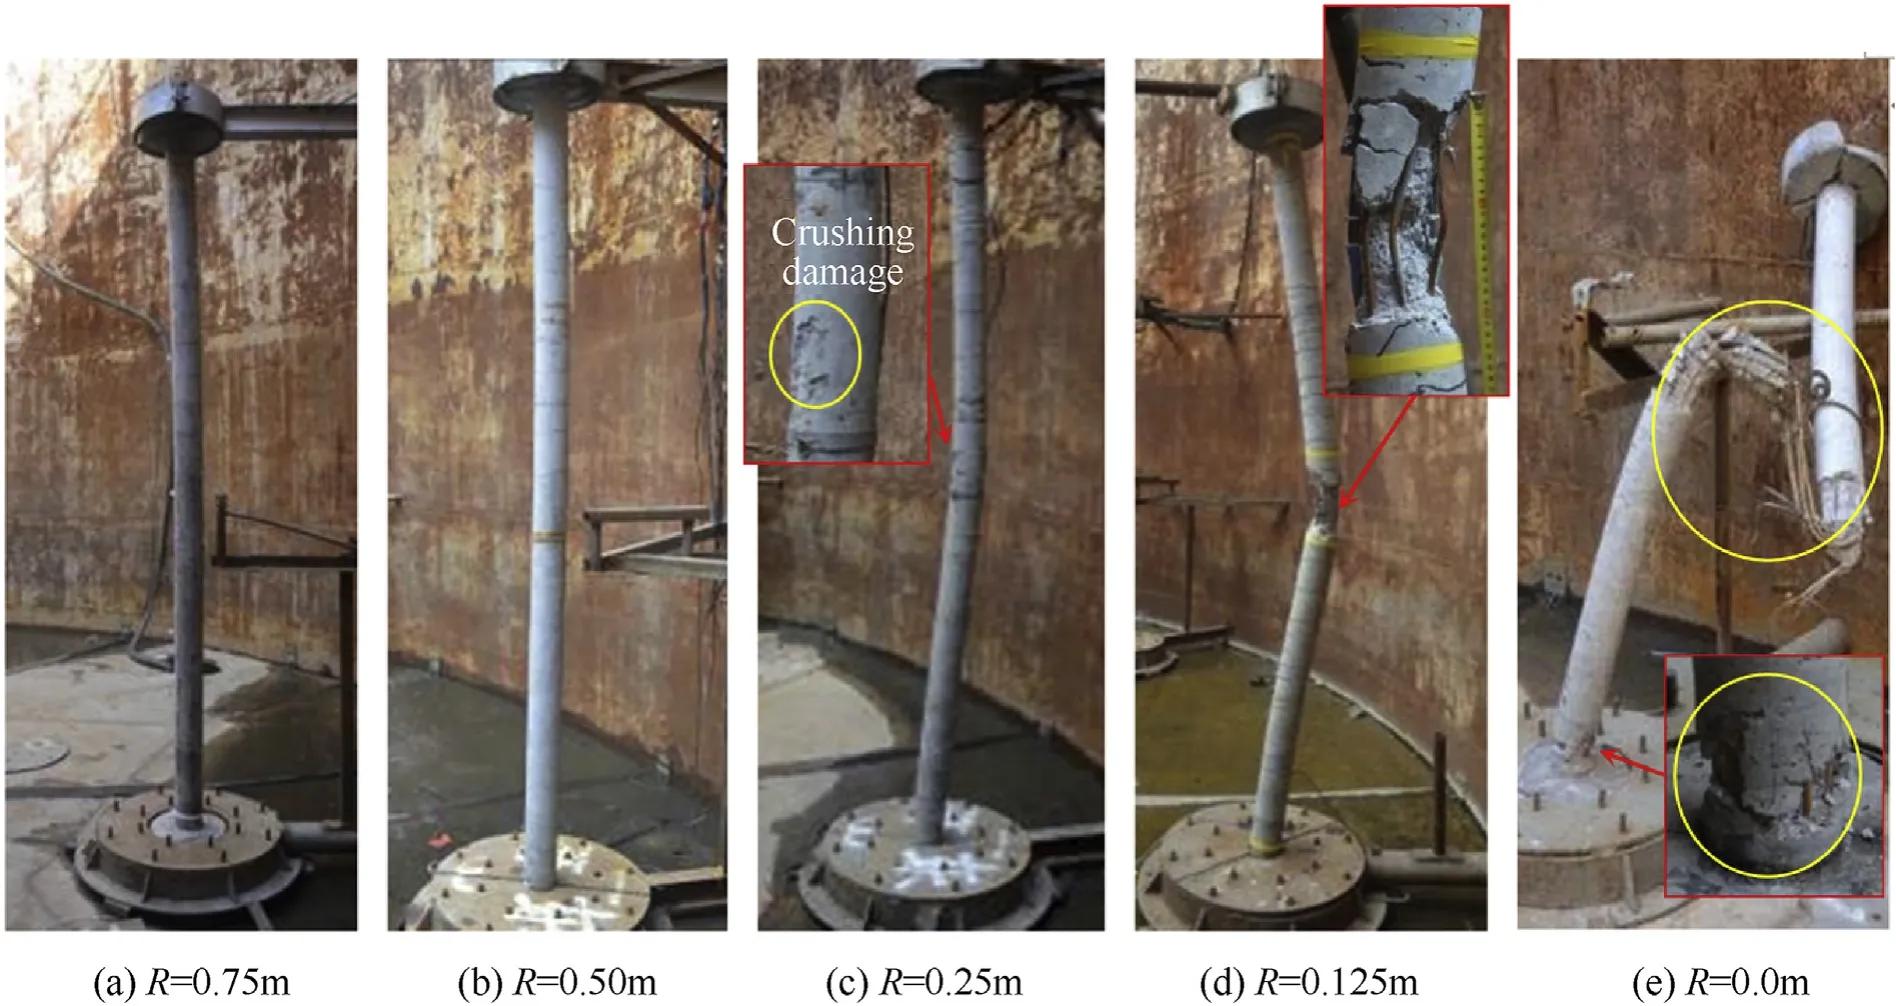
Fig. 21. Damage of experiment models (RC columns) under different stand-off distances (W=0.4 kg, H=1.0 m).
Bubble pulsation pressure: The bubble pulsation pressure was also measured by the pressure sensor and appears as the secondary peak pressure, which is much smaller than the shock wave pressure. In this experiment, the bubble pulsation pressure was observed only when the explosive quantity is small (W <0.4 kg)and the detonation depth is relatively large (H >1.0 m), in which case the free surface has less influence on the explosion.
Load distribution characteristics: The pressure load caused by the explosion shock wave is non-uniformly distributed along the axial direction of the column, where the maximum load is located at the position facing the detonation point. This non-uniformity increases as the stand-off distance decreases. At the same nondimensional stand-off distance, the peak pressure of the reflection shock wave is also the same,but the difference exists on that of diffraction shock wave.
Stand-off distance (R): The shock wave load decrease exponentially with the increase of the stand-off distance. For≥1.0 ,the reflection coefficient is less than 2.13, and the diffraction coefficient is less than 0.76. For≥1.71 , and the actual stand-off distance greater than ten times of pipe diameter, the influence of the cross-sectional size on the diffraction shock wave can be neglected. The actual shock wave load acting on the steel pipe column can be calculated as 1.37 times the load in the free field.
Detonation depth (H): The detonation depth has a significant effect on the time history characteristic of pressures, especially on bubble pulsating pressure. When the non-dimensional detonation depth () is greater than 2.15, the bubble pulsation is less influenced by the water surface. In this experiment, the critical value of=1.71 was identified, below which no bubble pulsation pressure was observed.In addition,when>0.34,the influence of the detonation depth on the peak pressure of the reflection shock wave acting on the column can be neglected.
Explosive quantity (W): For small explosive quantities (i.e.,W <0.2 kg),there exist two pressure peaks in the time curve of the pressure, corresponding to the shock wave and the bubble pulsation.For large explosive quantities(i.e.,W >0.2 kg),the explosion is influenced more by the water surface boundary,and only the shock wave peak was observed. With the same proportional stand-off distance, the peak load of the reflection shock wave is the same,but this is not the case for the diffraction shock wave.In particular,with small explosive quantities and closer stand-off distance, the explosive process is influenced more by the structure,which results in a smaller and more unevenly distributed diffraction load.
Identified damage models: Damage modes of circular RC columns include bending failure,bending-shear failure and punching failure. When the explosive quantity is small and the stand-off distance is large, the bending failure is more likely to occur. With the increase of the explosive quantity and the decrease of the stand-off distance,the shearing failure near the end of the column tends to occur,and the failure mode changes to bending-shear.The punching failure tends to occur when the stand-off distance is less than a certain value. In this case, the structure can be directly damaged by the shock wave.

Fig. 22. Time history of displacement for different detonation depths.
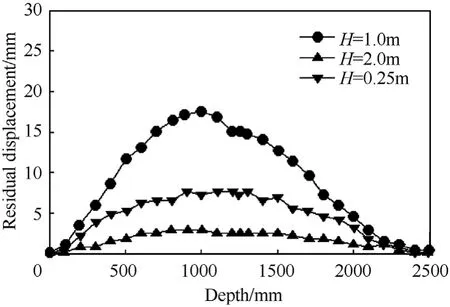
Fig.23. Residual(horizontal)displacement at each height of the vertical column after explosion.
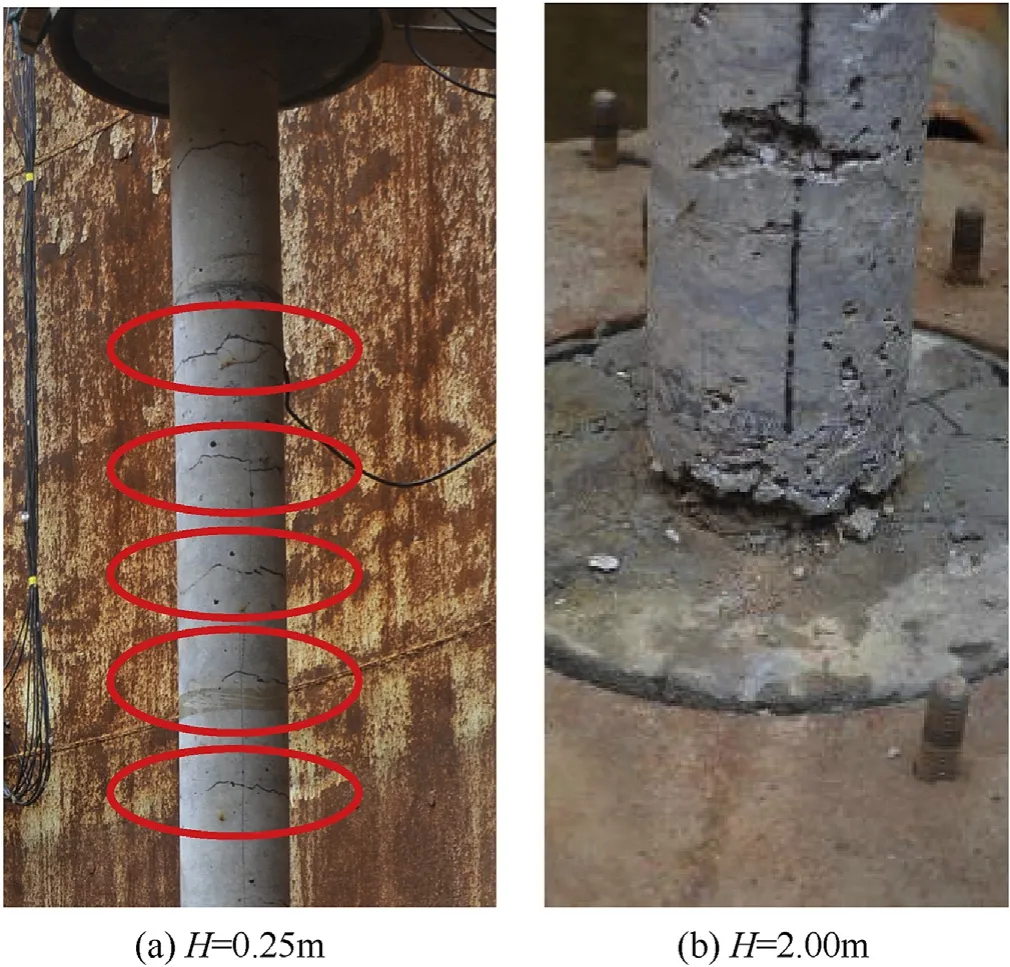
Fig. 24. Deformation and destruction results of different explosive depths.
Data availability statement
All data generated or analyzed during this study are included in this article.
Declaration of competing interest
On behalf of all authors, the corresponding author states that there is no conflict of interest.
Acknowledgments
This project is funded by the National Natural Science Foundation of China (Grant Nos. 51578543).
杂志排行
Defence Technology的其它文章
- Analysis of sliding electric contact characteristics in augmented railgun based on the combination of contact resistance and sliding friction coefficient
- Aerodynamics analysis of a hypersonic electromagnetic gun launched projectile
- Synergistic effect of hybrid Himalayan Nettle/Bauhinia-vahlii fibers on physico-mechanical and sliding wear properties of epoxy composites
- Study on dynamic response of multi-degree-of-freedom explosion vessel system under impact load
- An investigation on anti-impact and penetration performance of basalt fiber composites with different weave and lay-up modes
- Modeling and simulation of muzzle flow field of railgun with metal vapor and arc
