Nutritional Quality of Oat from Different Producing Areas in China
2020-06-16WentingLIUXinjunZHANGCaiYANGJingBAIXiaohongYANGTianliangLIHaitaoZHOU
Wenting LIU, Xinjun ZHANG, Cai YANG, Jing BAI, Xiaohong YANG, Tianliang LI, Haitao ZHOU
Zhangjiakou Academy of Agricultural Sciences, Zhangjiakou 075000, China
Abstract [Objectives] This study aimed to provide some theoretical support for breeders and processing enterprises in choosing suitable locations, in order to cultivate varieties of different functional types and complete the processing needs of different purposes. [Methods] The oat varieties that are currently being grown in large areas in different production areas were selected. In 11 provinces across China’s main oat producing areas, 15 pilot sites were deployed for unified planting management. After harvest, the contents of protein, crude fat, starch, β-glucan, avenanthramides (AVEs) and other components in oat kernels were determined. [Results] The protein content in oat kernels ranged from (10.68±1.35)% to (16.65±0.81)%, highest in Ningxia and lowest in Tibet; the fat content in oat kernels ranged from (5.15±1.06)% to (7.54±1.51)%, highest in Yunnan and lowest in Ningxia; the starch content in oat kernels was in the range of (60.70±1.62)%-(67.84±2.09)%, highest in Tibet and lowest in Jilin; the β-glucan content in oat kernels ranged from (3.67±0.42)% to (4.48±0.33)%, highest in Xinjiang and lowest in Tibet; and the AVEs content in oat kernels was in the range of (58.67±20.25)%-(535.83±133.64)%. [Conclusions] The protein and β-glucan contents in oat kernels were significantly positively correlated with latitude and longitude, and were significantly negatively correlated with altitude; the starch and fat contents in oat kernels were negatively correlated with latitude and longitude and were significantly positively correlated with altitude; the β-glucan content in oat kernels and precipitation showed a negative correlation; and the AVEs content in oat kernels was negatively correlated with latitude and was positively correlated with longitude and precipitation.
Key words Avena nuda L., Environmental factor, Nutritional quality, Correlation
1 Introduction
AvenanudaL. belongs to genusAvena, and the contents of protein, fat, starch, β-glucan and avenanthramides (AVEs) inA.nudaL. rank first among the eight staple food crops[1]. Compared with other grain crops,Avenasp. has unique characteristics and contains antilipemic component, high water-soluble colloid and nutrition-balanced protein, with extremely important value for improving human health[2-5]. In China,Avenaspp. are cultivated from Hailar of Inner Mongolia in the north to Yunnan, Guizhou and Sichuan in the south, and from Shandong, Hebei and Jiangsu in the east to Xinjiang and Tibet in the west. A total of 210 counties in 17 provinces across China cultivateAvenaspp. with a planting area of about 700 000 ha. They are spread across major ecological zones in North, Northeast, Northwest and Southwest of China. The environmental conditions vary greatly, and the yield and quality ofAvenaspp. cultivated are also quite different. Domestic scholars have analyzed and studied the quality ofAvenaspp. in different producing areas. Zhou Sumeietal.[6]studied the influence of variety, year and origin on quality of oat kernels[4, 7-8]. However, comparisons among different varieties and origins make it impossible to determine the differences in the single factor of origin, and thus it is impossible to compare the differences between different environments. In this study, 9 varieties ofA.nudaL. that are currently being grown on a large scale in different producing areas of China were selected, and 15 pilot sites were deployed in 11 provinces, the main oat producing areas in China. The seeding, planting, management and harvest ofA.nudaL. varieties were unified. After harvest, the contents of protein, crude fat, starch, β-glucan, AVEs and other components in the oat kernels were analyzed. The varieties of each pilot site were subjected to analysis of means. The quality of oat kernels in different producing areas was compared, and the correlations between various factors were analyzed, so as to provide some theoretical support for breeders and processing enterprises in choosing suitable locations, cultivate varieties of different functional types and complete the processing needs of different purposes.
2 Materials and methods
2.1 Material sources and experimental sitesFrom the 91A.nudaL. varieties that have been bred across China, 9 representative varieties that have been widely cultivated were selected. They were Baiyan No.2, Baiyan No.14, Huazao No.2, Bayou No.1, Neiyan No.5, Yanke No.1, Jinyan No.8, Jinyan No.14 and Dingyou No.1.
A total of pilot sites were selected from the oat producing areas in China, covering 10 provinces (two pilot sites were selected from some provinces with large geographical spans and averaged for analysis), from Xing’an League of Inner Mongolia in the north to Liangshan Prefecture of Yunnan Province in the south, and from Baicheng City of Jilin Province in the east to Tacheng of Xinjiang in the west. The 15 pilot sites were distributed in Hebei (1), Tibet (2), Xinjiang (2), Qinghai (1), Shanxi (2), Inner Mongolia (3), Jilin (1), Gansu (1), Ningxia (1) and Yunnan (1) (Table 1).
2.2 Experimental design and field managementSequential arrangement method was adopted, one replicate for each variety. One variety was planted in one plot. The area of each plot was 36 m2to ensure that the yield of seeds harvested could reach 5 kg. Plots of medium to high grade, with flat terrain, even fertility and consistent previous crop (not oat) were selected. The sowing mode was the same as the local field production. Before sowing, the seeds were mixed with 0.3% carbendazim or other pesticide to prevent covered smut. Diammonium phosphate (75 kg/ha) was applied as seed fertilizer. The seeds were sown in dry land. Top dressing was not conducted during the growth period. Other field management was the same as local production. Under the premise of ensuring the normal growth and development ofA.nudaL., there was no need to water. In case of special drought, the plots could be irrigated properly. Harvest was carried out at proper time[5].
Table 1 Environmental conditions in different pilot sites

CodePlanting areaLongitudeLatitudeAltitude∥mAveragetemperature∥℃Averageprecipitation∥mm1Zhangbei, Hebei114.73° E41.13° N1 450.015.9329.62Wumeng, Inner Mongolia113.12° E40.98° N1 379.05.1255.03Wuchuan, Inner Mongolia111.15° E41.13° N1 600.03.0354.14Datong, Shanxi113.20° E40.10° N1 067.06.4384.05Youyu, Shanxi112.45° E40.00° N1 345.816.3432.16Dingxi, Gansu104.37° E35.57° N1 903.27.0425.07Baicheng, Jilin122.49° E45.62° N155.417.8307.48Xingan League, Inner Mongo-lia122.03° E46.10° N286.04.1416.79Guyuan, Ningxia106.30° E36.08° N1 600.06.5493.510Haidong, Qinghai101.37° E36.47° N2 620.03.7481.011Diqing, Yunnan99.73° E27.28° N3 280.06.0703.012Shannan, Tibet91.78° E29.13° N3 638.08.2394.013Shigatse, Tibet88.86° E29.27° N3 844.06.3420.014Changji, Xinjiang89.20° E44.22° N830.023.9103.915Tacheng, Xinjiang82.68° E46.35° N415.019.7108.6
2.3 Nutritional quality analysisCrushed kernels, stones and other miscellaneous matters in the 135 samples harvested were removed. Oat kernels with coat and husk were picked out, crushed with a centrifugal mill, filtered through 0.25 mm filter and stored in a cool place. The contents of moisture, crude protein, crude fat and crude starch were determined according to GB/T 20264-2006, GB/T 5519-2008, GB/T 14772-2008 and GB/T 5006-1985, respectively. The content of β-glucan was determined with β-Glucan (Mixed Linkage) Assay Kit (Megazyme), referring to AOAC995.16 method. The content of AVEs was determined by high performance liquid chromatography (HPLC) (Fig.1), referring to the method of Ren Yetal.
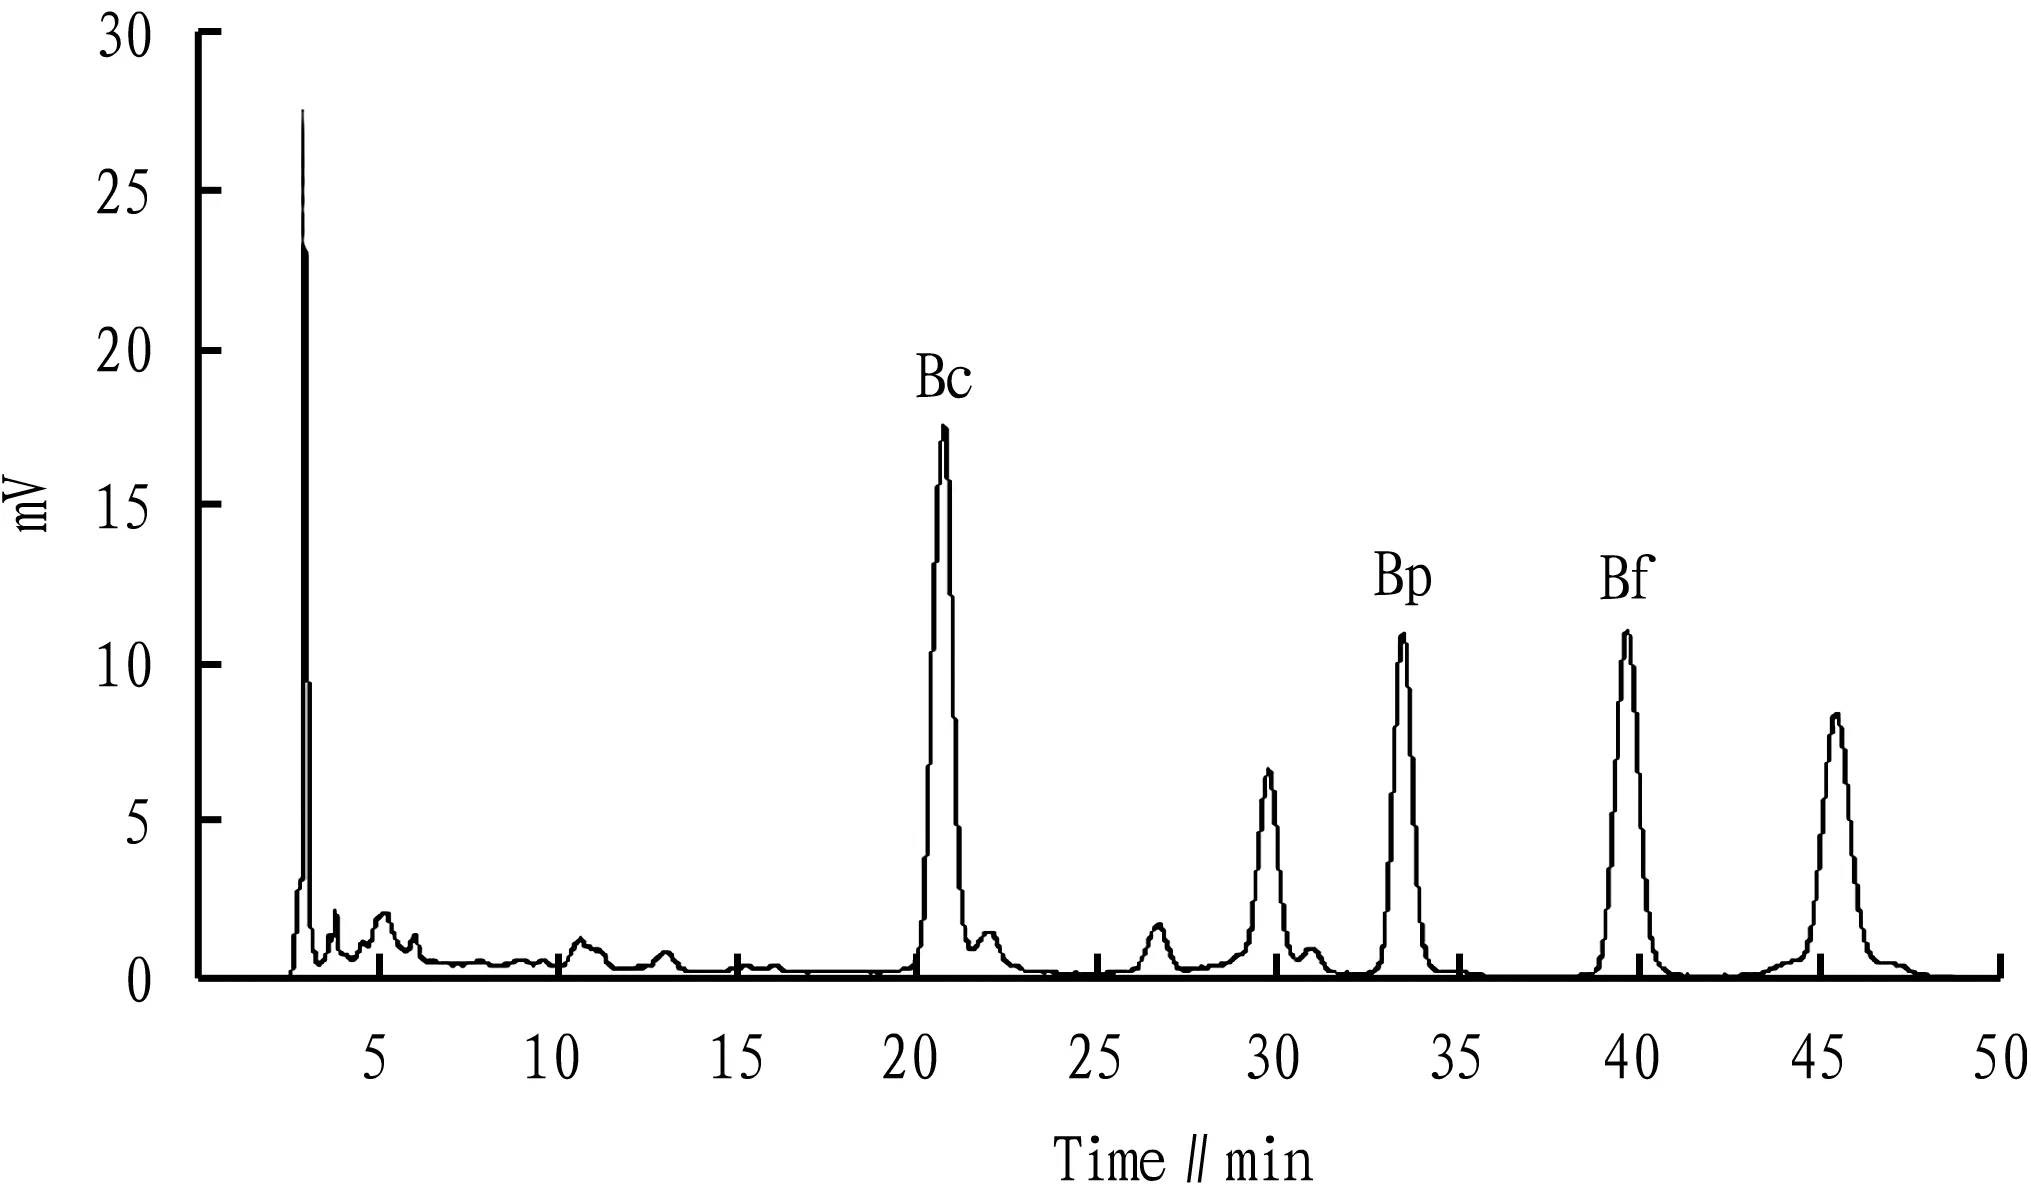
Fig.1 Chromatographic identification of avenanthramides (AVEs)
2.4 Data analysisData processing was performed using Microsoft Excel. DPS software was used for significance analysis. The confidence level ofttest was set at α = 0.05. SPSS 17.0 software was used for correlation analysis.
3 Results and analysis
3.1 Analysis on yield of oat in different producing areasAs shown in Fig.2, the differences between Hebei, Xinjiang and other areas (except Qinghai) were significant (P<0.05). The differences among different producing areas were greater than those among different varieties. In terms of the average yield of the experimental varieties, among different producing areas, the average yield in Hebei was the highest (3 425.21 kg/ha), followed by that in Xinjiang (3 285.30 kg/ha), and the average yield in Sichuan was the lowest (626.67 kg/ha).
3.2 Comparison ofA.nudaL. nutritional quality among different producing areasAn analysis of variance was performed on the quality of oat kernels harvested from different producing areas. Table 2 shows that most averages have significant differences (P<0.05). The crude protein content in oat kernels harvested from Ningxia was the highest (16.65±0.81)%, and that in oat kernels harvested from Tibet was the lowest (10.68±1.35)%. The average crude starch content in oat kernels ranged from (60.70±1.62)% to (67.84±2.09)%, lowest in Jilin and highest in Tibet. Yunnan showed the highest crude fat content
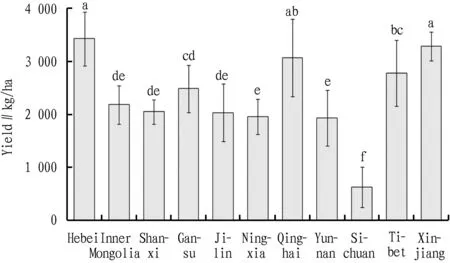
Fig.2 Variance analysis on yields ofAvenanudaL. in different producing areas
(7.54±1.51)%, while Ningxia showed the lowest content (5.15±1.06)%. The average β-glucan content was in the range of (3.67±0.42)% to (4.48±0.33)%, highest in Xinjiang and lowest in Tibet. The AVEs content in oat kernels was highest in Ningxia (535.83±133.64) mg/g and lowest in Hebei (58.67±20.25) mg/g. Even for the same variety that was planted in different producing areas, the results obtained were different due to different environments.
3.3 Variance analysis of nutritional quality ofA.nudaL. from different producing areasAccording to the geographical location, the planting areas were classified into four regions: North China, Northeast China, Southwest China and Northwest China. Hebei, Inner Mongolia and Shanxi belonged to North China, Jilin belonged to Northeast China, Gansu, Ningxia, Qinghai and Xinjiang belonged to Northwest China, and Yunnan, Sichuan and Tibet belonged to Southwest China. The results are shown in Fig.3-Fig.7. The crude protein content in oat kernels differed significantly between North China, Northeast China and Southwest China (P<0.05). The oat kernels harvested from Northeast China showed the highest crude protein content (15.75%), and those harvested from Southwest China showed the lowest crude protein content (12%). The crude fat contents in oat kernels harvested from Southwest China and North China, Northeast China, Northwest China were significantly different (P<0.05). Southwest China showed the highest crude fat content (6.99%), while Northeast China showed the lowest crude fat content (5.28%). There were significant differences in crude starch content of oat kernels between Northwest China, Southwest China and Northeast (P<0.05). The oat kernels harvested from Northwest China had the highest crude starch content (65.72%), and those harvested from Northeast China had the lowest crude starch content (60.88%). The β-glucan content in oat kernels was lowest in Northwest (3.79%) and highest in Northeast (4.35%), and the difference between them was insignificant (P>0.05). In terms of AVEs content in oat kernels, North China was lowest (209.76 mg/g), and Northeast was highest (451.30 mg/g). These experimental results can provide a basis for processing enterprise to choose a suitable processing location.
Table 2 Variance analysis on quality ofAvenanudaL. in different producing areas

CodePlanting areaProtein∥%MeanRangeStarch∥%MeanRangeFat∥%MeanRangeβ-glucan∥%MeanRangeAVEs∥mg/gMeanRange1Hebei15.94±1.34 f12.42-17.0162.27±1.98 f58.40-64.665.87±1.28 h3.37-7.004.28±0.69 e3.82-5.0758.67±20.25 n33.19-105.572Inner Mongolia15.69±1.01 h12.81-16.1060.81±3.37 i55.13-66.865.31±1.02 l3.09-5.924.37±0.41 b3.93-5.22175.29±97.3 h117.23-631.393Shanxi15.08±0.61 a12.36-17.7761.12±1.03f g55.78-63.216.25±1.21 k3.18-8.244.32±0.33 f3.49-5.53395.31±159.92 d176.17-615.884Gansu16.33±0.86 c15.25-17.9661.97±2.81 g56.64-65.236.05±1.34 g3.60-7.214.47±0.53 c3.67-5.28202.43±80.62 i129.79-352.615Jilin15.89±1.66 g11.37-17.5060.70±1.62 ij58.25-64.125.46±1.12 k3.35-6.464.35±0.38 d3.51-5.67451.30±121.11 c148.57-654.796Ningxia16.65±0.81 b15.53-18.2860.87±2.19 hi57.71-63.945.15±1.06 ml3.09-6.294.13±0.28 gf3.75-4.43535.83±133.64 a327.67-690.557Qinghai11.68±1.07 m10.40-13.7066.02±2.50 d60.97-68.956.62±1.26 e4.21-8.094.11±0.55 g3.33-4.93134.89±60.70 j71.70-254.848Yunnan12.84±1.44 k9.98-14.5263.71±1.36 e61.01-65.277.54±1.51 a4.58-8.813.87±0.31 h3.32-4.20331.94±124.14 f182.94-546.889Sichuan12.42±0.78 l11.29-13.9267.08±1.51 c65.34-69.286.77±1.31 d4.54-8.023.83±0.48 h3.17-4.40227.87±270.99 g31.05-698.7210Tibet10.68±1.35 n9.10-12.7667.84±2.09 a65.35-70.917.29±1.56 b4.53-8.873.67±0.42 i3.03-4.40355.95±241.67 b186.32-676.4211Xinjiang13.31±0.67 i11.36-14.7866.72±1.38 d63.82-70.635.97±1.10 i3.44-7.184.48±0.33 c4.06-4.8871.70±30.72 o31.87-134.75
Note: Different lowercase letters in the same column indicate significant differences at the 0.05 level.

Fig.3 Variance analysis on crude protein contents ofAvenanudaL. cultivated in different regions
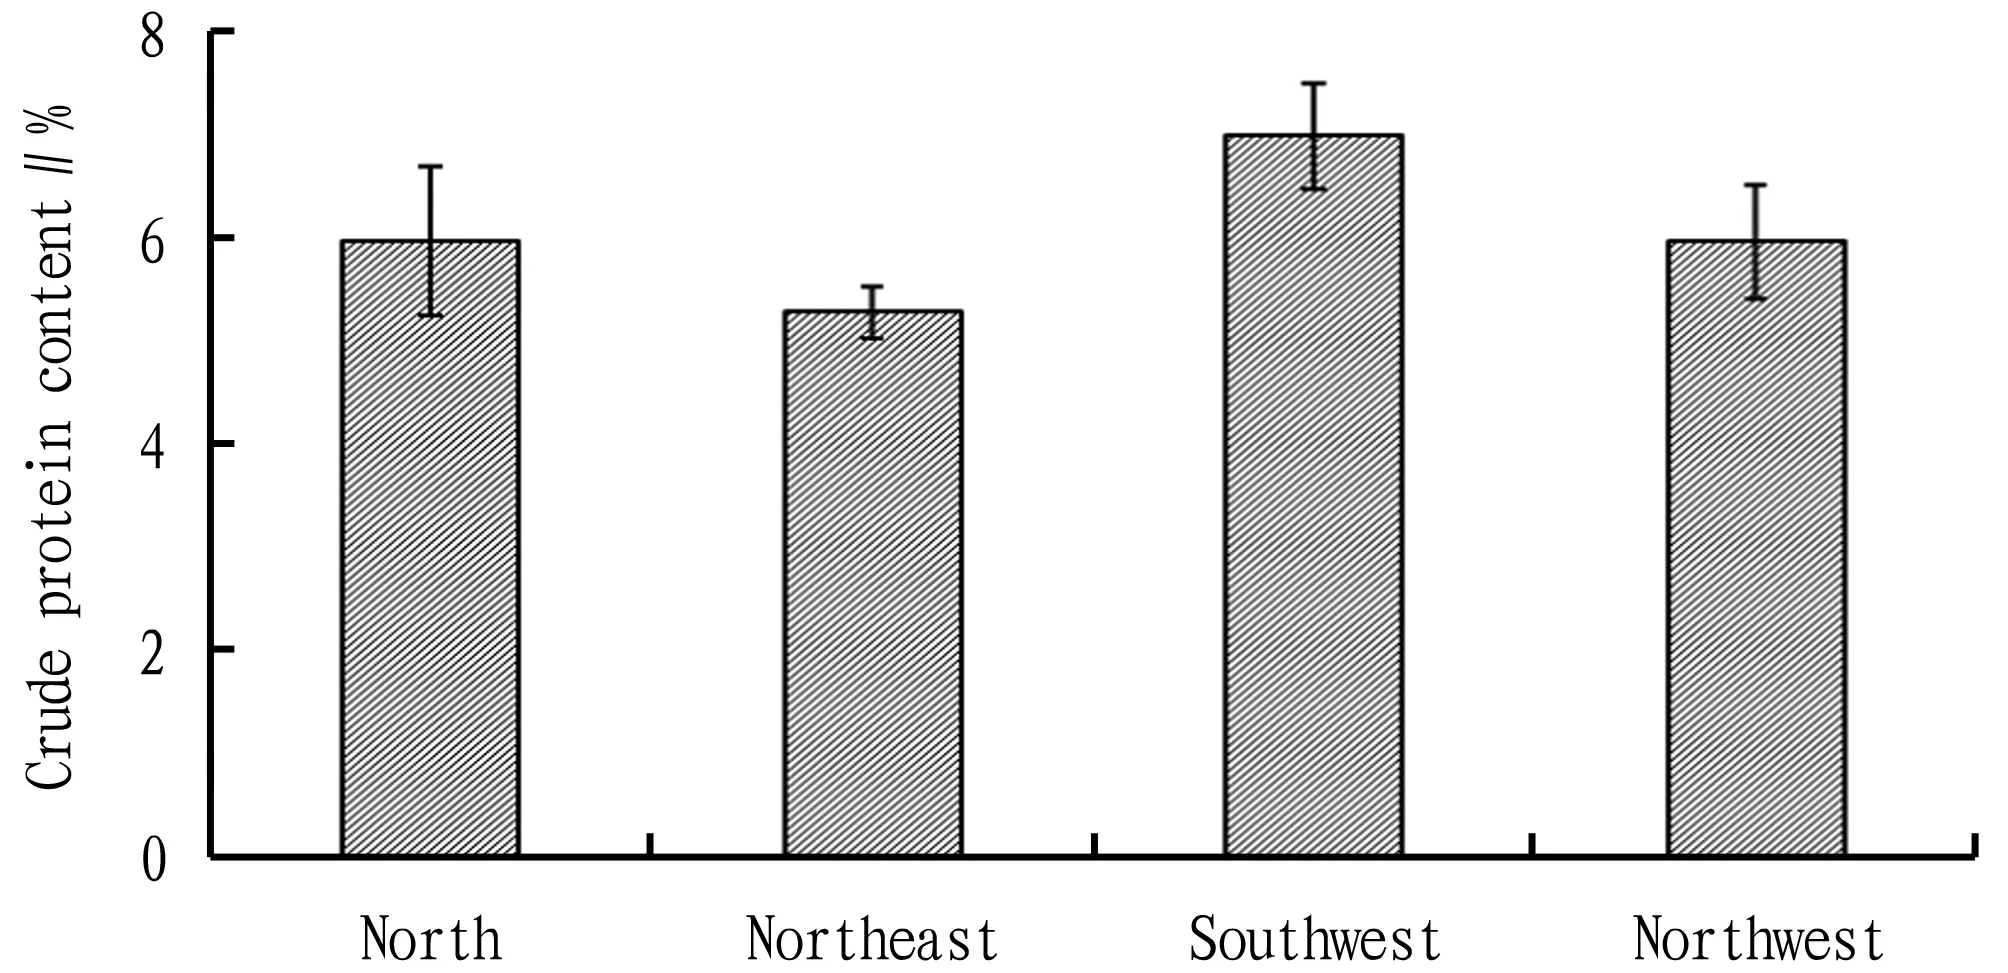
Fig.4 Variance analysis on crude fat contents ofAvenanudaL. cultivated in different regions

Fig.5 Variance analysis on crude starch contents ofAvenanudaL. cultivated in different regions
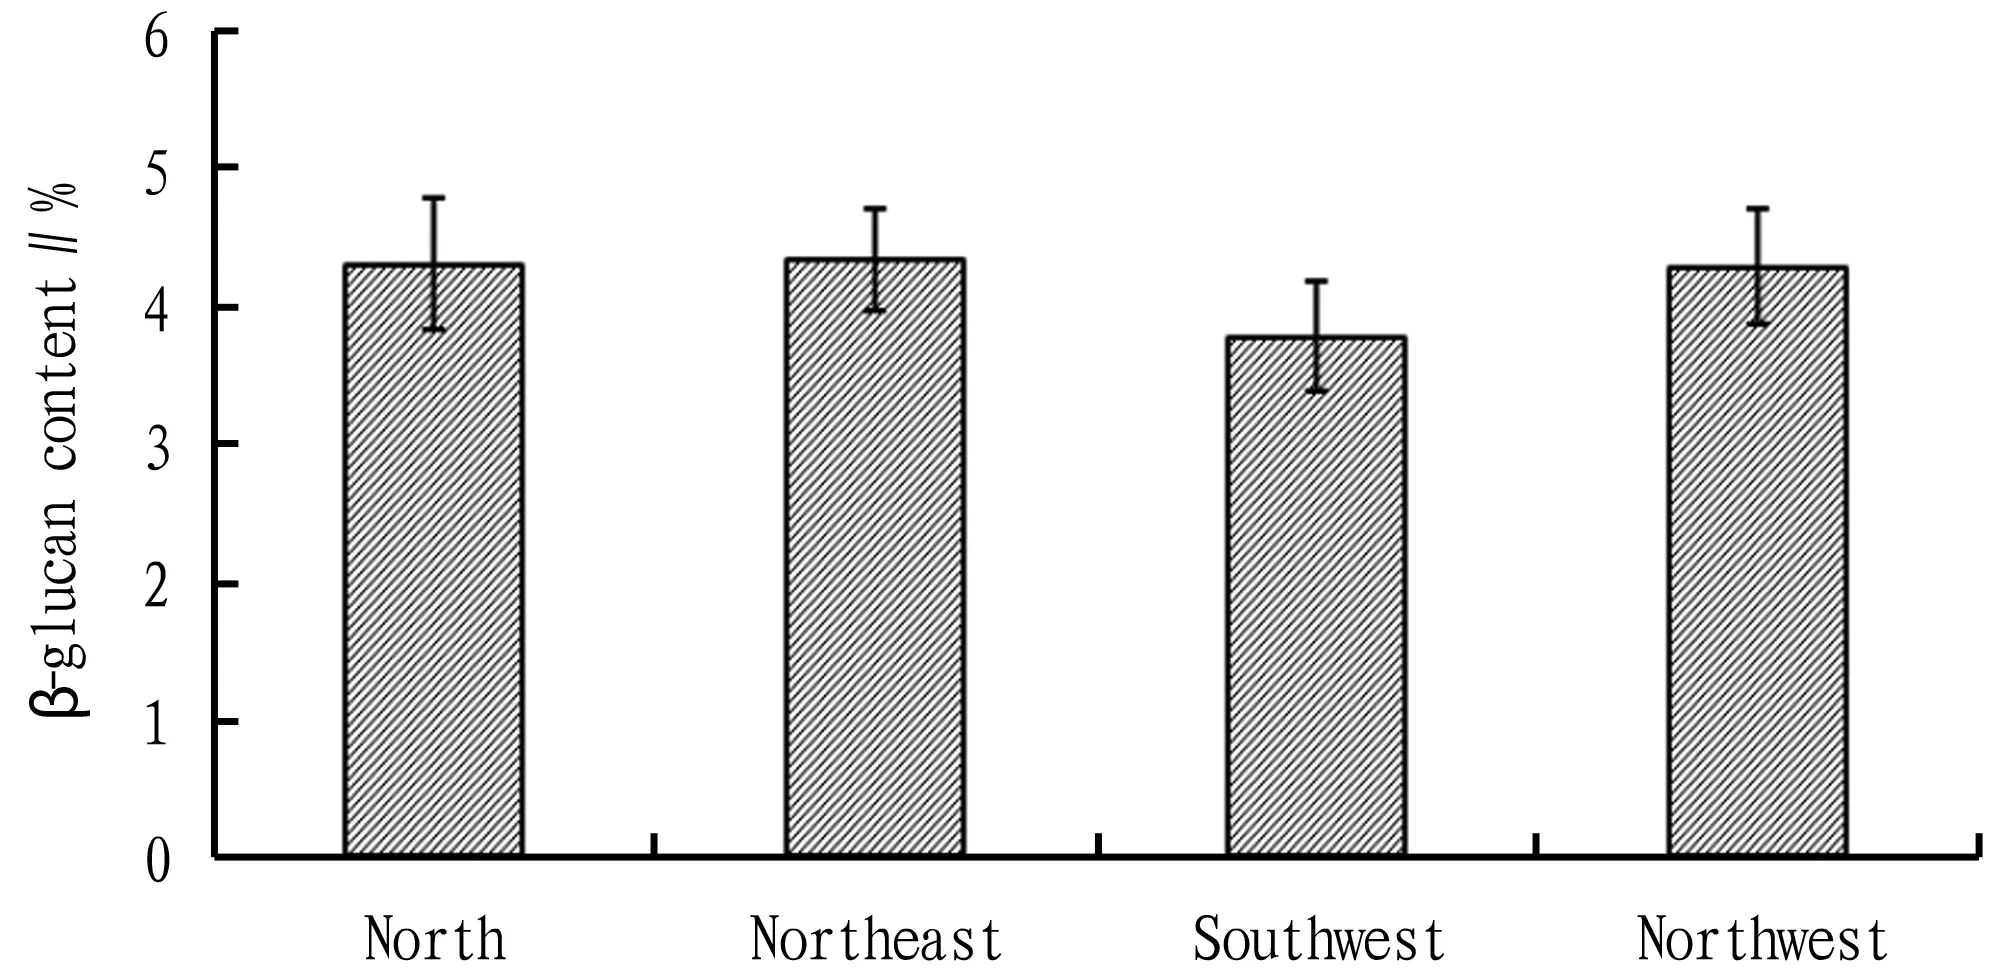
Fig.6 Variance analysis on β-glucan contents ofAvenanudaL. cultivated in different regions

Fig.7 Variance analysis on AVEs contents ofAvenanudaL. cultivated in different regions
3.4 Correlation analysis between nutritional quality and yield ofA.nudaL. in different producing areasThe correlation between yield and nutritional quality ofA.nudaL. in different producing areas was analyzed, and the obtained correlation coefficients and their significance levels are shown in Table 3. The results show that there was no significant correlation between yield and moisture, crude protein, crude fat and crude starch contents (P>0.05), while the crude protein content was negatively correlated with crude fat content (-0.722,P<0.05) and crude starch content (-0.857,P<0.01) in different producing areas.
3.5 Correlation analysis between nutritional quality ofA.nudaL. and environmental factorsThe relationships between environmental factors (including geographical and climatic factors) and oat quality are shown in Table 4. The results show that the protein content in oat kernels was positively correlated with longitude (P<0.01,r=0.61) and latitude (P<0.01,r=0.40), and was negatively correlated with altitude (P<0.01,r=-0.53). This is consistent with the characteristics of other dicotyledonous plants (Stehmann, 1976)[9]. The starch and fat contents in oat kernels were negatively correlated with longitude (P<0.01,r=-0.71;P<0.01,r=-0.28) and latitude (P<0.01,r=-0.27;P<0.01,r=-0.37), and were positively correlated with altitude (P<0.01,r=0.38;P<0.01,r=0.39). There was a positive correlation between fat content in oat kernels and precipitation (P<0.01,r=0.25). The β-glucan content in oat kernels was positively correlated with longitude (P<0.01,r=0.76) and latitude (P<0.01,r=0.45), and was negatively correlated with altitude (P<0.01,r=-0.47). There was no correlation between β-glucan content in oat kernels and average temperature, consistent with the finding of Andersson and Borjesdotter[10]. The study found that the β-glucan content in oat kernels was negatively correlated with precipitation, consistent with the research result of Brunner[11](Brunner and Freed, 1994). The AVEs content was negatively correlated with latitude (P<0.01,r=-0.26), and was positively correlated with longitude and precipitation (P<0.01,r=0.17;P<0.01,r=0.31). At the same time, it was also found that the content of AVES, different from other nutrients, had a negative correlation with the average temperature, which might be related to the stress response of secondary metabolites.
Table 3 Correlation between yield and nutritional quality ofAvenanudaL. in different areas

YieldCrude proteincontentCrude fatcontentCrude starchcontentYield-0.2080.0250.460Crude protein content-0.208-0.722*-0.857**Crude fat content0.025-0.722*0.598Crude starch content0.460-0.857**0.598
Note:*represents a significant correlation at the 0.05 level (bilateral), and**represents a significant correlation at the 0.01 level (bilateral). The same below.
Table 4 Correlations between nutritional quality ofAvenanudaL. and environmental factors

CrudeproteinCrudestarchCrudefatβ-glucanAVEsLongitude0.61**-0.71**-0.28**0.37**0.17*Latitude0.40**-0.27**-0.37**0.45**-0.26**Altitude-0.53**0.38**0.39**-0.47**0.13Average temperature-0.100.160.000.08-0.31**Precipitation-0.08-0.150.25**-0.19*0.31**
4 Discussion
In China,Avenaspp. are cultivated from Hailar of Inner Mongolia in the north to Yunnan, Guizhou and Sichuan in the south, and from Shandong, Hebei and Jiangsu in the east to Xinjiang and Tibet in the west, covering a total of 210 counties in 17 provinces with a planting area of about 700 000 ha[6]. The planting areas are spread across major ecological zones in North China, Northeast China, Northwest China, and Southwest China. The environmental conditions vary greatly, and the yield and quality of oat kernels are also quite different. In this study, the crude protein content was highest in Northeast China and lowest in Southwest; the crude fat content was highest in Southwest China and lowest in Northeast; the crude starch content was highest in Northwest China and lowest in Northeast China; the β-glucan content was lowest in Northwest China and highest in Northeast China; and the AVEs content was lowest in North China and highest in Northeast China. These results can provide a basis for processing enterprises to select various types of suitable processing areas. From the perspective of specific producing areas, Ningxia had the highest protein content, the lowest fat content, and the second lowest starch content (only higher than Jilin), consistent with the results of correlation analysis between protein, fat and starch contents; Tibet showed the lowest protein content and relatively higher fat and starch contents; the crude fat content was highest in Yunnan and lowest in Ningxia; the starch content was highest in Xinjiang and lowest in Shanxi; the β-glucan content was highest in Jilin and lowest in Sichuan; and the AVEs content was highest in Ningxia and lowest in Hebei. When the same variety was cultivated in different areas, the results obtained were different due to different environments. These results can provide some theoretical support for breeders in choosing breeding sites to breed varieties of different functional types.
The results of correlation analysis between yield and nutritional quality in different producing areas show that there was no significant correlation between yield and crude protein, crude fat and crude starch, and the crude protein was negatively correlated with crude fat (-0.722,P<0.05) and crude starch (-0.857,P<0.01).
Illumination, temperature, moisture, atmospheric pressure, soil, etc. all change with the change of altitude[12-13]. Every time altitude increases by 100 m, temperature will drop 0.5-0.6 ℃, illumination will increase by 4%-5%, and ultraviolet radiation will increase by 3%-4%[14]. On the same latitude, as the altitude increases, the temperature, illumination and other conditions will change significantly. This directly affects the growth and development ofAvenaspp., thus causing changes in appearance quality and intrinsic nutritional quality of oat kernels[15-16].
Protein content in oat kernels was significantly positively correlated with longitude and latitude, but was significantly negatively correlated with altitude. Starch and fat contents of oat kernels were negatively correlated with longitude and latitude, but were significantly positively correlated with altitude. There was a positive correlation between oat kernel fat content and precipitation. β-glucan content was positively correlated with longitude and latitude, but negatively correlated with altitude and precipitation. There was no correlation between β-glucan content in oat kernels and average temperature. AVEs content was negatively correlated with latitude, and positively correlated with longitude and precipitation. In addition, the study found that the content of AVEs in oat kernels, different from those of other nutrients, had a negative correlation with average temperature. This might be related to the stress response of secondary metabolites.
杂志排行
Asian Agricultural Research的其它文章
- Empirical Study on the Benefit Increase of New Contract Farming 1+3+X Model
- Effect of Land Use on Flood Resilience
- Influencing Factors of Rural Land Internal Circulation Market in Guangdong Province
- Effects of Herba Picriae Extract on Growth Performance and Immune Organ Index of Guangxi Partridge Chickens
- Study on the Present Situation and Influencing Factors of Farmers’ Agricultural Insurance Demand in Poverty-Stricken Mountainous Areas: Survey and Analysis of 115 Farmers in Enshi Autonomous Prefecture of Hubei Province
